
 Open Access Article
 This Open Access Article is licensed under a Creative Commons Attribution-Non Commercial 3.0 Unported Licence
High-purity C3N quantum dots for enhancing fluorescence detection of metal ions†
Huan Yang‡
ab,
Changdao Han‡c,
Jie Jiang*a,
Pei Li *ab and
Liang Chena
*ab and
Liang Chena
aSchool of Physical Science and Technology, Ningbo University, Ningbo 315211, China. E-mail: lipei@nbu.edu.cn; jiejiang1@nbu.edu.cn
bState Key Laboratory of Surface Physics, Department of Physics, Fudan University, Shanghai 200433, China
cDepartment of Optical Engineering, College of Optical, Mechanical and Electrical Engineering, Zhejiang A&F University, Hangzhou 311300, China
First published on 2nd April 2024
Abstract
A new type of two-dimensional layered material, namely C3N, has been fabricated by polymerization and recommended to have great potential in various applications such as the development of electronic devices or photo-detectors, due to its enhanced conductivity, electronegativity, and unique optical properties. Actually, most of the present research on C3N is limited in the scope of theoretical calculation, while experimental research is blocked by inefficient synthesis with low purity and homogeneity. Here, we report an optimized efficient synthesis method of high-purity C3N QDs in aqueous solution by polymerization of DAP with combined centrifugation and filtration of products, with the synthesis yield up to 33.1 ± 3.1%. Subsequently, the C3N QDs have been used as novel metal ion probes exhibiting a sensitive fluorescent response to various metal ions including monovalent alkaline metals (Li+, Na+, and K+), divalent alkaline-earth metals (Mg2+, Ca2+, and Sr2+), and multivalent transition metals (Cu2+, Co2+, Ni2+, and Au3+, Fe3+, Cr3+) due to the high electronegativity of the C3N surface. Particularly, the fluorescent quenching response of Al3+, Ga3+, In3+, and Sc3+ ions is significantly different from the fluorescent enhanced response of most other carbon-based QDs, which is promising for enriching the detection methods of these metal ions and beneficial to improve the accuracy of ion recognition.
1. Introduction
Due to their unique physical and chemical properties, two dimensional (2D) graphene-based materials have attracted sustained and widespread interest in fundamental and applied research, including sensors,1,2 ion sieving,3,4 catalysis,5 and electronic devices.6 To enrich the electrical properties of graphene for various applications, doping or modification methods are commonly used,7–9 such as regulating the bandgap of graphene,10 improving the conductivity of graphene oxide,11,12 or improving the thermal conductivity of reduced graphene oxide.13 Particularly, in optics, graphene quantum dots (GQD) gained a lot of attention due to their tunable bandgap for fluorescence properties, excellent photostability, good biocompatibility and low toxicity, with wide applications in drug delivery, bioimaging and biosensing.14,15 Element doping is the most common pathway used to regulate the PL intensity and wavelength of GQDs to further improve the optical performance.16,17 Among the numerous candidates as dopants, for example nitrogen (N), sulfur (S), boron (B), and phosphorus (P), nitrogen (N) owns the advantages of having a comparable atomic size to carbon (C) atoms, strong bond formation induced by its five valence electrons, and potentially strong electronegativity.18,19However, there exists significant instability in performance obtained by extremely high doping, as these methods often rely on a large number of defects or molecular adsorption on graphene, resulting in uneven distribution of dopants and unstable structures, i.e., it is challenging to obtain 2D graphene-based materials such as N-doped GQDs with excellent performance as well as a stable structure through high doping. Therefore, some scientists have turned their attention to bottom-up synthesis of 2D Carbon-nitrogen (CxNy) materials (including carbon-nitrogen QDs) directly with periodic distributions of elements and stable lattice structure.
2D Carbon-nitrogen materials, with a structure similar to graphene and a high nitrogen content, such as g-C3N4,20 C3N5,21 C3N3,22,23 C1N1,24 C2N,25 and C3N,26,27 have recently gained widespread attention in theoretical and experimental research. Especially, compared to graphene, with enhanced electrical conductivity, electronegativity, and good biocompatibility. While, C3N, as an emerging star among 2D CxNy materials, possesses great potential in electrical,27,28 optoelectronics,29 and medical fields,30 benefiting from its exceptionally stable structure based on an orderly distribution of covalently bound nitrogen atoms.31 Recently, Yang et al.27 have utilized a conventional hydrothermal method to synthesize the C3N QDs with a relatively long lifetime, and tuned the PL of C3N QDs over the entire visible range (400–660 nm) up to the IR region based on the size dependence of the bandgap. Pei et al.32 have found that the emission energy of C3N QDs can be doubly modulated by size and edge effects through an artificial neural network (ANN) combined with statistical learning. They have established the relationship between geometrical/electronic structures of ground states and emission wavelength for C3N QDs, and provided a general approach to atomically precise design the full-color fluorescent carbon-based QDs with targeted functions and high performance. Actually, C3N QDs are considered suitable for use in photodetectors to improve the response time, sensitivity and wavelength range of detection, not only because of the potentially excellent optical properties, such as the strong light absorption efficiency, the wide spectral range to IR, but also the contributions to increasing the lifetime of photogenerated carriers and transfer efficiency.28,29,33 Besides, benefiting from the higher bio-compatibility and degradability of C3N QDs, the applications as biosensors or pharmaceuticals have been reported, for example, in the detection of xanthine and alpha-fetoprotein (one kind of tumor markers) by the localized surface plasmon resonance (LSPR) effect,34,35 and the inhibition of the aggregation of Aβ peptides against Alzheimer's disease (AD) by the specific π–π stacking and hydrogen bonding interactions.30
Unfortunately, limited by the lack of efficient strategies to synthesize C3N or C3N QDs with high purity and homogeneity, most of the related research works stay at the theoretical level.36–40 Therefore, it is of great importance to overcome the shortages of existing synthesis methods to efficiently acquire C3N or C3N QDs with advanced performance, especially for the development of experimental studies and application promotions of C3N.
Here, we report an efficient synthesis of C3N quantum dots (QDs) with high purity and homogeneity through optimized solvothermal treatment of 2,3-diaminophenazine (DAP). The yield can reach up to 33.1 ± 3.1%, and the lateral size of the obtained single- or bi-layered C3N QDs ranges from 10 to 25 nm, with the central value at 20 nm. The lattice configuration and the elemental ratio of C3N were confirmed by transmission electron microscopy (TEM) and X-ray photoelectron spectroscopy (XPS), respectively. Then, these obtained C3N QDS have been used as the metal ion probe for the first time. Remarkably, the high-purity C3N QDs exhibit a sensitive fluorescent response to various metal ions, including monovalent alkaline metals, divalent alkaline-earth metals, and multivalent transition metals, especially for fluorescence detection of Al3+, Ga3+, In3+, and Sc3+ ions, which cannot be achieved by traditional graphene QDs (GQDs). We attribute the excellent performance to the high electronegativity of the C3N surface, which arises from the numerous N sites,28–30 greatly enhancing the adsorption of metal ions. Thus, our findings represent a facile step towards efficient synthesis of C3N QDs with high purity and homogeneity for various applications.
2. Materials and methods
2.1 Materials
2,3-Diaminophenazine (DAP, 91.56 ± 2.0%) was purchased from Stanford Analytical Chemicals Inc. Organic nylon filter membranes (Φ 50 mm, 0.1 μm porus) were purchased from Haining Delv New Material Technology Co., Ltd. The ultrafiltration tube (15 mL, 1 kDa, 7500×g) was purchased from Pall Corporation. All chemical reagents of analytical grade including LiCl, NaCl, KCl, MgCl2·6H2O, CaCl2, SrCl2, CuCl2·2H2O, NiCl2·6H2O, CoCl2·6H2O, CrCl3, FeCl3·6H2O, AuCl3, AlCl3, ScCl3, GaCl3 and InCl3 were obtained from Shanghai Aladdin Biochemical Technology Co., Ltd. (China). Various salt solutions were prepared from deionized water with an electrical resistivity of 18.2 MΩ cm.2.2 Preparation of C3N quantum dots (QDs)
The C3N suspensions were prepared by a facile solvothermal method21 based on which the purification methods for both raw materials and products were optimized. Specifically, the DAP powder (19.0 mg) was first dissolved in 90.0 mL deionized water by grinding and ultrasonic pulverization. DAP aqueous solution was left to settle for 2 h, and then about 85.0 mL of DAP supernatant (∼0.45 mM) was transferred to a reactor and heated at 518 K for 89 hours. Until the reaction was over, centrifuged the suspension of products at 20![[thin space (1/6-em)]](https://www.rsc.org/images/entities/char_2009.gif) 000 rpm for 1 h to remove impurities, followed by filtering the supernatant using 0.1 μm organic nylon filter membranes and 1 kDa ultrafiltration tube. C3N QDs solution with a concentration of 0.036 mg mL−1 was obtained, and the synthesis rate was up to 33.1 ± 3.1% (see eqn (S1)†).
000 rpm for 1 h to remove impurities, followed by filtering the supernatant using 0.1 μm organic nylon filter membranes and 1 kDa ultrafiltration tube. C3N QDs solution with a concentration of 0.036 mg mL−1 was obtained, and the synthesis rate was up to 33.1 ± 3.1% (see eqn (S1)†).
2.3 Characterization methods
Atomic force microscope (AFM, Cypher S, Oxford Instruments Oxford Instruments Technology (Shanghai) Co., England) was used to determine the height and particle diameter of C3N QDs. AFM images were obtained under the mode of AC Air Topography using a silicon tip coated with gold at a force constant of 3.10–37.60 N m−1. The morphology, particle size, and lattice configuration of C3N QDs were carried out on transmission electron microscopy (TEM, Talos F200C, Thermo Fisher Scientific, America). The size distribution was further confirmed by nano-particle size analyzer (BeNano 180 Zeta Pro, Dandong Baxter Instrument Co., China) with detection angle of 173°. Chemical element content X-ray photoelectron spectra (XPS, K-Alpha, Thermo Fisher Scientific, America) with an excitation source of Al Kα rays (hv = 1486.60 eV) was used to quantify the elemental contents of C3N QDs. Ultraviolet-visible (UV-vis) spectra were obtained by a UV-vis/NIR spectrophotometer (UH4150, Hitachi High-Tech Science Corporation, Japan) in the wavelength range of 200–800 nm. The photograph of C3N QDs under ultraviolet (UV) light (wavelength 365 nm) was taken with illumination by a UV analyzer (ZF-7N, Shanghai Jiapeng Technology Co., Ltd, China). All fluorescence spectra (FL) were obtained by a fluorescence spectrophotometer (F-4600, Hong Kong Tian mei Co., Ltd, China) with all slit widths of 0.5 nm. The fluorescence lifetime was obtained with a fluorescence lifetime spectrometer (FL3-111, Horiba, French). Fourier transform infrared (FTIR) spectra were measured using a Cary 600 Series FTIR Spectrometer (Micro-FTIR, Cary 660 + 620, Agilent Technologies Inc., America). The spectral range of FTIR was 650–4000 cm−1.2.4 Fluorescence sensitivity to metal ions of C3N QDs
The chloride salt solution of different ions and concentrations (such as Al3+, Sc3+, Ga3+ and In3+ (20, 60, 120, 200, 600 and 1200 mM); Li+, Na+, K+, Mg2+, Ca2+, Sr2+, Cu2+, Ni2+, Co2+ (120, 200 and 1200 mM); Au3+, Fe3+ and Cr3+ (2, 6 and 12 mM)) were prepared in advance. Mixed 6 mL salt solution and 6 mL of a C3N QD solution (0.012 mg mL−1), and then obtained the spectra using a fluorescence spectrophotometer (the concentration of C3N QD in mixed solutions is 0.006 mg mL−1). The relative fluorescence ratio (F − F0/F0) was used to evaluate the fluorescence quenching efficiency as the previous works,41,42 where F and F0 represent the PL intensity of the C3N QDs solution with or without (w/o) metal ions added, respectively. Each PL intensity value used here is the average of the area integrals from 394 to 750 nm of three independent experiments, and the error bar is equal to the statistical deviation. The raw data and calculating values in Fig. 3 and 4 can be found in Fig. S6 and Table S2, and Fig. S7 and Table S4,† respectively.3. Results and discussion
3.1 Characterization of C3N QDs
The surface morphology and lateral size distribution of the C3N QDs were characterized by TEM and AFM. The C3N QDs have an average lattice constant of 0.26 ± 0.01 nm (Fig. 1b and S1†), and a thickness of approximately 0.6 nm or 1.2 nm (Fig. 1c), consistent with the structure sizes of C3N reported before.27–30 The histograms of the lateral size for C3N QDs were calculated by TEM (more than 250 points) and AFM (more than 750 points) images, with an average value of 20 ± 10 nm. The size distribution was further confirmed by nanoparticle size analyzer (see Fig. S2†), with sizes ranging from 13 nm to 33 nm and an average size of approximately 21 nm. | ||
| Fig. 1 Synthesis of C3N QDs with high purity and homogeneity through optimized solvothermal treatment of 2,3-diaminophenazine (DAP). (a) Synthetic routes and purification methods. (b) TEM images of C3N QDs and the insets correspond to the HRTEM patterns of C3N QDs. (c) AFM image of C3N QDs. (d) XPS survey spectra of DAP (black) and C3N QDs (orange). (e) N 1s spectra of DAP and C3N QDs. | ||
XPS survey spectra show that the C3N QDs mainly composed of C (284.80 eV),43,44 N (399.10 eV),45,46 and O (532.30 eV)47 elements. The ratio of C to N were ∼3.1 and ∼3.6 for C3N QDs and DAP, respectively (Fig. 1d). Although the content of N (20.2%) in C3N was close to that of DAP (21.1%) (see Table S1†), the nitrogenous compositions present significant differences, as shown in N 1s spectra of Fig. 1e. N 1s spectrum of C3N was only composed of graphitic-N (401.80 eV) and –NH2 (399.80 eV),48–50 whereas DAP was primarily composed of –NH2 and pyridinic-N (398.7 eV).48,49,51,52 Such different compositions of nitrogenous groups were also observed in Fourier transform infrared spectra (FTIR) (see Fig. S4†). It suggests an efficient synthesis of high purity C3N from DAP based on the almost full reaction from pyridinic-N to graphitic-N.
We systematically investigated the optical properties of the high purity C3N QDs. As shown in the inset of Fig. 2a, the aqueous solution of C3N QDs is yellowish in natural light and bright blue upon 365 nm UV lights. The UV-visible absorption spectrum (Abs. in Fig. 2a) exhibits four pronounced absorption peaks at about 206, 255, 365, and 418 nm with an optical absorption edge at ∼450 nm, where, two peaks at 255 and 365 nm (black dotted lines in Fig. 2a) are particularly pronounced. The corresponding adsorption peaks are assigned to the n–σ* transition of C–NH, the π–π* transition associated with C![[double bond, length as m-dash]](https://www.rsc.org/images/entities/char_e001.gif) C and CN, the n–π* transition of the CO and CN,50,53,54 and the electron transition of the conjugated structure between the phenazine ring structure and –NH2.55 The excitation peak of PLE at 355 nm (in Fig. 2a, purple line) almost agrees with the corresponding absorption peaks at 365 nm, suggesting that the emission can be characterized by the decay of band-edge exciton-state rather than defect-state. We further tested the fluorescence spectra (PL) of C3N QDs in same concentration under excitation wavelength from 320 nm to 400 nm (Fig. 2b). The emission peaks gradually red shift from 443 nm to 461 nm with the increasing excitation wavelength, and such excitation-dependent behavior can be explained by a wide distribution of particle size of C3N QDs. When the excitation wavelength is 380 nm, the emission peak has the highest intensity at 460 nm (light blue line in Fig. 2a and b). Besides, C3N QDs have a relatively long lifetime of 5.47 ns (see Fig. S5†), compared to GQDs with a typical value of 0.1–1 ns.27,56,57
C and CN, the n–π* transition of the CO and CN,50,53,54 and the electron transition of the conjugated structure between the phenazine ring structure and –NH2.55 The excitation peak of PLE at 355 nm (in Fig. 2a, purple line) almost agrees with the corresponding absorption peaks at 365 nm, suggesting that the emission can be characterized by the decay of band-edge exciton-state rather than defect-state. We further tested the fluorescence spectra (PL) of C3N QDs in same concentration under excitation wavelength from 320 nm to 400 nm (Fig. 2b). The emission peaks gradually red shift from 443 nm to 461 nm with the increasing excitation wavelength, and such excitation-dependent behavior can be explained by a wide distribution of particle size of C3N QDs. When the excitation wavelength is 380 nm, the emission peak has the highest intensity at 460 nm (light blue line in Fig. 2a and b). Besides, C3N QDs have a relatively long lifetime of 5.47 ns (see Fig. S5†), compared to GQDs with a typical value of 0.1–1 ns.27,56,57
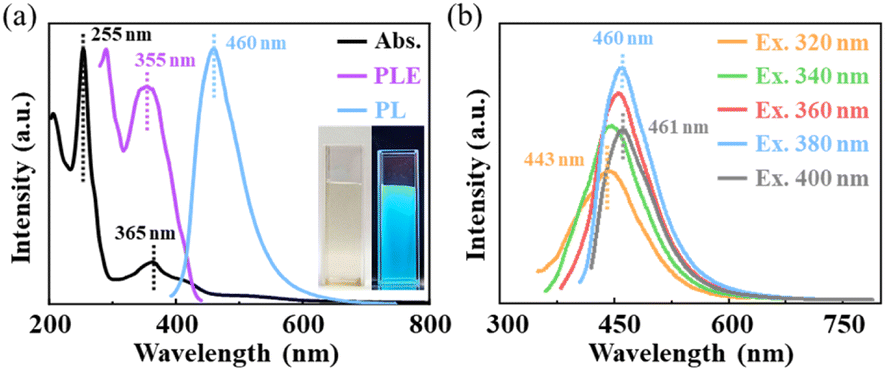 | ||
| Fig. 2 Optical spectra of C3N QDs. (a) UV-visible absorption (Abs.), excitation (PLE, detected at 460 nm) and PL spectra (excites at 380 nm). (b) PL spectra excited from 320 to 400 nm. The dotted lines and colourful labels indicate the peak positions of each spectrum. | ||
3.2 Fluorescence quenching
We note that the traditional GQDs exhibit no fluorescence quenching response to group IIIA ions and rare-earth ions, such as Al3+, Ga3+, In3+, and Sc3+, but instead show fluorescence recovery or enhancement upon these ions58–61 due to their adsorption on oxygen-containing groups rather than π-conjugated regions.62 In a sense, there are certain limitations to detect the ions mentioned above using traditional fluorescent GQDs. Accordingly, the C3N QDs reported in this work have unique performance for metal ions detection as a promising fluorescent probe. In experiments, 6 mL salt solution containing a variety of single component metal ions with concentrations from 20 to 1200 mM was added to 6 mL of a C3N QD solution (0.012 mg mL−1), and the PL spectra were measured using a fluorescence spectrophotometer excited at 380 nm. The fluorescence quenching efficiency was evaluated as the relative fluorescence ratio ((F − F0)/F0), where F0 and F represent the PL intensity of the C3N QDs before and after incubation with different metal ions, respectively. As shown in Fig. 3a, the relative fluorescence ratios of mixed solutions (0.006 mg mL−1 C3N QDs upon different metal ions) exhibited a linear correlation with the logarithm of the concentrations of Al3+, Ga3+, In3+, and Sc3+ ions in the range of 10–100 mM (the inset in Fig. 3a). In Fig. 3a, the fluorescence quenching efficiency is at least 43% upon 600 mM metal ions. These results demonstrated a high sensitivity of C3N QDs to Al3+, Ga3+, In3+, and Sc3+ ions over a wide concentration range. The excellent performance may be attributed to the high electronegativity of the C3N surface, originating from numerous N sites,38–40 which significantly enhances metal ion adsorption on N sites rather than oxygen groups, leading to charge transfer between the metal ions and C3N surface.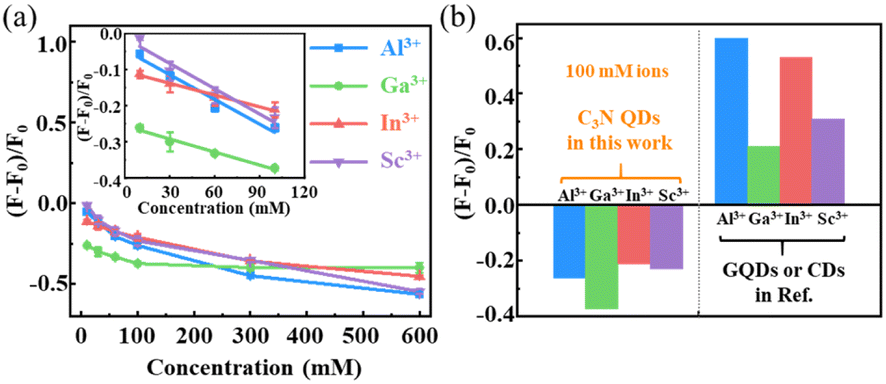 | ||
| Fig. 3 Relative fluorescence ratios of C3N QDs. (a) Dependence of PL intensity of C3N QDs on gradient concentrations of Al3+, Ga3+, In3+, and Sc3+ ions. (b) Comparison of the relative fluorescence ratios of C3N QDs and GQDs/CDs upon Al3+, Ga3+, In3+, and Sc3+ ions (in ref. 58–61, see Table S3†). The concentration of C3N QDs used here was 0.006 mg mL−1. The blank samples contained deionized water and corresponding concentrations of metal ions in each of the experimental groups. The error bars are the statistical standard deviations, seeing ESI Table S2† for exact values. | ||
 | ||
| Fig. 4 Relative fluorescence ratios of C3N QDs with various metal ions. (a) Relative fluorescence ratios after adding Li+, Na+, and K+ ions at different concentrations. (b) Relative fluorescence ratios after adding Mg2+, Ca2+, and Sr2+ ions at different concentrations. (c) Relative fluorescence ratios after adding Cu2+, Co2+, and Ni2+ at different concentrations. (d) Relative fluorescence ratios after adding Au3+, Fe3+, and Cr3+ at different concentrations. F0 and F represent the PL intensity before and after adding metal ions. The concentration of C3N QDs used here was 0.006 mg mL−1. The blank samples contained deionized water and corresponding concentrations of metal ions in each of the experimental groups. The error bars are the statistical standard deviation, seeing ESI Table S4† for exact values. | ||
The C3N QDs also own a sensitive fluorescent response to other various metal ions, including monovalent alkaline metals (Li+, Na+, and K+), divalent alkaline-earth metals (Mg2+, Ca2+, and Sr2+), and multivalent transition metals (Cu2+, Co2+, Ni2+, and Au3+, Fe3+, Cr3+). Using the same fluorescence detection method described above, the C3N QDs can also be quenched by alkaline metals (Li+, Na+, and K+), divalent alkaline-earth metals (Mg2+, Ca2+, and Sr2+), and divalent transition metals (Cu2+, Co2+, Ni2+) with a concentration range of 60–600 mM (Fig. 4a–c). Notably, for the trivalent transition metals (Au3+, Fe3+, Cr3+), even extremely low ion concentrations of 1–6 mM still caused significant fluorescence quenching. The fluorescent C3N QDs have been quenched to 98.5%, 81.2%, and 28.7% by Au3+, Fe3+, and Cr3+ ions at 6 mM concentration, respectively. The raw data and calculating values used in Fig. 3 and 4 have been presented in the ESI (see Table S2 and Fig. S6, and Table S4 and Fig. S7†) as support.
Considering the magnitudes of the fluorescence response to metal ions, the interaction strengths between C3N QDs and metal ions can be arranged as follows: trivalent heavy metal ions (Au3+, Fe3+, and Cr3+) > divalent heavy metal ions (Cu2+, Co2+, and Ni2+) > high-valence metal ions (Al3+, Ga3+, In3+, and Sc3+) > alkaline earth metal ions (Mg2+, Ca2+, and Sr2+) > alkaline metal ions (Li+, Na+, and K+). Based on these evidences, C3N QDs reported here should be proposed as a promising fluorescent probe to monitor various metal ions due to their excellent performance in fluorescent responding properties.
4. Conclusions
In summary, an efficient synthesis of C3N QDs with high purity and homogeneity from DAP molecules was realized by an optimized solvothermal method. Also benefiting from the optimizing purification methods in both pre-treatment of raw materials and further combined centrifugation and filtration of reaction products, the synthesis rate of C3N QDs can reach up to 33.1 ± 3.1%, and the obtained C3N QDs have a high purity. The TEM and AFM results combining with nanoparticle size analyzer revealed that an average lateral size of purified C3N QDs is 20 ± 10 nm. The C3N QDs have an average lattice constant of 0.26 ± 0.01 nm, and a thickness of single- or two-atomic layers. XPS results further demonstrated the efficient synthesis of C3N from DAP based on the full reaction from pyridinic-N to graphitic-N.Remarkably, the high-purity C3N QDs exhibit a sensitive fluorescent response to various metal ions, especially quenched obviously by Al3+, Ga3+, In3+, and Sc3+ ions, which cannot be achieved by traditional GQDs. We speculate that the unconventional fluorescence quenching process of C3N QDs arises from the cation–π interactions between the metallic ions and the π-conjugated system which promotes the ion-surface adsorption due to C3N QDs with relatively high nitrogen content and orderly distribution of nitrogen. Moreover, the C3N QDs also own a sensitive fluorescent response to other various metal ions. The interaction strengths between C3N QDs and metal ions can be arranged as follows: trivalent heavy metal ions (Au3+, Fe3+, and Cr3+) > divalent heavy metal ions (Cu2+, Co2+, and Ni2+) > high-valence metal ions (Al3+, Ga3+, In3+, and Sc3+) > alkaline earth metal ions (Mg2+, Ca2+, and Sr2+) > alkaline metal ions (Li+, Na+, and K+).
In summary, our findings represent a significant step towards the high-efficiency synthesis of high-purity C3N QDs, showing great potential in fluorescence detection for various metal ions. Actually, ion detections are the important applications of quantum dots, particularly, carbon-based quantum dots (CDs). Benefitting from the tunable bandgap for fluorescence property, excellent photostability, good biocompatibility and low toxicity of CDs. Whereas, C3N QDs are considered to be one of the most potential materials because of their unique optical performances and interactions with ions coming from the relatively high nitrogen content and orderly distribution of nitrogen. Subject to the difficulty of synthesis and purification, no experimental work on ion detection of C3N QDs has been reported before. Therefore, our work reported here can be considered as the first experimental verification on the application feasibility of C3N QDs in ion detection. Additionally, the fact that the fluorescence responses of C3N QDs to Al3+, Ga3+, In3+, and Sc3+ ions are in the opposite performance compared with other CDs, provides a hopeful ion detection method with improved accuracy of ion recognition combined with other CDs.
Author contributions
P. L. and C. L. conceived the ideas. C. L., P. L., J. J. and H. Y. designed the experiments and co-wrote the manuscript. H. Y., C. H., P. L., C. L., and J. J. performed the experiments and prepared the data graphs. All authors discussed the results and commented on the manuscript.Conflicts of interest
The authors declare no competing financial interests.Acknowledgements
This work was financially supported by National Natural Science Foundation of China (No. 12074341) and State Key Laboratory of Surface Physics and Department of Physics, Fudan University, Shanghai 200433, P. R. China (No. KF2023_07).References
- Y. Song, Y. N. Luo, C. Z. Zhu, H. Li, D. Du and Y. H. Lin, Biosens. Bioelectron., 2016, 76, 195–212 CrossRef CAS PubMed
.
- Q. B. Zheng, J. H. Lee, X. Shen, X. D. Chen and J. K. Kim, Mater. Today, 2020, 36, 158–179 CrossRef CAS
- R. K. Joshi, P. Carbone, F. C. Wang, V. G. Kravets, Y. Su, I. V. Grigorieva, H. A. Wu, A. K. Geim and R. R. Nair, Science, 2014, 343, 752–754 CrossRef CAS PubMed
- L. Chen, G. S. Shi, J. Shen, B. Q. Peng, B. W. Zhang, Y. Z. Wang, F. G. Bian, J. J. Wang, D. Y. Li, Z. Qian, G. Xu, G. P. Liu, J. R. Zeng, L. J. Zhang, Y. Z. Yang, G. Q. Zhou, M. H. Wu, W. Q. Jin, J. Y. Li and H. P. Fang, Nature, 2017, 550, 380–383 CrossRef CAS PubMed
- B. C. Qiu, M. Y. Xing and J. L. Zhang, Chem. Soc. Rev., 2018, 47, 2165–2216 RSC
- V. Chabot, D. Higgins, A. P. Yu, X. C. Xiao, Z. W. Chen and J. J. Zhang, Energy Environ. Sci., 2014, 7, 1564–1596 RSC
- C. N. R. Rao, K. Gopalakrishnan and A. Govindaraj, Nano today, 2014, 9, 324–343 CrossRef CAS
- Z. k. Liu, S. P. Lau and F. Yan, Chem. Soc. Rev., 2015, 44, 5638–5679 RSC
- A. Ambrosi, C. K. Chua, N. M. Latiff, A. H. Loo, C. H. A. Wong, A. Y. Sheng Eng, A. Bonannia and M. Pumera, Chem. Soc. Rev., 2016, 45, 2458–2493 RSC
- W. J. Yu, L. Liao, S. H. Chae, Y. H. Lee and X. F. Duan, Nano Lett., 2011, 11, 4759–4763 CrossRef CAS PubMed
- Z. Y. Guo, J. Wang, F. Wang, D. D. Zhou, Y. Y. Xia and Y. G. Wang, Adv. Funct. Mater., 2013, 23, 4840–4846 CrossRef CAS
- X. Y. Li, T. Tang, M. Li and X. C. He, Carbon, 2015, 94, 1037–1043 CrossRef
- S. Y. Huang, B. Zhao, K. Zhang, M. M. F. Yuen, J. B. Xu, X. Z. Fu, R. Sun and C. P. Wong, Sci. Rep., 2015, 5, 14260 CrossRef CAS PubMed
- X. X. Yao, X. X. Niu, K. X. Ma, P. Huang, J. L. Grothe, S. Kaskel and Y. F. Zhu, Small, 2017, 13, 1602225 CrossRef PubMed
- K. Li, W. Liu, Y. Ni, D. P. Li, D. M. Lin, Z. Q. Su and G. Wei, J. Phys. Chem. B, 2017, 5, 4811–4826 CAS
- S. K. Das, C. M. Luk, W. E. Martin, L. B. Tang, D. Y. Kim, S. P. Lau and C. I. Richards, J. Phys. Chem. C, 2015, 119, 17988–17994 CrossRef CAS
- K. Q. Wang, J. Dong, L. P. Sun, H. Y. Chen, Y. Wang, C. X. Wang and L. F. Dong, RSC Adv., 2016, 6, 91225–91232 RSC
- Z. Wu, L. Zhu, F. Yang, Z. Jiang and Z. X. Zhang, Int. J. Hydrogen Energy, 2016, 41, 18550–18561 CrossRef CAS
- X. Liu, X. Fan, L. Wang, J. X. Sun, Q. Wei, Y. S. Zhou and W. B. Huang, Chem. Eng. Sci., 2021, 231, 116313 CrossRef CAS
- X. Wang, K. Maeda, A. Thomas and K. Takanabe, Nat. Mater., 2009, 8, 76–80 CrossRef CAS PubMed
- G. P. Mane, S. N. Talapaneni, K. S. Lakhi, H. Ilbeygi, U. Ravon, K. Al-Bahily, P. T. Mori, D. Park and P. A. Vinu, Angew. Chem., Int. Ed., 2017, 56, 8481–8485 CrossRef CAS PubMed
- Q. X. Guo, Q. Yang, L. Zhu, C. Q. Yi, S. Y. Zhang and Y. Xie, Solid State Commun., 2004, 132, 369–374 CrossRef CAS
- J. Feng and M. Li, Adv. Funct. Mater., 2020, 30, 2001502 CrossRef CAS
- Q. X. Guo, Q. Yang, C. Q. Yi, L. Zhu and Y. Xie, Carbon, 2005, 43, 1386–1391 CrossRef CAS
- J. Mahmood, E. K. Lee1, M. Jung, D. B. Shin, I. Y. Jeon, S. M. Jung, H. J. Choi, J. M. Seo, S. Y. Bae, S. D. Sohn, N. J. Park, J. H. Oh, H. J. Shin and J. B. Baek, Nat. Commun., 2015, 6, 6486 CrossRef CAS PubMed
- J. Mahmood, E. K. Lee, M. Jung, D. Shin, H. Choi, J. Seo, S. M. Jung, D. Kim, F. Li and M. S. Lah, Proc. Natl. Acad. Sci. U. S. A., 2016, 113, 7414–7419 CrossRef CAS PubMed
- S. W. Yang, W. Li, C. C. Ye, G. Wang, H. Tian, C. Zhu, P. He, G. Q. Ding, X. M. Xie and Y. Liu, Adv. Mater., 2017, 29, 1605625 CrossRef PubMed
- Y. Zhao, X. Q. Feng, M. H. Zhao, X. H. Zheng, Z. D. Liu, S. W. Yang, S. W. Tang, D. Chen, G. Wang and G. Q. Ding, J. Mater. Chem. C, 2021, 9, 1333–1338 RSC
- Z. Z. Li, S. W. Yang, C. C. Ye, G. Wang, B. Ma, H. H. Yao, Q. Wang, G. Q. Peng, Q. Wang, H. L. Zhang and Z. W. Jin, Small, 2022, 18, 2108090 CrossRef CAS PubMed
- X. H. Yin, H. Zhou, M. L. Zhang, J. Su, X. Wang, S. J. Li, Z. X. Yang, Z. H. Kang and R. H. Zhou, Nat. Commun., 2023, 14, 5718 CrossRef CAS PubMed
- B. H. Jing, J. H. Zhou, D. D. Li and Z. M. Ao, J. Hazard. Mater., 2023, 442, 130074 CrossRef CAS PubMed
- W. Pei, Z. Wang, W. Z. Xia, Z. J. Huang, P. J. Wang, Y. F. Liu, S. Zhou, Y. S. Tu and J. J. Zhao, J. Phys. Chem. Lett., 2024, 15, 1161–1171 CrossRef CAS PubMed
- X. Q. Feng, Z. Y. He, Z. D. Liu, W. Zhu, M. H. Zhao, S. W. Yang, Q. L. Guo, D. Chen, G. Q. Ding and G. Wang, Adv. Opt. Mater., 2021, 9, 2100387 CrossRef CAS
- Q. Q. Fu, Y. Y. Xie, L. Gao, W. X. Zhu, X. Z. Lang, R. Singh, B. Y. Zhang and S. Kumar, Signal-enhanced multi-core fiber-based WaveFlex biosensor for ultra-sensitive xanthine detection, Opt. Express, 2023, 31, 43178–43197 CrossRef CAS PubMed
- G. R. Li, X. S. Li, R. Singh, G. W. Zhang, B. Y. Zhang and S. Kumar, Opt. Lett., 2023, 48, 4745–4748 CrossRef CAS PubMed
- Z. L. Gu, G. J. Lin and G. H. Xie, Appl. Surf. Sci., 2022, 582, 152460 CrossRef CAS
- M. Roshan, A. R. Akbarzadeh, S. Sadeghzadeh and A. Maleki, Diamond Relat. Mater., 2022, 127, 109139 CrossRef CAS
- B. L. He, J. S. Shen, D. W. Ma, Z. S. Lu and Z. X. Yang, J. Phys. Chem. C, 2018, 122, 20312–20322 CrossRef CAS
- D. W. Ma, J. Zhang, X. X. Li, C. Z. He, Z. W. Lu, Z. S. Lu, Z. X. Yang and Y. X. Wang, Sens. Actuators, B, 2018, 266, 664–673 CrossRef CAS
- B. Yang and Z. Fu, J. Phys. Chem. C, 2019, 123, 5731–5735 CrossRef CAS
- L. Pan, S. Sun, A. Zhang, K. Jiang, L. Zhang, C. Q. Dong, Q. Huang, A. G. Wu and H. W. Lin, Adv. Mater., 2015, 27, 7782–7787 CrossRef CAS PubMed
- G. Gao, Y. W. Jiang, H. R. Jia, J. J. Yang and F. G. Wu, Carbon, 2018, 134, 232–243 CrossRef CAS
- E. Desimoni, G. I. Casella, A. Morone and A. M. Salvi, Surf. Interface Anal., 1990, 15, 627–634 CrossRef CAS
- S. Maldonado, S. Morin and K. J. Stevenson, Carbon, 2006, 44, 1429–1437 CrossRef CAS
- R. J. J. Jansen and H. van Bekkum, Carbon, 1995, 33, 1021–1027 CrossRef CAS
- W. J. Gammon, O. Kraft, A. C. Reilly and B. C. Holloway, Carbon, 2003, 41, 1917–1923 CrossRef CAS
- S. Biniak, G. Szymański, J. Siedlewski and A. Świątkowski, Carbon, 1997, 35, 1799–1810 CrossRef CAS
- R. Arrigo, M. Hävecker, S. Wrabetz, R. Blume, M. Lerch, J. McGregor, E. P. J. Parrott, J. A. Zeitler, L. F. Gladden, A. Knop-Gericke, R. Schlögl and D. S. Su, J. Am. Chem. Soc., 2010, 132, 9616–9630 CrossRef CAS PubMed
- X. M. Ning, H. Yu, F. Peng and H. J. Wang, J. Catal., 2015, 325, 136–144 CrossRef CAS
- K. Holá, M. Sudolská, S. Kalytchuk, D. Nachtigallová, A. L. Rogach, M. Otyepka and R. Zbořil, ACS Nano, 2017, 11, 12402–12410 CrossRef PubMed
- S. Y. Lu, L. Z. Sui, J. J. Liu, S. J. Zhu, A. M. Chen, M. X. Jin and B. Yang, Adv. Mater., 2017, 29, 1603443 CrossRef PubMed
- Q. Zhang, R. Y. Wang, B. W. Feng, X. X. Zhong and K. Ostrikov, Nat. Commun., 2021, 12, 6856 CrossRef CAS PubMed
- X. Miao, D. Qu, D. X. Yang, B. Nie, Y. K. Zhao, H. Y. Fan and Z. C. Sun, Adv. Mater., 2018, 30, 1704740 CrossRef PubMed
- S. M. S. do Nascimento, A. F. Sonsin, C. D. do E S Barbosa and E. J. S. Fonseca, Nanotechnology, 2023, 34, 365708 CrossRef PubMed
- L. Cao, M. H. Zan, F. M. Chen, X. Y. Kou, Y. L. Liu, P. Y. Wang, Q. Mei, Z. Hou, W. F. Dong and L. Li, Carbon, 2022, 194, 42–51 CrossRef CAS
- Q. F. Xu, Q. Zhou, Z. Hua, Q. Xue, C. F. Zhang, X. Y. Wang, D. Y. Pan and M. Xiao, ACS Nano, 2013, 7, 10654–10661 CrossRef CAS PubMed
- S. P. Jovanović, Z. M. Marković, Z. Syrgiannis, M. D. Dramićanin, F. Arcudi, V. La Parola, M. D. Budimir and B. M. T. Marković, Mater. Res. Bull., 2017, 93, 183–193 CrossRef
- J. Li, Z. T. Wang, J. Yang, X. M. Xia, R. B. Yi, J. Jiang, W. Liu, J. L. Chen, L. Chen and J. Xu, Appl. Surf. Sci., 2021, 546, 149110 CrossRef CAS
- J. Yang, P. Li, Z. L. Song, J. Li, H. Yang, Y. Fan, L. Li, C. Xu, J. L. Chen and L. Chen, Appl. Surf. Sci., 2022, 593, 153367 CrossRef CAS
- B. B. Chen, R. S. Li, M. L. Liu, H. Y. Zou, H. Liu and C. Z. Huang, Talanta, 2018, 178, 172–177 CrossRef CAS PubMed
- S. Pawar, S. Kaja and A. Nag, ACS Omega, 2020, 5, 8362–8372 CrossRef CAS PubMed
- Q. M. Bing and J. Y. Liu, Appl. Surf. Sci., 2021, 562, 150186 CrossRef CAS
Footnotes |
| † Electronic supplementary information (ESI) available. See DOI: https://doi.org/10.1039/d4ra00887a |
| ‡ These authors contributed equally: Huan Yang, and Changdao Han. |
| This journal is © The Royal Society of Chemistry 2024 |