 Open Access Article
Crystal structure, Hirshfeld surface analysis, conduction mechanism and electrical modulus study of the new organic–inorganic compound [C8H10NO]2HgBr4†
Souad Chkoundali *a,
Iheb Garouib,
Wala Trigui
 b and
Abderrazek Oueslati
 b
b
aLaboratory of Multifunctional Materials and Applications (LaMMA), LR16ES18, Faculty of Sciences, University of Sfax, B. P. 1171, 3000 Sfax, Tunisia. E-mail: schkoundali@yahoo.fr
bLaboratory of Spectroscopic Characterizations and Optics Materials, University of Sfax, Faculty of Sciences of Sfax, B. P. 1171, 3000 Sfax, Tunisia
First published on 15th March 2024
Abstract
There has been a lot of interest in the development of a novel hybrid material based on mercury that has fascinating structural properties. In this paper, single crystals of [C8H10NO]2HgBr4 was successfully synthesized by the slow evaporation method at room temperature. In fact, the latter crystallizes in the orthorhombic system (Cmca space group) with cell parameters a = 20.824(2) Å, b = 15.352(1) Å and c = 13.700(1) Å and Z = 8. Its structure is constituted by one [C8H10NO]+ cation and one type of isolated anion [HgBr4]2− tetrabromomercurate(II). The atomic arrangement presents an alternation of organic and inorganic layers along the a-axis. To maintain the cohesiveness of the structure, these components are joined via π⋯π interactions and hydrogen bonds (N–H⋯Br and N–H⋯O). A general network of hydrogen bonds ensures the interconnection of several entities. Greater knowledge of these interactions has been obtained based on the Hirshfeld surface analysis and 2D fingerprint plots. The analysis of complex impedance spectra shows that the electrical properties of the material are heavily dependent on frequency and temperature. The obtained results were analyzed by fitting the experimental data to an equivalent circuit model. The temperature dependence of conductivity and the relaxation frequency ωmax fulfill the Arrhenius relation and activation energies are estimated. The material follows Jonscher's universal dynamic law or here there is a decrease in the exponent ‘s’ as the temperature increases. This result indicates that the Correlated Barrier Hopping (CBH) model represents the conduction mechanism. Besides, the non-Debye type conductivity relaxation is revealed by the electrical modulus analysis.
1. Introduction
In recent years, organic–inorganic hybrid materials have garnered significant attention from researchers due to the intriguing opportunities they offer for the preparation of a wide variety of materials. These hybrids hold potential applications in diverse fields such as medicine, biology, catalysis, magnetism, photochemistry, and electrochemistry.1–3 Furthermore, these compounds have the potential to integrate advantageous characteristics from both organic and inorganic moieties in crystalline molecular-scale composites.4–7 On the one hand, inorganic materials can have a wide range of electrical properties, mechanical hardness, thermal stability and dielectric and magnetic transitions.8,9 On the other hand, organic molecules can provide significant polarizability, structural diversity, plastic mechanical characteristics, processing simplicity, and great fluorescence efficiency.10,11Among these compounds, complexes with the chemical formula A2MX4 (A = organic cation, M = transition divalent metal ion, X = halide ion) have attracted considerable interest among hybrid materials.12,13 Particularly, hybrid compounds based on mercury halide have drawn interest due to the many coordination topologies and structural flexibility of the Hg2+ ion.14
This study was carried out using a novel organic–inorganic hybrid chemical substance [C8H10NO]2HgBr4, which combines the organic cation 4-acetylanilinium [C8H10NO]+ and the tetrabromomercurate(II) anion [HgBr4]2−. The structural characteristics and properties of the studied compound were ascertained by conducting a range of physicochemical characterization studies on crystals that were formed. Several methods, including scanning electronic microscopy (SEM), X-ray diffraction (XRD), infrared spectroscopy (IR), Hirshfeld surface analysis (HS), and dielectric analysis were used.
2. Experimental
2.1. Synthesis
The crystals of the [C8H9NO]2HgBr4 compound were synthesized by dissolving (0.075 g) of 4′-aminoacetophenone [C8H9NO] and (0.1 g) of mercuric bromide [HgBr2] in an aqueous solution of HBr (37%). The mixture was allowed to slowly evaporate at room temperature. After a few days, rust-colored crystals of [C8H10NO]2HgBr4 precipitated at the bottom of the Petri dish.The reaction proceeds as follows:
| 2[C8H9NO] + HgBr2 + 2HBr[C8H10NO]2HgBr4 |
2.2. Scanning electronic microscopy (SEM)
Scanning electron microscopy (SEM) and energy dispersive spectroscopy (EDS) (MIRA3 FEG microscope) connected to an Oxford Instrument analyzer with several acceleration voltages were used to investigate of the microstructure and chemical composition of the title compound.2.3. X-ray data collection
A prismatic single crystal was selected under a polarizing optical microscope and mounted on micro-mount needles for X-ray diffraction experiments. X-ray intensity data were collected on a D8 VENTURE Bruker AXS diffractometer using MoKα radiation (λ = 0.71073 Å) at 150(2) K. The SADABS software was used to perform absorption corrections using the multi-scan method.15 The crystal structure was refined in the orthorhombic system with the Cmca space group (Z = 8) with the aid of the WINGX package.16 Moreover, the positional parameters for the heavy atoms mercury and bromide were fixed with the Paterson method through the SHELX-S 86 programs.17 While the remaining non-hydrogen atoms were found from the successive difference Fourier maps by means of SHLXL-97 programs.18 The hydrogen atoms were located geometrically via the HFIX instruction (SHLXL-97 (ref. 18)) and refined with soft restraints on the bond lengths and angles to regularize their geometry. A final refinement with 2584 unique intensities and 128 parameters converged to very good reliability factors R = 0.0150 and wR = 0.0344 for 2403 observed reflections with I > 2σ. The structural graphics were performed based on the DIAMOND 2.1 program.19 The details of the data collection and processing are listed in Table 1. The fractional atomic coordinates and the equivalent isotropic temperature factors are illustrated in Table S.1.† Selected hydrogen bonds as well as bond distances and angles are depicted in Tables 2 and S.2† respectively.| Formula | [C8H10NO]2HgBr4 |
| Molecular weight (g mol−1) | 792.57 |
| Color/shape | Rust/prismatic |
| Crystal size (mm3) | 0.21 × 0.19 × 0.15 |
| Crystal system | Orthorhombic |
| Space group | Cmca |
| Density (g cm−3) | 2.404 |
| Temperature (K) | 150(2) |
| Diffractometer | D8 VENTURE Bruker AXS |
![[thin space (1/6-em)]](https://www.rsc.org/images/entities/char_2009.gif) |
|
| Unit cell dimensions | |
| a (Å) | 20.824(2) |
| b (Å) | 15.352(1) |
| c (Å) | 13.700(1) |
| Volume (Å3) | 4379.63(7) |
| Z | 8 |
| Radiation type, λ (Å) | MoKα, 0.71073 |
| Absorption correction | Multi-scan |
| θ range (°) | 2.65 £ θ £ 27.49 |
| Range of hkl | −27 → 26, −19 → 17, −17 → 17 |
| Independent reflections | 2584 |
| Observed reflections (I > 2σ(I)) | 2403 |
| Refinement on | F2 |
| Refined parameters | 128 |
| Goodness of fit | 1.112 |
| R/wR | 0.0150/0.0344 |
| Δρ (max)/Δρ (min) (e Å−3) | 0.555/−0.988 |
Crystallographic data for the structure reported in the paper (excluding structure factors) have been deposited at the Cambridge Crystallographic Data Centre (deposition number: CCDC 2338144).
2.4. Hirshfeld surface
To compute the Hirshfeld surfaces and related 2D fingerprint plots, we use the Crystal Explorer20 program with a structural input file in the CIF format. The outer boundary of the area that a molecule or an atom takes up in a crystalline environment is known as the Hirshfeld surface. Two different distances are specified for each place on the iso-surface: di: the distance to the nearest nucleus inside the surface, and de: the distance to the nearest atoms outside the surface. Both distances are readily defined. The normalized contact distance (dnorm), which depends on the atom's de and di as well as its van der Waals (vdW) radii, is given by eqn (1). This makes it possible to pinpoint the areas that are crucial for interactions.21
 | (1) |
2.5. Infrared spectroscopy
The infrared spectrum was acquired utilizing a PerkinElmer FT-IR 1000 spectrometer with the sample compressed into a KBr pellet within the 400–3500 cm−1 range.2.6. Impedance spectroscopy
A small quantity of [C8H9NO]2HgBr4 crystals was ground in an agate mortar to obtain a fine powder, which was pressed into pellets (1.2 mm in thickness and 8 mm in diameter) under a 3t cm−2 press. Then, the two flat faces of the pellet were manually covered with thin gold coatings (with a thickness of a few nanometers). Using a 1260 Solartron Impedance Analyzer, the measurements were made as a function of frequency and temperature throughout a temperature range of 373–443 K.3. Results and discussion
3.1. Structure description
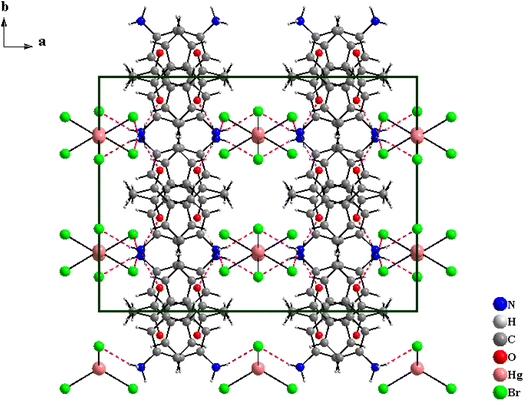
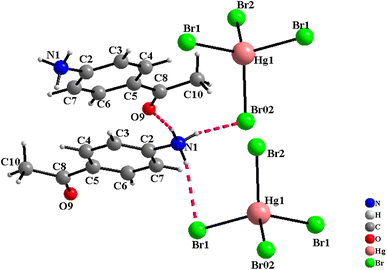
The [C8H10NO]2HgBr4 compound crystallizes in the orthorhombic system (Cmca space group) with the lattice parameters a = 20.824(2) Å, b = 15.352(1) Å and c = 13.700(1) Å. The asymmetric unit shown in Fig. S.1† consists of one 4-acetylanilinium [C8H10NO]+ and one type of isolated tetrabromomercurate(II) anion [HgBr4]2−. The structural arrangement of the title compound viewed along the [001] direction (Fig. 1) can be described by an alternation of two types of organic and inorganic layers stacked along the crystallographic a-axis. Indeed, the isolated anionic tetrahedron [HgBr4]2− is stacked in a manner to form anionic pseudo-layers parallel to the (b,c) plane at x = 0 and x = ½. The negative charges of [HgBr4]2− are compensated by the protonated amines [C8H10NO]+. Therefore, these organic cations are piled up one over the other to form an organic cationic pseudo-layer parallel to the (100) plane at x = ¼ and ¾ (Fig. 1 and S.2†). The crystal package between the organic and inorganic groups is provided by hydrogen bonds (N–H⋯Br and N–H⋯O) and π⋯π interactions. Furthermore, each amine establishes its hydrogen atoms bonded to nitrogen atoms in N–H⋯Br with two [HgBr4]2− tetrahedra and in N–H⋯O with one [C8H10NO]+ organic cation (Fig. 2). Within the intermolecular hydrogen bonds, the N⋯Br distances range from 3.379(2) to 3.426(2) Å and the N⋯O distance is equal to 2.809(2) Å while the N–H⋯Br angles vary from 157(2) to 163(2)° and the N–H⋯O angle is equal to 166(2)°, Table 2. These lengths fall within those reported in isotypic compounds.22
 | (2) |
 | (3) |
We found the values of the distortion indices ID(Hg–Br) = 0.0072 and ID(Br–Hg–Br) = 0.0373. The low values of the distortion indices indicate that the coordination geometry of the metal is slightly distorted; this can be explained by the weak hydrogen bonds between [HgBr4]2− anions and neighboring entities.27
3.2. SEM/EDS analysis
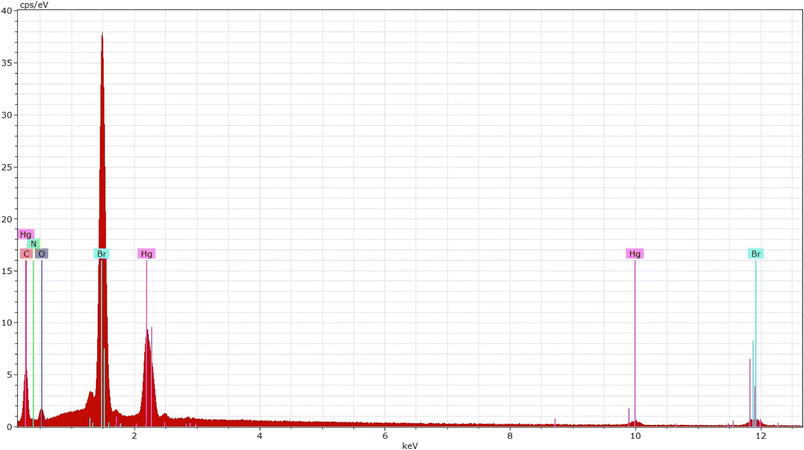
EDS proves to be an outstanding approach in terms of identifying elements with higher atomic numbers in developed crystals. The energy-dispersive X-ray spectroscopy spectrum of the synthesized compound is displayed in Fig. 3. The spectrum indicates the presence of Hg, Cl, C, O, and N elements as well as their spatial distributions within the crystal.3.3. Hirshfeld surface analysis
In the present paper, Hirshfeld surface analysis has been carried out in order to thoroughly examine the nature and function of hydrogen bonds and other intermolecular interactions as well as to estimate their significance for the stability of the crystal lattice. The Hirshfeld surfaces of the [C8H10NO]2HgBr4 are displayed in Fig. 4 represents the surfaces that have been mapped around the molecule by dnorm, curvedness, and the surfaces are rendered transparent to facilitate the visualization of the molecular moiety in a consistent orientation across all structures. In the dnorm surface, contacts with distances equivalent to the sum of van der Waals radii are highlighted in white. Conversely, shorter and longer distances are depicted in red and blue, respectively. Red spots indicate N–H⋯Br hydrogen bonds, representing the most significant intermolecular interactions in the compound. Fig. S.4† illustrates 2D fingerprint plots, portraying the percentage of area occupied by various types of intermolecular interactions. Those plots show the H⋯Br/Br⋯H and H⋯H interactions exhibit the most significant contributions (59.1%, 17.70% respectively) of the total Hirshfeld surfaces while the O⋯H/H⋯O, C⋯H/H⋯C, C⋯C/C⋯C, C⋯O/O⋯C, and H⋯Hg/Hg⋯H interactions present the least contribution with 7.9%, 7.4%, 3.3%, 1.7% and 1.5%, respectively. | ||
| Fig. 4 Hirshfeld surfaces of [C8H10NO]2HgBr4: (a) 3D dnorm surface and (b) curvedeness and (c) surface index. | ||
Additionally, the form index surface shows that the defined pattern of neighboring blue and red triangles on the form index surfaces around the [C8H10NO]2HgBr4 unit confirms the presence of π⋯π stacking interactions between aromatic cycles (Fig. 4). The percentages of interactions that contribute to the title compound are observed in Fig. S.5.† This quantitative finding indicates that the H⋯Br interactions have the most dominant in the crystal structure. The results of the Hirshfeld surface analysis confirm those noticed by the X-ray diffraction analysis.
3.4. Infrared spectra
Additional understanding of the crystal structure and purity of the studied compound could be obtained through vibrational spectroscopy. The infrared spectrum recorded at Moderate temperature, covering the spectral range of 4000 to 400 cm−1 is displays in Fig. S.6.† Detailed band assignments for different modes, through comparisons with similar compounds, are given in Table S.3.†31–35The bands observed at 2968 cm−1 in the IR spectra is associated with the asymmetric stretching vibration of CH3. However, the band located at 2867 cm−1 is assigned to the symmetric stretching vibrations of CH3. The position of the stretching vibration of C![[double bond, length as m-dash]](https://www.rsc.org/images/entities/char_e001.gif) O is very sensitive to a variety of different factors including hydrogen bonding, conjugation, electronic effects, etc. In this study, the C
O is very sensitive to a variety of different factors including hydrogen bonding, conjugation, electronic effects, etc. In this study, the C![[double bond, length as m-dash]](https://www.rsc.org/images/entities/char_e001.gif) O stretching mode appeared at 1661 in IR spectra. Concerning the C
O stretching mode appeared at 1661 in IR spectra. Concerning the C![[double bond, length as m-dash]](https://www.rsc.org/images/entities/char_e001.gif) C stretching vibrations, they are observed at 1618, 1600, 157, 1483, and 1414 cm−1. In plane bending mode, the bands at 634 and 573 cm−1 are designated as C–C–C. Nonetheless, the C–C–C out-of-plane bending mode can be linked to the band in the infrared spectrum that was detected at 463 cm−1. Moreover, the peak at 1314 cm−1 is related to the IR of C–H in-plan bending vibrations, while the C–H out-of-plane bending vibrations are observed at 964 and 830 cm−1 in IR spectra.
C stretching vibrations, they are observed at 1618, 1600, 157, 1483, and 1414 cm−1. In plane bending mode, the bands at 634 and 573 cm−1 are designated as C–C–C. Nonetheless, the C–C–C out-of-plane bending mode can be linked to the band in the infrared spectrum that was detected at 463 cm−1. Moreover, the peak at 1314 cm−1 is related to the IR of C–H in-plan bending vibrations, while the C–H out-of-plane bending vibrations are observed at 964 and 830 cm−1 in IR spectra.
In general, regions between 1625–1560 and 1550–1480 cm−1 are expected to demonstrate the NH3+ asymmetric and symmetric deformation modes.36 The asymmetric deformation mode of NH3+ is liable for the wavenumbers found at 1619, 1601, and 1570 cm−1 in the infrared spectra of our compound under investigation. On the other hand, the band at 1484 cm−1 in IR spectrum is associated to the symmetric bending mode δs(NH3+).
3.5. Impedance analysis
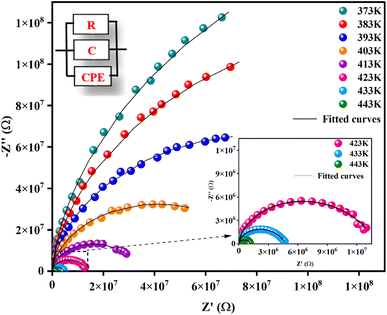
Fig. 5 illustrates the complex impedance spectra (−Z′′ vs. Z′) of the [C8H10NO]2HgBr4 compound recorded at various temperatures. These plots provide evidence of typical semicircles, whose centres fall at an angle of below the abscise axis (Z′) and get tediously smaller as the temperature rises. This undoubtedly validates the Cole–Cole style of relaxation.37 To investigate the electric properties of the substance, we proposed an equivalent electrical circuit adapted to the complex impedance spectrum. This circuit is seen in the inset of Fig. 5 and is made up of the following components combined in parallel: resistance (R), capacitance (C) and fractal capacitance (CPE) with impedance:
 | (4) |
The variation of real part of the impedance (Z′) with frequency at different temperature is shown in Fig. 6(a). At low frequencies, the amplitude of Z′ decreases with increasing temperature, this could be explained by a thermal activation of the mobility of the charge carriers and a decrease in the trapped charge density. Additionally, at higher frequencies (>104 Hz), the values of Z′ decrease until they cancel, demonstrate that charge carriers have acquired sufficient energy to overcome the potential barrier.39
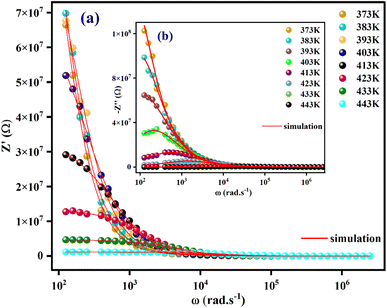 | ||
| Fig. 6 The frequency dependence of Z′ (a) and −Z′′ (b) at different temperatures for [C8H10NO]2HgBr4 crystal. | ||
The temperature-dependent variations in the imaginary element (−Z′′) as a function of frequency are shown in Fig. 6(b). A broadening of the peaks and a decrease in the  value with increasing temperature suggest that a relaxation process is occurring.40
The theoretical values of the real (Z′) and imaginary (−Z′′) parts of the complex impedance, derived from the equivalent circuit, were deduced using the following expressions:
 | (5) |
 | (6) |
The parameters R, C, α and Q obtained from the fitting results were evaluated and listed in Table S.4.† As an overview in this table, the bulk resistance R decreases with increasing temperature (Fig. S.6(a)†) and this behavior has a relationship to charge carriers being more mobile.41
Fig. S.6(b)† shows the variation of ln![[thin space (1/6-em)]](https://www.rsc.org/images/entities/char_2009.gif) σdc as a function of 1000/T. We see that when the temperature increases, the conductivity increases as well. The Arrhenius equation is used to fit the linear region:42
σdc as a function of 1000/T. We see that when the temperature increases, the conductivity increases as well. The Arrhenius equation is used to fit the linear region:42
 | (7) |
The value of activation energy Ea, which can be determined from the linear fit, is equal to: Ea = 1.25 eV. This activation energy, Ea, is similar to the values obtained previously.43,44
3.6. Conductivity analysis
Electrical conductivity serves as the predominant means of correlating macroscopic measurements with the microscopic motion of ions. Alternative conductivity σac(ω) primarily arises from the movement of ions by hopping between adjacent potential wells.Fig. 7(a) displays the frequency dependence of (σac(ω)) for at various temperatures. The conductivity increases with temperature, as these spectra show, and this may result to exhibit the semiconductor behaviour.45 Two regions are clearly distinguishable, at the lower frequencies (<104 Hz); the conductivity spectra display nearly constant values (σdc) as the random distribution of the charge carriers gives rise to frequency independent conductivity. It is clear that dc conductivity is thermally activated. This compound's semiconductor nature suggests that it may have potential in a variety of applications, including photovoltaics, optoelectronics, and photodetectors.46,47 When the temperature increases, the σac exhibits a dispersion that shifts towards higher frequencies at higher frequencies (>104 Hz). Jonsher's power law is utilized for analysing the conductivity dispersion.48
| σac(ω) = σdc + Aωs | (8) |
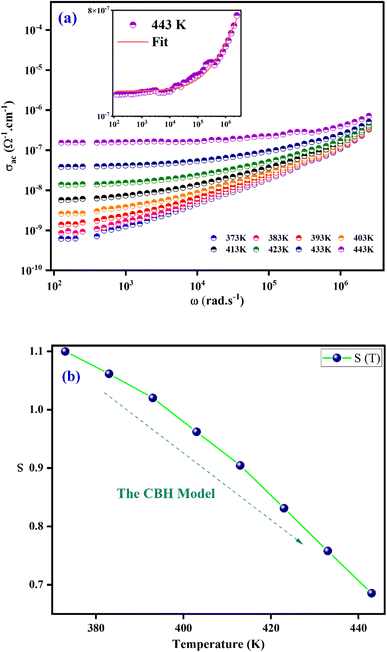 | ||
| Fig. 7 (a) Frequency dependence of ac conductivity at several temperatures. (b) Thermal variation of exponent “s” for [C8H10NO]2HgBr4. | ||
The fundamental conduction mechanism of the AC conductivity in the [C8H10NO]2HgBr4 compound was identified by utilizing several theoretical models that related the conduction mechanism with the behaviour of the exponent s(T). The variation of exponent s(T) which is resulting from the fitting of temperature shown in Fig. 7(b). From this figure, we see that the exponent “s” decreases as the temperature increases. This suggests that the Correlated Barrier Hopping (CBH) model may explain the conduction mechanism in our compound.49
The structural part confirms that the charge transport refers to the Correlated Barrier Hopping (CBH) model. Indeed, according to Fig. 3, the structural arrangement of the compound in the [001] direction was described by an alternation of two types of organic and inorganic layers stacked along the crystallographic axis a. Crystal assembly between organic and inorganic groups is ensured by hydrogen bonds (N–H⋯Br and N–H⋯O) and π⋯π interactions. At low frequencies, hydrogen bonds and π⋯π interactions decrease with increasing temperature. Therefore, the movement of the cationic and anionic parts increase resulting in significant charge carrier mobility. At higher frequencies (>104 Hz), the charge carriers acquire enough energy to overcome the potential barrier.50
If the cation were replaced by a different ammonium-based cation, the electronic properties of the compound could be significantly different. This is because the electronic properties of the cation can affect the bonding and reactivity of the MX4 (M = transition metal and X = halide) unit, as well as the overall stability and packing of the molecular crystal. Similarly, if the bromide anion were replaced by another halide anion, Cl−, I−, or F−, the electronic properties of the compound could be altered. The size, shape, and charge of the halide anion can affect the bonding and reactivity of the MX4 unit, as well as the crystal packing and intermolecular interactions. In general, replacing cation or anion in (amine)MX4 with others can lead to different electronic and physical properties. These properties would depend on the specific structure and composition of the resulting compounds.
3.7. Electrical modulus analysis
The electrical modulus formalism (M*) is a technique that is commonly used to study electrical relaxation phenomena.This technique aids in the understanding of the ion conduction mechanism and relaxation processes. It makes it possible to analysis the characteristics of the charge carrier and derive the conductivity relaxation frequency for the grain material. By using this method, the issues pertaining to the electrodes' polarization effect are resolved. The dielectric modulus (M*) is defined as.51
 | (9) |
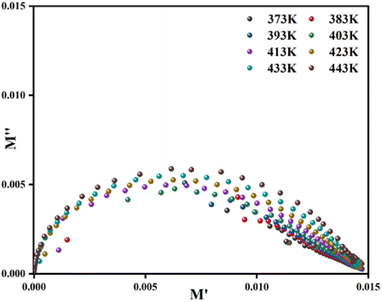
The complex modulus spectrum (M′′ vs. M′) of the [C8H10NO]2HgBr4 compound at various temperatures is shown in Fig. 8. The appearance of an arc in the spectrum confirms the single-phase character of the sample and may be attributed to the presence of electrical relaxation phenomena.
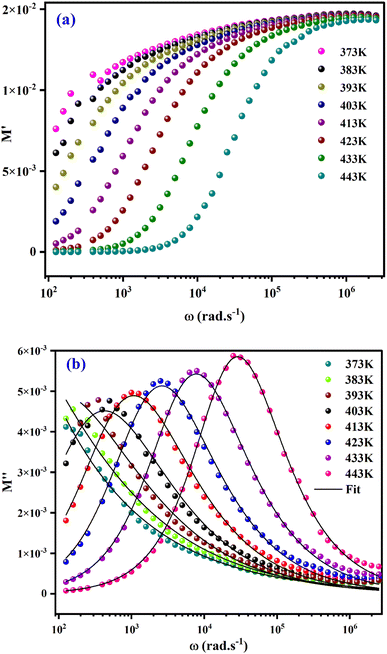
The real part of the electric module spectra as a function of frequency for different temperatures is shown in Fig. 9(a). At low frequencies, M′ approaches a value of zero. However, in the high frequency range, a slight shift in the M′ peak with increasing temperature is observed. This behaviour, as well as the sigmoid nature of M′, are due to the long-range mobility of the charge carriers in the conduction mechanism.
The variation of the imaginary part of modulus (M′′) as a function of frequency at various temperatures is plotted in in Fig. 9(b). It is evident that (M′′) exhibits asymmetric frequency dependence as well as a well-defined maximum that can be related to a particular relaxation rate. In fact, a maximum peak  is observed for each. The observed shift of this peak toward the higher frequency region as temperature increases suggests a hopping mechanism, as described in ref. 52. In the low-frequency range, charge carriers demonstrate mobility over considerable distances, indicating successful hopping from one site to another. However, in the high-frequency range, the carriers are constrained within potential wells, resulting in limited mobility over shorter distances. The asymmetrical form of the peaks in M′′ indicates that the sample has a non-Debye response. A KWW equation is used to analyse the peaks' asymmetric character for the imaginary part of the electric modulus:53–55
 | (10) |
 and ωmax are respectively the modulus and the maximum angular frequency. β is the exponential parameter positioned in the [0–1] range. β = 1 for an ideal dielectric, where the dipole–dipole interaction is negligible (Debye relaxation) and this interaction is significant when β < 1 (non-Debye relaxation). On the other hand, in order to determine the activation energy Ea of the relaxation process in the studied sample, the thermal evolution of ln
![[thin space (1/6-em)]](https://www.rsc.org/images/entities/char_2009.gif) ωmax is traced in Fig. S.7.† The value of the relaxation frequency ωmax increases with increasing temperature, indicating that the relaxation processes in the material is thermally activated. The temperature dependence of ωmax was described by Arrhenius equation
ωmax is traced in Fig. S.7.† The value of the relaxation frequency ωmax increases with increasing temperature, indicating that the relaxation processes in the material is thermally activated. The temperature dependence of ωmax was described by Arrhenius equationwhere, ω0 is a constant and kB presents the Boltzmann constant. The determination of the activation energy is deduced from the calculation of the slope of the linear fit on the plot which gave us a value of 1.21 eV. Notably, the value similar to the value of Ea evaluated from conductivity, suggesting that the electric parameters are responsible for both the conduction and relaxation processes and have an equivalent effect on the compound under investigation.56
The inset of Fig. S.7† represents the variation of β′ values as a function of temperature. The variation of this parameter reveals that β′ increases with an increase in temperature. We note that β′ less then unity which confirm that the prepared samples do not exhibit Debye dielectric behaviour.57
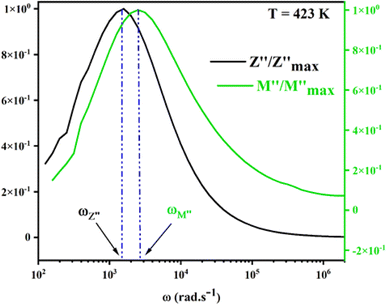
For a more comprehensive of the conductivity relaxation nature, we illustrate in Fig. 10 the frequency dependence of the standardized parameters  and
and  at 423 K. The shift towards a higher frequency region is evident in both the
  and
and  peaks, indicating a clear correlation. The noticeable gap between the normalized M′′ and Z′′ loss peaks implies that the prevailing relaxations are primarily influenced by the localized hopping of charge carriers. This implies that charge carriers are traveling short distances inside the studied compound and prove the non-Debye behaviour.58
8. Conclusion
Summary, this work presents the synthesis of single crystals of a novel organic–inorganic hybrid material with the formula [C8H10NO]2HgBr4. According to the X-ray diffraction investigation, the compound crystallizes in the orthorhombic system with the Cmca space group. The cohesiveness of the complex is ensured by hydrogen bonds (between N–H–Br and N–H–O) and π–π stacking interactions between the organic and inorganic portions, as demonstrated by Hirshfeld surface analysis. The infrared spectrum of [C8H10NO]2HgBr4 was recorded at room temperature and discussed. The assignment of the vibrational bands was performed by comparison with the vibration modes and frequencies of homologous compounds. Regarding the complex impedance spectra research, it reveals that the material's electrical characteristics are strongly influenced by frequency and temperature. Which indicates the presence of a relaxation phenomenon. The Nyquist diagram were fitted with the one-cell equivalent circuit model R/C/CPE. The ac conductivity, over the studied temperature and frequency range, is analysed by Jonscher's power law. The thermal behaviour of the extracted exponent “s” confirmed that the CBH model is the appropriate model for [C8H10NO]2HgBr4 compound. Eventually, the presence of one thermally activated relaxation peaks, observed in the modulus spectra further, supports the contribution of grain and the electrical response in the material. The coexistence of localized and delocalized motion of charge carriers was demonstrated by a comparison analysis of the normalized relaxation peaks corresponding to Z′′ and M′′, which also demonstrated the absence of Debye behavior.Conflicts of interest
The authors declare that they have no conflict of interests.References
- A. E. M. El-Sayed, O. A. Al-Fulaij, A. A. Elaasar, M. M. El-Defrawy and A. A. El-Asmy, Spectrochim. Acta, Part A, 2015, 135, 211–218 CrossRef CAS.
- M. K. Singh, S. Sutradhar, B. Paul, S. Adhikari, F. Laskar, R. J. Butcher, S. Acharya and A. Das, J. Mol. Struct., 2017, 1139, 395–399 CrossRef CAS.
- I. Chaabane, W. Rekik, H. Ghalla, M. Zaghrioui, J. Lhoste and A. Oueslati, RSC Adv., 2024, 14(5), 3588–3598 RSC.
- I. Garoui, Phys. E, 2024, 158, 115897 CrossRef CAS.
- Y. Ai, X.-G. Chen, P.-P. Shi, Y.-Y. Tang, P.-F. Li, W.-Q. Liao and R.-G. Xiong, Am. Chem. Soc., 2019, 141(10), 4474–4479 CrossRef CAS.
- A. Ouasri, Rev. Inorg. Chem., 2022, 43(2), 247–280 CrossRef.
- M. Dhanalakshmi, C. Balakrishnan, S. R. Ahamed, G. Vinitha and S. Parthiban, J. Mol. Struct., 2021, 1237, 130421 CrossRef CAS.
- I. Gharbi, A. Oueslati, A. Ates, A. Mahmoud, M. Zaghrioui and M. Gargouri, RSC Adv., 2023, 13(15), 10036–10050 RSC.
- Z. Peng, X. Xing and X. Chen, J. Alloys Compd., 2006, 425(1–2), 323–328 CrossRef CAS.
- D. B. Mitzi, K. Chondroudis and C. R. Kagan, IBM J. Res. Dev., 2001, 45(1), 29–45 CAS.
- I. Chaabane, F. Hlel and K. Guidara, J. Alloys Compd., 2008, 461(1–2), 495–500 CrossRef CAS.
- S. Choundali, F. Hlel and H. Khemakhem, Appl. Phys. A, 2016, 122(12), 1066 CrossRef.
- I. Dhouib, A. Ouasri and Z. Elaoud, J. Saudi Chem. Soc., 2020, 24(8), 567–583 CrossRef CAS.
- H. Teraon, T. M. Gesing, H. Ishihara, Y. Furukawa and B. T. Gowda, Acta Crystallogr., Sect. E: Struct. Rep. Online, 2009, 65(3), m323 CrossRef PubMed.
- G. M. Sheldrick, Program for Area Detector Adsorption Correction, Institute for Inorganic Chemistry, University of Gottingen, Germany, 1996 Search PubMed.
- L. J. Farrugia, J. Appl. Crystallogr., 1999, 32(4), 837–838 CrossRef CAS.
- G. M. Sheldrick, C. Krüger and R. Goddard, SHELXS-86 Crystallographic Computing, Oxford University Press, Gottingen-Germany, 1985, vol. 175 Search PubMed.
- G. M. Sheldrick SHELXL-97, Program of Crystal Structure Determination, Gottingen University, 1997 Search PubMed.
- G. Bergerhoff, M. Berndt and K. Brandenburg, J. Res. Natl. Inst. Stand., 1996, 101(3), 221 CrossRef CAS.
- P. R. Spackman, M. J. Turner, J. J. McKinnon, S. K. Wolff, D. J. Grimwood, D. Jayatilaka and M. A. Spackman, J. Appl. Crystallogr., 2021, 54(3), 1006–1011 CrossRef CAS PubMed.
- S. K. Seth, N. C. Saha, S. Ghosh and T. Kar, Chem. Phys. Lett., 2011, 506(4–6), 309–314 CrossRef CAS.
- A. Abkari, I. Chaabane and K. Guidara, Phys. E, 2016, 86, 2010–2217 Search PubMed.
- R. Al-Far, B. F. Ali and K. Al-Sou’oud, J. Chem. Crystallogr., 2006, 36(8), 523–529 CrossRef CAS.
- H. Ltaief, A. Mahroug, P. Paoli, P. Rossi and M. Belhouchet, J. Mol. Struct., 2020, 1220, 128760 CrossRef CAS.
- S.-J. Li, A.-H. Chen, Z.-Y. Zheng, S.-W. Liu and Q.-X. Liu, Acta Crystallogr., Sect. E: Struct. Rep. Online, 2009, 65(12), m1652 CrossRef CAS PubMed.
- W. H. Baur, Acta Crystallogr., Sect. B: Struct. Crystallogr. Cryst. Chem., 1974, 30(5), 1195–1215 CrossRef CAS.
- B. F. Ali and R. Al-Far, J. Chem. Crystallogr., 2008, 38(9), 689–693 CrossRef CAS.
- C. Janiak, J. Chem. Soc., Dalton Trans., 2000, 21, 3885–3896 RSC.
- N. J. Singh, S. K. Min, D. Y. Kim and K. S. Kim, J. Chem. Theory Comput., 2009, 5(3), 515–529 CrossRef CAS PubMed.
- S. Goswami, A. K. Mahapatra, K. Ghosh, G. D. Nigam, K. Chinnakali and H.-K. Fun, Acta Crystallogr., Sect. C: Struct. Chem., 1999, 55(1), 87–89 CrossRef.
- D. Sajan, I. H. Joe and V. S. Jayakumar, J. Raman Spectrosc., 2006, 37(4), 508–519 CrossRef CAS.
- L. Bencivenni, A. Margonelli, A. Mariani, A. Pieretti and S. Nunziante Cesaro, ISRN Inorg. Chem., 2012, 1–11 Search PubMed.
- M. Karabacak, M. Kurt, M. Cinar, S. Ayyappan, S. Sudha and N. Sundaraganesan, Spectrochim. Acta, Part A, 2012, 92, 365–376 CrossRef CAS PubMed.
- J. Oh, Y. M. Sung, H. Mori, S. Park, K. Jorner, H. Ottosson, M. Lim, A. Osuka and D. Kim, Chem, 2017, 3(5), 870–880 CAS.
- K. Arici and R. Yilmaz, Int. J. Chem. Technol., 2020, 4(2), 156–161 CrossRef.
- N. B. Colthup, L. H. Daly and S. E. Wiberley, Hardback, 1990 Search PubMed.
- M. Abbassi, R. Ternane, I. Sobrados, A. Madani, M. Trabelsi-Ayadi and J. Sanz, Ceram. Int., 2013, 39(8), 9215–9221 CrossRef CAS.
- R. B. Said, B. Louati and K. Guidara, Ionics, 2013, 20(2), 209–219 CrossRef.
- H. Khelifi, I. Zouari, A. Al-Hajry, N. Abdelmoula, D. Mezzane and H. Khemakhem, Ceram. Int., 2015, 41(10), 12958–12966 CrossRef CAS.
- P. Nayak, T. Badapanda, A. K. Singh and S. Panigrahi, RSC Adv., 2017, 7(27), 16319–16331 RSC.
- A. Omri, M. Bejar, E. Dhahri, M. Es-Souni, M. A. Valente, M. P. F. Graça and L. C. Costa, J. Alloys Compd., 2012, 536, 173–178 CrossRef CAS.
- M. M. Costa, G. F. M. Pires, A. J. Terezo, M. P. F. Graça and A. S. B. Sombra, J. Appl. Phys., 2011, 110(3) CrossRef CAS.
- M. Hamdi, A. Oueslati, I. Chaabane and F. Hlel, ISRN Condens. Matter Phys., 2012, 1–8 Search PubMed.
- M. A. Fersi, I. Chaabane and M. Gargouri, Phys. E, 2016, 83, 306–313 CrossRef CAS.
- Impedance Spectroscopy, ed. E. Barsoukov and J. R. Macdonald, 2005 Search PubMed.
- C. M. Zhu, G. B. Yu, L. G. Wang, M. W. Yao, F. C. Liu and W. J. Kong, J. Magn. Magn. Mater., 2020, 506, 166803 CrossRef CAS.
- E. Dul’kin, S. Kojima and M. Roth, J. Appl. Phys., 2011, 110(4), 044106 CrossRef.
- A. K. Jonscher, J. Mater. Sci., 1978, 13(3), 553–562 CrossRef CAS.
- I. G. Austin and N. F. Mott, Adv. Phys., 1969, 18(71), 41–102 CrossRef CAS.
- I. Chaabane, F. Hlel and K. Guidara, J. Alloys Compd., 2008, 461, 495–500 CrossRef CAS.
- N. Chakchouk, B. Louati and K. Guidara, J. Alloys Compd., 2018, 747, 543–549 CrossRef CAS.
- N. K. Mohanty, S. K. Satpathy, B. Behera, P. Nayak and R. N. P. Choudhary, J. Adv. Ceram., 2012, 1(3), 221–226 CrossRef CAS.
- P. Thongbai, S. Tangwancharoen, T. Yamwong and S. Maensiri, J. Condens. Matter Phys., 2008, 20(39), 395227 CrossRef.
- S. B. Yahya and B. Louati, J. Alloys Compd., 2021, 876, 159972 CrossRef CAS.
- R. Bergman, J. Appl. Phys., 2000, 88(3), 1356–1365 CrossRef CAS.
- S. Ben Yahya, R. Barillé and B. Louati, RSC Adv., 2022, 12(11), 6602–6614 RSC.
- C. B. Mohamed, K. Karoui, S. Saidi, K. Guidara and A. B. Rhaiem, Phys. B, 2014, 451, 87–95 CrossRef CAS.
- H. Saadi, Z. Benzarti, F. I. H. Rhouma, P. Sanguino, S. Guermazi, K. Khirouni and M. T. Vieira, J. Mater. Sci.: Mater. Electron., 2021, 32(2), 1536–1556 CrossRef CAS.
Footnote |
| † Electronic supplementary information (ESI) available. CCDC 2338144. For ESI and crystallographic data in CIF or other electronic format see DOI: https://doi.org/10.1039/d4ra00689e |
| This journal is © The Royal Society of Chemistry 2024 |

