 Open Access Article
Enhancing thermometric efficiency: a wavelength excitation analysis in LiSrGdW3O12:Tb3+ for superior single band ratiometric (SBR) thermometry
Fadwa Ayachia,
Kamel Saidi a,
Mohamed Dammak
 *a,
Joan Josep Carvajal
 b and
Maria Cinta Pujolb
aLaboratoire de Physique Appliquée, Groupe des Matériaux Luminescents, Faculté des Sciences de Sfax, Département de Physique, Université de Sfax, BP, 1171, Sfax, Tunisia. E-mail: madidammak@yahoo.fr; Mohamed.dammak@fss.usf.tn
bUniversitat Rovira i Virgili, Departament de Química Física i Inorgànica, Materials in Green Chemistry (GreenMat), Marcel·li Domingo 1, Tarragona 43007, Spain
First published on 25th April 2024
Abstract
This study delves into the Single Band Ratiometric (SBR) method for luminescence thermometry, specifically employing Tb3+-doped LiSrGdW3O12 (LSGW) as a novel phosphor. The prepared samples crystallize with the tetragonal scheelite structure, with the optimal Tb3+ concentration pinpointed at 0.3Tb3+ ions. When stimulated at diverse wavelengths exhibit luminescence characterized by varying heat dependencies. By utilizing two Fluorescence Intensity Ratio (FIR) parameters for the 544 nm green emission, firstly excited at 405 nm and 488 nm, and then at 405 nm and 379 nm, the Sr relative thermal sensitivity of the luminescent thermometer peaks at 3.56% K−1 and 4.21% K−1, respectively, within the temperature range of 290–440 K. The temperature resolution (δT) of the luminescent thermometer is calculated to be δT1 = 0.68 K and δT2 = 0.75 K for T = 290 K, respectively. These outcomes underscore the applicability of Tb3+ ions for SBR thermometry, emphasizing the impact of the excitation wavelength on the thermal sensitivity. The study lays the groundwork for developing highly sensitive temperature probes by elucidating the interplay of material properties and physical processes.
1. Introduction
It has been observed that research devoted to optimizing luminescent thermometry and charting new development avenues has grown in popularity as this technology provides a remote temperature readout with high resolution and sensitivity.1–3 A single-band ratiometric (SBR) thermometer is one of the new approaches in luminescent thermometry that has recently received a lot of attention. It uses a single optically active center that is excited in two different ways, resulting in emission signals with opposite temperature dependences.4–7 One of the major benefits of SBR luminescence thermometry is that the emission is only gathered in the selected spectral region. This allows us to prevent the negative impacts of selective absorption of a tested medium, which can change the shape of the emission spectrum and hence the reliability of the temperature readout. To achieve opposite thermal monotonicity of a single emission band, two primary excitation processes are utilized, namely edge excitation and excited state absorption. Because the latter allows for more extensive adjustment of the phosphor's thermographic characteristics, it is used more frequently. Lanthanide ions are the most ideal kind of optically active centers to employ for this purpose because of their unique energy level distribution, which gives numerous options for selecting the right excitation wavelengths for SBR.7–10 The intensity of the emission from these ions shows quenching as the temperature rises when they are activated at a resonant wavelength that matches the ground state absorption (GSA). However, when the excitation is matched to the excited state absorption (ESA), they also show a thermally driven rise in emission intensity under the right circumstances. The potential relative thermal sensitivity (Sr) of this kind of luminescent thermometer is greatly increased by the fluctuation of GSA and ESA stimulated emission intensity. Results that were recently published demonstrated how the kind of doping ion, the nature of the host material, and the interionic energy transfer affect the thermally induced ESA process.4,5 Nonetheless, up to now, the focus has been on process improvement that results in the thermal enhancement of the ESA process.The selection of an appropriate host material is pivotal in the design of high-efficiency luminescent materials and high-performance luminescent sensors. Inorganic luminescent materials play a critical role in contemporary photonics technologies. Among these, binary alkaline earth tungstates, represented by the formula MLn2(WO4)4 (where M denotes an alkaline earth bivalent metal ion, and Ln represents trivalent rare-earth ions), are classified as scheelite-structured compounds. The scheelite structure is prevalent in binary molybdates and tungstates, and noteworthy reports underscore their exceptional upconversion (UC) photoluminescence properties.11,12 Tungstate compounds are widely recognized as essential inorganic functional materials with a rich history of practical applications in scintillation detectors, solid-state lasers, and stimulated Raman scattering (SRS). For instance, crystals like PbWO4 and CdWO4 exhibit excellent scintillation properties.6 Additionally, KGd(WO4)2:Nd (KGW:Nd) and KY(WO4)2:Nd (KYW:Nd) crystals have demonstrated competitive properties with commercial Nd:YAG crystals in quasi-CW and Q-switched lasers due to their short storage time and large emission cross-sections.7 Furthermore, certain tungstate crystals, such as KGW and BaWO4,15,16 showcase significant third-order nonlinearities and have been explored as promising Raman shifters. On the flip side, ternary tungstates with a general composition of NaMLn(WO4)3 (M = Ca3+, Sr3+, and Ba3+; Ln = La3+, Gd3+, and Y3+), which crystallize in the monoclinic crystallographic system with the C2/c space group, have been documented. Specifically, NaSrLa1−x(WO4)3,9 and KBaGd(WO4)3 have been identified as noteworthy instances, with the latter emerging as a novel host material for solid-state lasers.18,19
To date, SBR thermometry, relying on the emission of various lanthanide ions, has been successfully demonstrated, with predominant attention given to lanthanides such as Tb3+, Eu3+, or Nd3+.20–30 These ions, owing to their well-defined and intricate energy-level configurations, prove effective in conducting temperature measurements using the SBR approach. This involves excitations matched to both ground-state absorption (GSA) and excited-state absorption (ESA). The existing literature on SBR luminescent thermometers predominantly focuses on near-infrared (NIR) emissions, exemplified by Nd3+,28,29 or green-emitting phosphors, such as Tb3+.21,22,24,27,30 Additionally, investigations have extended to the red and yellow spectral ranges utilizing Eu3+-doped phosphors.20,23,25,26
For optimal performance employing the SBR strategy to develop a high-performance luminescent sensor, this study places emphasis on evaluating the impact of the excitation wavelength on the thermometric parameters. In this article, Tb3+-doped LSGW phosphors were synthesized through the conventional solid-state reaction method. Our focus is on the LiSrGdW3O12 (LSGW) host, chosen for its cost-effectiveness and ease of preparation. The results obtained indicate a promising direction for enhancing temperature sensing precision and sensitivity.
2. Equipment, synthesis and characterization
A series of terbium doped LSGW microcrystals LiSrGd1−xTbx(WO4)3 (x = 0.1, 0.2, 0.3, 0.4, 0.5 and 0.6) were prepared by solid state reaction. Li2CO3 (99.99%), SrCO3 (99.99%), Gd2O3 (99.99%), WO3 (99.99%) and Tb4O7 (99.99%) were used as starting materials.The stoichiometric coefficient of Li2CO3, SrCO3, Gd2O3, WO3 and Tb4O7 were taken and ground using an agate mortar and pestle and calcined at 600 °C for 16 h and then reground, and annealed at 800 °C for 12 h. Finally, the collected phosphors were ground again to produce a fine powder and were kept in the container for further analysis.
The X-ray powder diffraction (XRPD) of all synthesized phosphors was recorded using a SIEMENS D8-θ/2θ with a Cu Kα X-ray source (λ = 0.15418 nm). The SEM images were taken with a Quanta 600 environmental scanning electron microscope (ESEM) from FEI. Diffuse reflection spectra were measured between 250 and 1100 nm with a scanning UV-Vis spectrophotometer (PerkinElmer). The photoluminescence spectra (excitation and emission) were recorded using a Horiba Fluoromax 4P spectrometer equipped with a Xenon lamp as the excitation source at room temperature. The sample temperature was controlled to be in the 300–440 K range by using a helium closed-cycle cryostat and a Lake Shore 321 temperature controller. The CIE colour coordinates were calculated from the emission spectral data of the synthesised phosphors using a chromaticity calculator program developed by ourselves.
3. Results and discussions
3.1 Crystalline and morphological characterization of the obtained products
Fig. 1a displays the XRPD patterns of the obtained products, denoted as LiSrGd (WO4)3:x%Tb3+ (where x = 10, 20, 30, 40, and 50). The predominant peak at 2θ = 28.5° is accompanied by other peaks at 31°, 34°, 39°, 47°, 49°, 54°, 58°, 59°, and 76°, which closely match the reference pattern card JCPD S25-0829.11 Table 1 presents the unit cell parameters corresponding to various Tb concentrations. The samples exhibit a crystalline structure consistent with orthorhombic scheelite, characterized by the space group I41/a (no. 88).11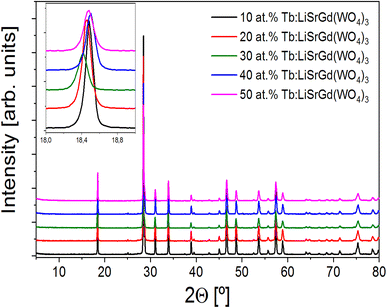 | ||
| Fig. 1 XRPD patterns of the obtained products, x% Tb3+:LiSrGd (WO4)3 being x = 10, 20, 30, 40 and 50. Inset: Angle shift related to the Tb concentration. | ||
| % Tb | a (Å) | c (Å) | Volume (Å3) | Rexp/Rwp |
|---|---|---|---|---|
| 10 | 5.28349(8) | 11.5189(2) | 321.553(12) | 4.51/7.49 |
| 20 | 5.28165(10) | 11.5138(2) | 321.189(14) | 4.60/6.96 |
| 30 | 5.27709(13) | 11.5007(3) | 320.269(18) | 6.01/7.88 |
| 40 | 5.28214(11) | 11.5145(3) | 321.268(16) | 5.18/7.99 |
| 50 | 5.28121(14) | 11.5146(3) | 321.154(19) | 5.73/8.06 |
A maximum shift of θ ≈ 18° was found for the lowest angle region, shown in the inset of Fig. 1, when theTb3+ concentration increased. Table 1 summarizes the unit cell parameters refined by using the Le Bail methodology using the TOPAS software.
The introduction of Tb3+ into the crystalline structure results in a reduction of the unit cell parameters. This phenomenon can be attributed to the disorder arising from the Gd3+ → Tb3+ substitution. The incorporation of Tb3+ ions into the LSGW lattice induces a local distortion of the crystal structure. The anticipated compression during the substitution of Gd3+ by Tb3+ is attributed to the difference in ionic radii, specifically, the coordination 8 radii of Gd3+ (1.053 Å) and Tb3+ (1.040 Å).
The SEM photographs presented in Fig. 2 illustrate the shape, size and distribution of the particles in the samples. SEM images showed that the particles are micrometric in size, without significant changes in morphology when the concentration of Tb3+ increased.
3.2 Optical characterizations
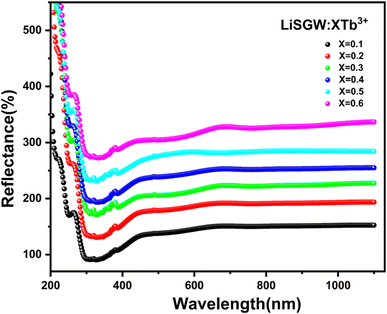
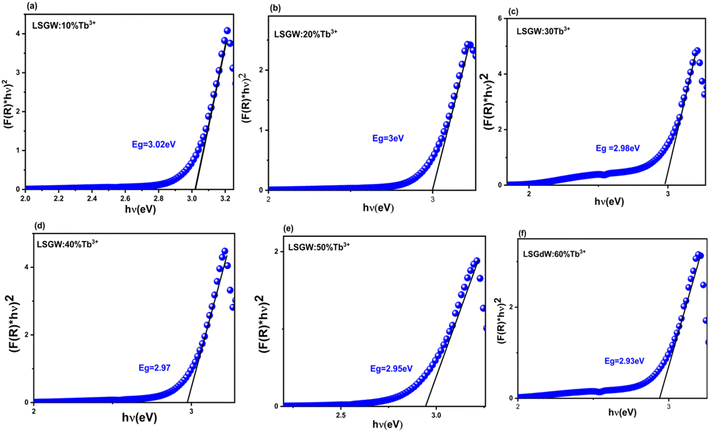
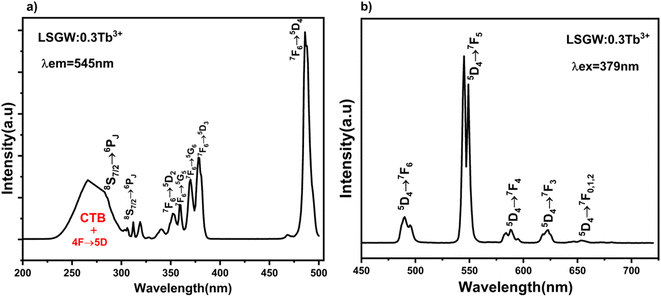
In this spectra, the electronic transitions corresponding to the group (WO4)2− are the origin of a wide band with the highest intensity in the 240–370 nm range.13 The optical band gaps (Eg) of the prepared phosphors have been calculated from the diffuse reflection spectra, which may be determined by using the Kubelka–Munk (KM) and the Tauc equation.14 Fig. 4 displays the plot of (F(R)hν)2 versus (hν), in which F(R) is the reflection function measured. The LSGW:xTb3+ energy gap values were calculated to be: (a) Eg = 3.02, (b) Eg = 3.00, (c) Eg = 2.98, (d) Eg = 2.97, (e) Eg = 2.95 and (f) Eg = 2.93 eV for x = 0.1, 0.2, 0.3, 0.4, 0.5 and 0.6 respectively. These values are lower than the ones obtained for LiGd (WO4)2, in which the direct optical band gap observed was 3.607 eV. Therefore, the introduction of Tb in the crystalline structure reduces the band gap. Besides, the energy gap decreases from 3.02 to 2.93 eV as the doping content increases.
In most cases, the emission intensity of lanthanide ion doped materials is mostly defined by the concentration of dopants. The emission spectra of LSGW doped with various concentrations of Tb3+ ions (x = 0.1, 0.2, 0.3, 0.4, 0.5 and 0.6) are presented in Fig. 7a. All the emission spectra exhibit the same form with a change in their intensities with an increase in the Tb3+ concentration. It is clear from the box that as the content of Tb3+ ions increase, the emission intensity of Tb3+ progressively increases and attains a maximum at x = 0.3. With higher Tb3+ concentrations, the emission intensity decreases owing to the concentration quenching. It can be assigned to a non-radiative energy transfer between Tb3+ ions. The nonradiative energy transfer could either be caused by a multipole–multipole interaction or an exchange interaction. In addition, the energy transfer between Tb3+–Tb3+ ions can be influenced mainly by the distances between the activator ions in the host matrix. The critical transfer distance Rc calculated by Blasse's equation can be found by using the following expression (eqn (1)).19,20
 | (1) |
 | (2) |
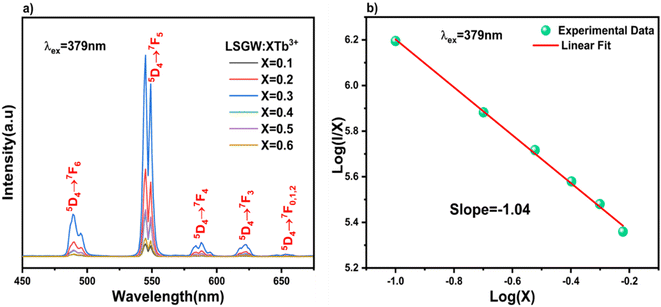 | ||
| Fig. 7 (a) PL spectra of LSGW:xTb3+ (x = 0.1, 0.2, 0.3, 0.4, 0.5 and 0.6) excited at 379 nm. (b) Linear fitting of log(I/X) in terms of log(X). | ||
θ represents the multipole interaction constant equivalent to 6, 8 or 10 corresponding to dipole–dipole (D–D), dipole–quadrupole (D–Q) and quadrupole–quadrupole (Q–Q) interactions, respectively. K and β are constants for each interaction upon the same excitation. Eqn (2) can be expanded as follows:
 | (3) |
The straight-line relationship between log![[thin space (1/6-em)]](https://www.rsc.org/images/entities/char_2009.gif) X and log(I/X) values of xTb3+ (x = 0.1, 0.2, 0.3, 0.4, 0.5 and 0.6) doped phosphors is illustrated in Fig. 7b. The “θ” value is near 6, indicating that the quenching phenomenon between the Tb3+ ions in our LSGW compound corresponds to dipole–dipole (D–D) interactions.22
X and log(I/X) values of xTb3+ (x = 0.1, 0.2, 0.3, 0.4, 0.5 and 0.6) doped phosphors is illustrated in Fig. 7b. The “θ” value is near 6, indicating that the quenching phenomenon between the Tb3+ ions in our LSGW compound corresponds to dipole–dipole (D–D) interactions.22
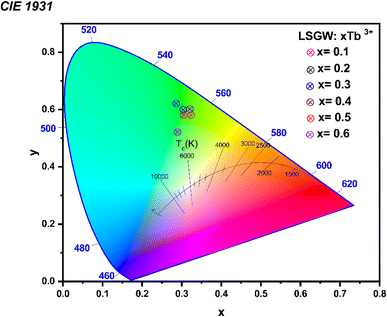
To estimate the luminous colour of the phosphor material, the CIE chromaticity coordinates, which are relevant for the performance of the phosphors, were determined from emission spectra (see Fig. 8) The values that were calculated are given in Table 1. It is apparent that the colour coordinates of the LSGW:xTb3+ phosphors are in the red region of the CIE diagram. These results indicated that Tb3+ doped LSGW phosphors could be a potential candidate for green LED application (Table 2).
| Samples | CIE (x, y) |
|---|---|
| x = 0.1 | (0.30; 0.60) |
| x = 0.2 | (0.30; 0.59) |
| x = 0.3 | (0.32; 0.61) |
| x = 0.4 | (0.30; 0.60) |
| x = 0.5 | (0.31; 0.59) |
| x = 0.6 | (0.31; 0.58) |
4. Single-band ratiometric (SBR) approach thermometry
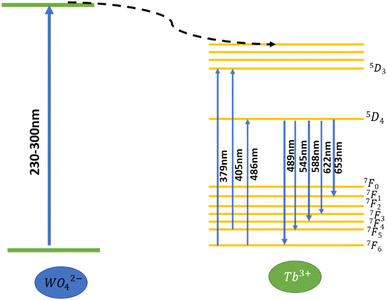
To investigate the optical thermal sensing behaviour of the as-prepared LSGW:Tb3+ MCs, the emission spectra upon ESA and GSA were recorded at different temperatures. With its wavelength-dependent thermal behaviour, Tb3+ luminescence offers a great opportunity for SBR thermometry. As a result, the wavelengths of 379 nm and 486 nm were selected as GSA and 405 nm as ESA for the SBR model. Accordingly, the luminescence arising from the 5D4–7F5 transition can be used as a sensitive thermometric parameter, since it depends on the thermal properties of the excitation under GSA (in this case 379 nm and 486 nm) and ESA (in this case 405 nm) matched conditions.23,24 Therefore, all the processes described above are temperature-dependent in the 290–440 range, and it can be concluded that the 5D4 population decreases when the temperature increases under the two excitation wavelengths that matches to GSA (λex = 379 nm and λex = 486 nm) as shown in Fig. 9b and c, respectively. In contrast, when the excitation matches to ESA (λex = 405 nm), the 5D4 population increases with temperature as depicted in Fig. 9a. The opposing thermal dependence of the 5D4–7F5 transition under GSA and ESA excitation wavelengths supported our hypothesis that the FIR of those signals in a single emission band can be calibrated with temperature for SBR thermometry. The FIR is defined as follows (eqn (4)):
 | (4) |
 | (5) |
 | (6) |
 | (7) |
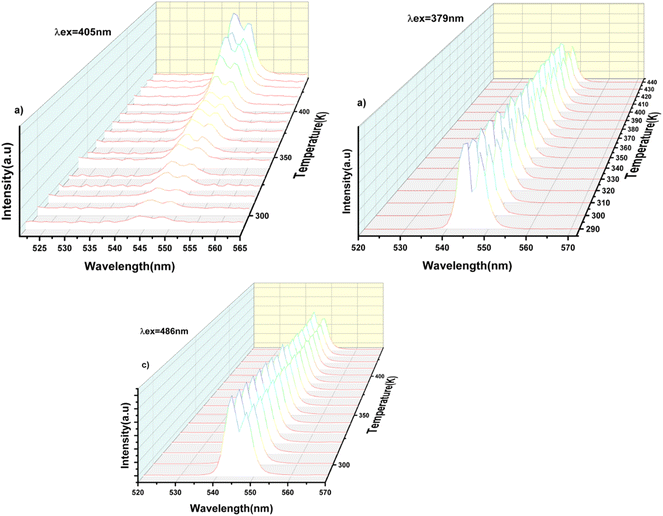 | ||
| Fig. 9 Emission spectra of the LSGW:0.3Tb3+ phosphor at different temperatures at: (a) 405 nm excitation (ESA), (b) 379 nm (GSA), (c) 486 nm (GSA). | ||
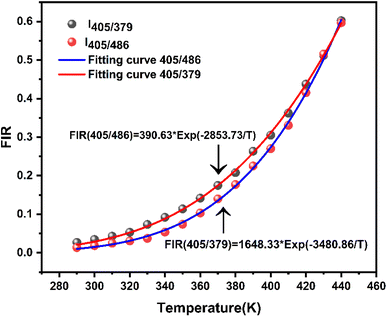 | ||
| Fig. 10 Luminescence intensity ratio (FIR) of the LSGW:0.3Tb3+phosphor in the 290–440 K temperature range for FIR1 (405/379), and FIR2 (405/486). | ||
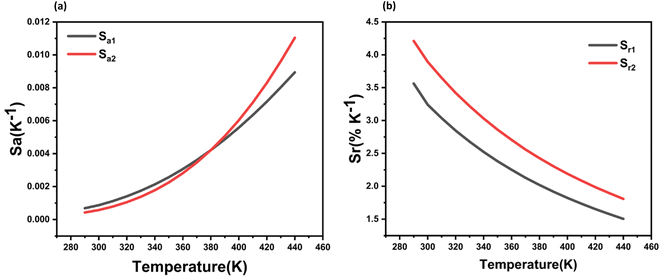 | ||
| Fig. 11 (a) Absolute and, (b) relative thermal sensitivities obtained for the LSGW:0.3Tb3+ phosphor in the 290–440 K temperature range. | ||
| Host material | Emission wavelength (nm) | 1st λexc [nm] | 2nd λexc [nm] | Sr max [% K−1] | Ref. |
|---|---|---|---|---|---|
| KLaP4O12:Tb3+ | 544 | 377 | 413 | 3.2 | 31 |
| Oxyfluorotellurite glass:Tb3+ | 543 | 377 | 413 | 2.05 | 24 |
| KGdW4O8:Tb3+ | 543 | 377 | 413 | 1.63 | 32 |
| CaWO4:Tb3+ | 544 | 300 | 380 | 1.28 | 33 |
| CaWO4:Tb3+ | 544 | 310 | 378 | 1.6 | 34 |
| YVO4:Er3+ | 552 | 350 | 379 | 2.34 | 35 |
| YVO4:Er3+ | 552 | 350 | 489 | 2.61 | 35 |
| LiLaP4O12:Eu3+ | 590 | 450 | 620 | 2.17 | 36 |
| LiLaP4O12:Eu3+ | 590 | 450 | 650 | 2.31 | 36 |
| LiLaP4O12:Eu3+ | 590 | 450 | 690 | 1.9 | 36 |
| Lu2O3:Eu3+ | 590 | 586.5 | 611 | 0.93 | 37 |
| LaPO4:Nd3+ | 890 | 808 | 1064 | 4.35 | 38 |
| LaPO4:Nd3+ | 890 | 808 | 1064 | 3.04 | 38 |
| LaPO4:Nd3+ | 890 | 808 | 1064 | 7.19 | 38 |
| LSGW:Tb3+ | 545 | 405 | 486 | 4.2 | This work |
| LSGW:Tb3+ | 545 | 405 | 379 | 3.56 | This work |
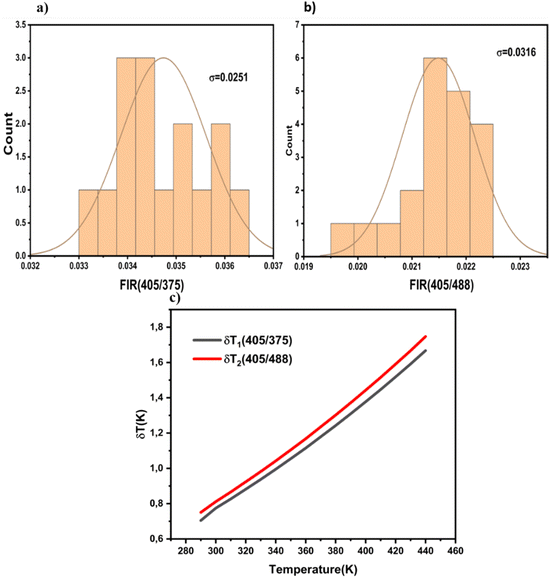 | ||
| Fig. 12 Standard deviations at RT for (a) FIR1 and (b) FIR2 obtained after 20 measurements at 300 K. (c) Temperature resolution values for FIR1 (δT1) and FIR2 (δT2). | ||
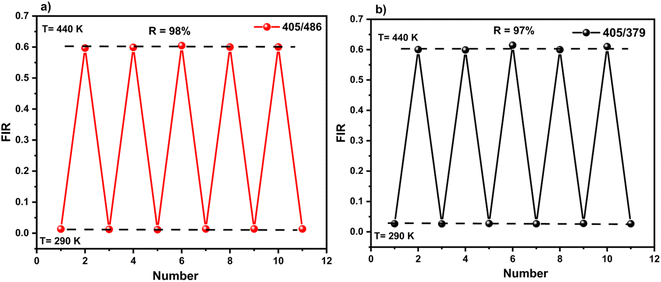
To verify the precision of the employed temperature sensing methods, the determined thermometric parameters (FIR values) were meticulously measured through successive cycles of the sample between ambient temperature (290 K) and elevated temperatures (440 K), as illustrated in Fig. 13. The calculation used to ascertain the repeatability (R) was as follows:39,40
5. Conclusions
The XRD and Rietveld refinement analyses reveal that LSGW:Tb3+ crystallizes in the tetragonal system with the I41/a space group. SEM examination was employed to assess the phosphors' morphology, indicating a particle size of 30 μm. Absorption measurements confirm the formation of the tungstate host, with the distinct WO42− groups' absorption bands observed in the visible spectrum. By employing two Fluorescence Intensity Ratio (FIR) parameters for the 544 nm green emission, excited firstly at 405 nm, and 379 nm, and then at 405 nm, and 488 nm, for both ground state absorption (GSA) and excited state absorption (ESA), the Sr relative thermal sensitivity of the luminescent thermometer peaks at 3.56% K−1 and 4.21% K−1, respectively, at 290 K within the temperature range of 290–440 K. We evaluated their suitability for single-band ratiometric (SBR) luminescent thermometry. Notably, the modulation of relative sensitivity in this thermometry through a simple change in excitation wavelength was demonstrated. The highest relative sensitivities, were achieved for 405 nm and 488 nm excitations. The temperature resolution (δT) of the luminescent thermometer is calculated to be δT1 = 0.68 K and δT2 = 0.75 K for T = 290 K, respectively. Our study contributes to the understanding of LSGW:Tb3+ as a promising candidate for precise temperature measurements and opens avenues for further exploration in luminescent sensing applications.Conflicts of interest
There are no conflicts to declare.References
- D. Jaque and F. Vetrone, Luminescence nanothermometry, Nanoscale, 2012, 4, 4301–4326, 10.1039/c2nr30764b.
- K. Trejgis, R. Lisiecki, A. Bednarkiewicz and L. Marciniak, Nd3+ doped TZPN glasses for NIR operating single band ratiometric approach of contactless temperature readout, J. Lumin., 2020, 224, 117295, DOI:10.1016/j.jlumin.2020.117295.
- A. S. Souza, L. A. O. Nunes, I. G. N. Silva, F. A. M. Oliveira, L. L. da Luz, H. F. Brito, M. C. F. C. Felinto, R. A. S. Ferreira, S. A. Júnior, L. D. Carlos and O. L. Malta, Highly-sensitive Eu3+ ratiometric thermometers based on excited state absorption with predictable calibration, Nanoscale, 2016, 8, 5327–5333, 10.1039/c6nr00158k.
- J. Drabik, R. Kowalski and L. Marciniak, Enhancement of the sensitivity of single band ratiometric luminescent nanothermometers based on Tb3+ ions through activation of the cross relaxation process, Sci. Rep., 2020, 10, 11190, DOI:10.1038/s41598-020-68145-5.
- J. Meng, H. Fang, H. Wang, Y. Wu, C. Wei, S. Li, X. Geng, X. Li, J. Zhang, G. Wen and P. Wang, Effects of refractory metal additives on diboride-based ultra-high temperature ceramics: a review, Int. J. Appl. Ceram. Technol., 2023, 20, 1350–1370, DOI:10.1111/ijac.14336.
- J. Wang, H. Yu, Y. Wu and R. Boughton, Recent developments in functional crystals in china, Engineering, 2015, 1, 192–210 CrossRef CAS.
- Y. Kalisky, L. Kravchik and C. Labbe, Repetitive modulation and passively Q-switching of diode-pumped Nd–KGW laser, Opt. Commun., 2001, 189, 113–125 CrossRef CAS.
- P. Cerny, H. Jelinkova, T. T. Basiev and P. G. Zverev, Properties of transient and steady-state stimulated Raman scattering in KGd(WO4)2 and BaWO4 tungstate crystals, in Growth Fabr. Devices Appl. Laser Nonlinear Mater, SPIE, 2001, pp. , pp. 101–108, https://www.spiedigitallibrary.org/conference-proceedings-of-spie/4268/0000/Properties-of-transient-and-steady-state-stimulated-Raman-scattering-in/10.1117/12.424630.short, accessed December 15, 2023 Search PubMed.
- C. S. Lim, V. V. Atuchin, A. S. Aleksandrovsky and M. S. Molokeev, Preparation of NaSrLa(WO4)3:Ho3+/Yb3+ ternary tungstates and their upconversion photoluminescence properties, Mater. Lett., 2016, 181, 38–41 CrossRef CAS.
- B. Xiao, Y. Huang, L. Zhang, Z. Lin and G. Wang, Growth, structure and spectroscopic characterization of Nd3+-doped KBaGd(WO4)3 crystal with a disordered structure, PLoS One, 2012, 7, e40229 CrossRef CAS PubMed.
- K. Zhong, H. Ye, X. Wang, Y. Li and X. Yao, Synthesis and photoluminescence properties of a novel red-emitting Eu3+-doped LiSrGd(WO4)3 phosphors, J. Mater. Sci. Mater. Electron., 2021, 32, 17170–17181, DOI:10.1007/s10854-021-06176-y.
- T. A. Para and S. K. Sarkar, Challenges in Rietveld refinement and structure visualization in ceramics, Adv. Ceram. Mater., 2021 DOI:10.5772/INTECHOPEN.96065.
- F. Ben Bacha, S. Megdiche Borchani, M. Dammak and M. Megdiche, Optical and complex impedance analysis of double tungstates of mono- and trivalent metals for LiGd(WO4)2 compound, J. Alloys Compd., 2017, 712, 657–665, DOI:10.1016/j.jallcom.2017.04.107.
- K. Baishya, J. S. Ray, P. Dutta, P. P. Das and S. K. Das, Graphene-mediated band gap engineering of WO3 nanoparticle and a relook at Tauc equation for band gap evaluation, Appl. Phys. A, 2018, 124, 704, DOI:10.1007/s00339-018-2097-0.
- Z. Wang, Y. Wang, Y. Li and B. Liu, Low Dimensional Effects on Luminescent Properties of CaWO4:Tb Nanophosphor, J. Electrochem. Soc., 2010, 157, J125, DOI:10.1149/1.3309727.
- Y. Li, Z. Wang, L. Sun, Z. Wang, S. Wang, X. Liu and Y. Wang, Investigation of oxygen vacancy and photoluminescence in calcium tungstate nanophosphors with different particle sizes, Mater. Res. Bull., 2014, 50, 36–41, DOI:10.1016/j.materresbull.2013.10.022.
- Y. Li and G. Hong, Synthesis and luminescence properties of nanocrystalline Gd2O3:Eu3+ by combustion process, J. Lumin., 2007, 124, 297–301, DOI:10.1016/j.jlumin.2006.03.016.
- K. Trejgis, A. Bednarkiewicz and L. Marciniak, Engineering excited state absorption based nanothermometry for temperature sensing and imaging, Nanoscale, 2020, 12, 4667–4675, 10.1039/c9nr09740f.
- Q. Liu, M. Zhang, Z. Ye, X. Wang, Q. Zhang and B. Wei, Structure variation and luminescence enhancement of BaLaMg(Sb, Nb)O6:Eu3+ double perovskite red phosphors based on composition modulation, Ceram. Int., 2019, 45, 7661–7666, DOI:10.1016/j.ceramint.2019.01.065.
- F. Ayachi, K. Saidi, W. Chaabani and M. Dammak, Synthesis and luminescence properties of Er3+ doped and Er3+–Yb3+ codoped phosphovanadate YP0.5V0.5O4 phosphors, J. Lumin., 2021, 240, 118451, DOI:10.1016/j.jlumin.2021.118451.
- D. L. Dexter and J. H. Schulman, Theory of Concentration Quenching in Inorganic Phosphors, J. Chem. Phys., 2004, 22, 1063–1070, DOI:10.1063/1.1740265.
- Y. Tian, Y. Fang, B. Tian, C. Cui, P. Huang, L. Wang, H. Jia and B. Chen, Molten salt synthesis, energy transfer, and temperature quenching fluorescence of green-emitting β-Ca2P2O7:Tb3+ phosphors, J. Mater. Sci., 2015, 50, 6060–6065, DOI:10.1007/s10853-015-9155-1.
- Z. E. A. A. Taleb, K. Saidi, M. Dammak, D. Przybylska and T. Grzyb, Ultrasensitive optical thermometry using Tb3+ doped NaSrGd(MoO4)3 based on single band ratiometric luminescence, Dalton Trans., 2023, 52, 4954–4963, 10.1039/d3dt00376k.
- J. Drabik, R. Lisiecki and L. Marciniak, Optimization of the thermometric performance of single band ratiometric luminescent thermometer based on Tb3+ luminescence by the enhancement of thermal quenching of GSA-excited luminescence in TZPN glass, J. Alloys Compd., 2021, 858, 157690, DOI:10.1016/j.jallcom.2020.157690.
- A. K. Singh, S. K. Singh, B. K. Gupta, R. Prakash and S. B. Rai, Probing a highly efficient dual mode: down-upconversion luminescence and temperature sensing performance of rare-earth oxide phosphors, Dalton Trans., 2013, 42, 1065–1072, 10.1039/c2dt32054a.
- F. Ayachi, K. Saidi, M. Dammak, W. Chaabani, I. Mediavilla-Martínez and J. Jiménez, Dual-mode luminescence of Er3+/Yb3+ codoped LnP0.5V0.5O4 (Ln = Y, Gd, La) for highly sensitive optical nanothermometry, Mater. Today Chem., 2023, 27, 101352, DOI:10.1016/j.mtchem.2022.101352.
- K. Saidi, M. Dammak, K. Soler-Carracedo and I. R. Martín, A novel optical thermometry strategy based on emission of Tm3+/Yb3+ codoped Na3GdV2O8 phosphors, Dalton Trans., 2022, 51, 5108–5117, 10.1039/d1dt03747a.
- I. Kachou, K. Saidi, R. Salhi and M. Dammak, Synthesis and optical spectroscopy of Na3Y(VO4)2:Eu3+ phosphors for thermometry and display applications, RSC Adv., 2022, 12, 7529–7539, 10.1039/d2ra00539e.
- C. D. S. Brites, A. Millán and L. D. Carlos, Handbook on the Physics and Chemistry of Rare Earths, Actin, 2016, vol. 49, pp. 339–427 Search PubMed.
- K. Soler-Carracedo, I. R. Martín, F. Lahoz, H. C. Vasconcelos, A. D. Lozano-Gorrín, L. L. Martín and F. Paz-Buclatin, Er3+/Ho3+ codoped nanogarnet as an optical FIR based thermometer for a wide range of high and low temperatures, J. Alloys Compd., 2020, 847, 156541, DOI:10.1016/j.jallcom.2020.156541.
- J. Drabik, R. Kowalski and L. Marciniak, Enhancement of the sensitivity of single band ratiometric luminescent nanothermometers based on Tb3+ ions through activation of the cross relaxation process, Sci. Rep., 2020, 10, 11190 CrossRef CAS PubMed.
- J. Stefanska, M. Chrunik and L. Marciniak, Sensitivity Enhancement of the Tb3+-Based Single Band Ratiometric Luminescent Thermometry by the Metal-to-Metal Charge Transfer Process, J. Phys. Chem. C, 2021, 125, 5226–5232, DOI:10.1021/acs.jpcc.0c11631.
- L. Li, F. Qin, L. Li, H. Gao and Z. Zhang, New Strategy for Circumventing the Limitation of Thermally Linked States and Boosting the Relative Thermal Sensitivity of Luminescence Ratiometric Thermometry, J. Phys. Chem. C, 2019, 123, 6176–6181, DOI:10.1021/acs.jpcc.8b12175.
- L. Li, F. Qin, L. Li, H. Gao and Z. Zhang, New Strategy for Circumventing the Limitation of Thermally Linked States and Boosting the Relative Thermal Sensitivity of Luminescence Ratiometric Thermometry, J. Phys. Chem. C, 2019, 123, 6176–6181, DOI:10.1021/acs.jpcc.8b12175.
- I. E. Kolesnikov, D. V. Mamonova, M. A. Kurochkin, E. Yu. Kolesnikov and E. Lähderanta, Multimode luminescence thermometry based on emission and excitation spectra, J. Lumin., 2021, 231, 117828, DOI:10.1016/j.jlumin.2020.117828.
- K. Trejgis, A. Bednarkiewicz and L. Marciniak, Engineering excited state absorption based nanothermometry for temperature sensing and imaging, Nanoscale, 2020, 12, 4667–4675 RSC.
- A. Ćirić, I. Zeković, M. Medić, Ž. Antić and M. D. Dramićanin, Judd-Ofelt modelling of the dual-excited single band ratiometric luminescence thermometry, J. Lumin., 2020, 225, 117369 CrossRef.
- K. Trejgis, K. Maciejewska, A. Bednarkiewicz and L. Marciniak, Near-Infrared-to-Near-Infrared Excited-State Absorption in LaPO4:Nd3+ Nanoparticles for Luminescent Nanothermometry, ACS Appl. Nano Mater., 2020, 3, 4818–4825, DOI:10.1021/acsanm.0c00853.
- Z. Wang, M. Jia, M. Zhang, X. Jin, H. Xu and Z. Fu, Trimodal Ratiometric Luminescent Thermometer Covering Three Near-Infrared Transparency Windows, Inorg. Chem., 2021, 60, 14944–14951, DOI:10.1021/acs.inorgchem.1c02311.
- Z. E. A. A. Taleb, K. Saidi and M. Dammak, Dual-mode optical ratiometric thermometry using Pr3+-doped NaSrGd (MoO4)3 phosphors with tunable sensitivity, Dalton Trans., 2023, 52, 18069–18081 RSC.
| This journal is © The Royal Society of Chemistry 2024 |


