 Open Access Article
Enhanced photocatalytic performance of ZnO under visible light by co-doping of Ta and C using hydrothermal method
Thi Viet Ha Luu a,
Hong Yen Xuan Nguyena,
Quoc Thang Nguyen
 a,
Quang Bac Nguyen
 bc,
Thi Ha Chi Nguyenb,
Ngoc Chuc Phamb,
Xuan Dung Nguyend,
Trung Kien Nguyen
 *b and
Ngoc Nhiem Dao*bc
aFaculty of Chemical Engineering, Industrial University of Ho Chi Minh City, Ho Chi Minh City 700000, Vietnam
bInstitute of Material Science, Vietnam Academy of Science and Technology, 18 Hoang Quoc Viet, Hanoi 100000, Vietnam. E-mail: nguyentrungkien1009@gmail.com; nhiemdn@ims.vast.ac.vn
cGraduate University of Science and Technology, Vietnam Academy of Science and Technology, 18 Hoang Quoc Viet, Hanoi 100000, Vietnam
dVinh University, 182 Le Duan, Vinh City, Nghe An 460000, Vietnam
First published on 22nd April 2024
Abstract
This study attempted to improve the photocatalytic activity of zinc oxide (ZnO) semiconductors in the visible light region by introducing the co-doping of carbon (C) and tantalum (Ta) to ZnO (ZTC) using a simple hydrothermal method with the respective precursors. The obtained uniform ZTC nanoparticles with an average crystal size of 29.30 nm (according to Scherrer's equation) revealed a redshift with a decrease in bandgap (Eg) from 3.04 eV to 2.88 eV, allowing the obtained photocatalyst to absorb the energy of the visible light for photocatalysis. Furthermore, the Zn 2p and Ta 4f core level spectra confirmed the presence of Zn2+ and Ta5+ in the ZTC sample. In addition, the infrared spectra identified hydrogen-related defects (HRDs), while the O 1s spectra indicated the existence of oxygen vacancies (VO). Electrochemical tests revealed improvement in the electron conductivity and charge separation of the obtained materials. To follow, the photocatalytic performance assessment was conducted by varying the C/Zn2+ ratios (5, 10, and 15 mol%) in ZTC samples, the initial RhB concentration (7, 15, and 30 ppm), and the pH of the RhB solution (3.0–10.0). The photodegradation on ZTC samples showed the most effectiveness for a 7 ppm RhB solution with a C/Zn2+ ratio of 10 mol% in the slightly alkaline medium (pH 9.0). Additionally, ZTC also exhibited commendable durability after being reused several times. The nature of RhB photodegradation was proposed and discussed via a mechanism at the end of this work.
1. Introduction
Advanced oxidation processes (AOPs) have been suggested as an outstanding solution for removing stubborn organic pollutants. AOP is defined as a process that entails the in situ production of extremely powerful chemical oxidants using ozone (O3), hydrogen peroxide (H2O2), Fenton's reagent, UV light, or a catalyst.1 The hydroxyl radicals (˙OH) generated by those reagents possess high oxidative capabilities, enabling them to oxidize persistent organic compounds. AOPs provide various benefits, including a fast degradation rate, significant efficiency for converting organic compounds into environmentally friendly substances, the capability to function under ambient conditions, and mitigation of the toxicity of organic compounds.Photocatalysis, a typical technique of AOPs, involves the photochemical reactions occurring on the surface of one or some semiconductors. The reactions are initiated by the light striking onto the catalyst surface with the photogeneration of electron/hole pairs. Then, a combination of the oxidation from photogenerated holes and the reduction from photogenerated electrons takes place. Both processes must be balanced precisely to avoid altering the characteristics of photocatalysts. So far, several semiconductors (TiO2, ZnO, SnO2, CdS, or MoS2) have been used as photocatalysts for wastewater treatment.2–6 Among those semiconductors, TiO2 and its modifications have attracted most studies in the past decades since TiO2 can possess low-cost production, good chemical stability, and the capability to deal with various contaminants such as azo dyes, volatile organic compounds, persistent organic pollutants, and so on. However, due to the large bandgap (Eg) of 3.2 eV, the utilization of TiO2 photocatalysts is still restricted to UV light sources, which only account for less than 5% of the overall energy of solar light.7 On the other hand, in photocatalysis applications, ZnO becomes an emerging candidate for removing persistent organic contaminants. Although ZnO has a similar bandgap to TiO2 (about 3.2 eV), it exhibited a higher energy absorption over a significant portion of the solar spectrum than TiO2. In addition, ZnO also shows a strong oxidation ability, good stability and durability, environmental friendliness, and a high free-exciton binding energy, which allows an excitonic emission process to occur above room temperature.8
Additionally, in order to extend the practical uses of ZnO, further modifications are necessary to ensure its compatibility with photocatalysis under visible light and maximize the capabilities of harvesting solar energy. Several methods to enhance the photocatalytic activity of semiconductors have been developed, including doping appropriate elements into the original structure, establishing the composites of some semiconductors with different energy levels and bandgaps, and incorporating additional adsorbents.9–11 In numerous studies, doping with other elements is a common choice for augmenting the photocatalytic activity of semiconductors.12,13 The doped particles, especially the metal nanoparticles, can absorb and retain light energy in the form of high-energy electrons.14 These electrons can later transfer the energy to adjacent particles to facilitate photocatalysis. It has also been reported that the dopants alter the bandgap of semiconductors by elevating the potential of the valence band (VB) while leaving the conduction band (CB) unchanged, leading to a reduction in the bandgap of the semiconductor.15 Moreover, doping foreign elements into the parental structure creates a remarkable rise in oxygen vacancies or other interstitials.15–17 The oxygen vacancies can play crucial roles as electron traps to mitigate electron/hole recombination, then transfer those electrons to free oxygen molecules to create superoxide radicals, and improve the electrical conductivity of materials.18
Ta is a metallic dopant that attracts significant attention because of its distinct surface plasmon resonance band, which allows Ta to function as a photosensitizer, enhancing the optical absorption of materials.19 The radii of Ta5+ (0.64 Å), Ta4+ (0.68 Å), and Ta3+ (0.72 Å) ions are similar to the radius of Zn2+ ion (0.74 Å). Therefore, Ta ions have the potential to effectively substitute Zn2+ in the lattice structure. Previously, Karakitsou and Verykois reported that the donor-type dopants such as W6+, Nb5+, and Ta5+ significantly improved hydrogen production through water splitting with TiO2 photocatalyst, whereas the acceptor-type ones like In3+ or Li+ lowered the photocatalytic activities.20 Alim et al. tried to dope 0.1–1.0 at% of Ta to TiO2 to enhance the photodegradation of methylene blue (MB).21 Ta-doped TiO2 possibly narrowed both the direct and indirect bandgap of TiO2 by 0.06–0.10 eV while accelerating the MB degradation rate by about 2–3 times. Rajendran et al. fabricated CdS NPs with different amounts of Ta dopants (3–5 mol%) by the hydrothermal method in order to degrade organic dyes under visible light irradiation.22 The Ta-doped CdS samples exhibited a shift toward longer wavelength, a better ability to absorb the visible light spectra (the bandgap decreased from 2.37 to 2.27 eV), a slower rate of photogenerated hole/electron pair recombination, and a 2.4-fold higher MB photodegradation rate as compared to the non-doped ones. Tao et al. achieved the Ta-doped BiOCl visible-light-driven photocatalyst for Rhodamine B (RhB) degradation.23 The Ta-doped sample demonstrated a slight reduction in bandgap from 3.46 eV to 3.39 eV with a better photocurrent response (PCR) and a significant increase of 27 times higher in RhB degradation rate than the pure BiOCl sample.
While Ta dopants have been found to effectively promote the photocatalytic activity of several semiconductors, the current literature on the modifications of ZnO with Ta (TaZ) remains scarce. Kong et al. investigated the photocatalytic properties of the TaZ samples by controlling the Ta content from 0 to 4 mol%.24 The authors asserted that the enhancement of MB photodegradation on doped catalysts resulted from the presence of defects (oxygen vacancies and zinc vacancies), which narrowed the energy gap between VB and CB of ZnO. TaZ materials prepared by a modified Pechini-type method were also employed for the antibacterial research of Guo et al.25 Based on the antibacterial activity tests, the incorporation of Ta5+ ions into ZnO greatly enhanced the ability of ZnO NPs to inhibit bacterial growth in the absence of light and demonstrated a much stronger ability in the bactericidal efficacy when exposed to visible light. In one of the recent publications of our group, the effect of temperature on the preparation of Ta-doped ZnO materials by hydrothermal for MB photodegradation was examined.26 The samples prepared at 150 °C (TaZ150) displayed the most redshift of the optical absorption edge, with the bandgap narrowed from 3.07 eV (ZnO) to 2.92 eV, enabling visible-light absorbability. TaZ150 also exhibited superior performance in reducing the electron/hole recombination rate and improving the MB degradation efficiency as compared to TaZ and ZnO samples.
Additionally, not only one-element doping but also co-doping obviously benefits the photocatalytic activities of semiconductors. Recent approaches have suggested that the donor–acceptor pairs (transitional metals–non-metallic dopants) possibly promote the performance of TiO2 photoanodes for water splitting by decreasing the charged defects, suppressing charge recombinations, and improving the light absorptivity of materials as well as the solubility of the dopants.27–29 Joseph et al.30 and He et al.31 developed the doping of Ga–N and Al–N in ZnO film, which effectively derived the absorption to visible-light region and lowered the bandgap of ZnO. To follow, Obata et al. studied the co-doping of Ta, N to TiO2 (TaNTi) thin film by applying the donor–acceptor interaction for the photo-decomposition of oleic acid.32 The co-doping of Ta and N atoms indicated a positive shift of the N 2p band and generated more powerful oxidative holes under visible light irradiation, resulting in an enhancement in the photocatalytic performance of TaNTi as compared to N single doping. A previous co-doping of Ce and C in our laboratory also exhibited the capability of promoting MB photodegradation on ZnO nanoparticles.33 The incorporation of Ce and C into ZnO resulted in an extended light absorption range to include visible light and an increase in MB photodegradation rate by 3.5 times compared to undoped ZnO.
Based on the fundamental knowledge obtained from previous studies, this study developed the preparation of ZTC nanoparticles using a simple hydrothermal method. The precursors used were zinc acetate (Zn(CH3COO)2), tantalum(V) chloride (TaCl5), and various amounts of polyvinyl alcohol (PVA) to control the content of C-dopants. Then, the ZTC samples underwent comprehensive characterization and were used for the photodegradation of RhB. Subsequently, a thorough evaluation will be conducted to assess the stability and recyclability of obtained ZTC samples. Ultimately, the process by which RhB undergoes photodegradation on ZTC materials will be elucidated.
2. Experimental
2.1. Chemicals
The chemicals, including Zn(CH3COO)2·2H2O, TaCl5, C2H5OH, NaOH, and HCl, were obtained from Shanghai Aladdin Bio-Chem Technology Co., Ltd (China). PVA (M = 145![[thin space (1/6-em)]](https://www.rsc.org/images/entities/char_2009.gif) 000 g mol−1, 99%) and RhB was purchased from Sigma-Aldrich. All reagents were at analytic grade and used without any further purification.
000 g mol−1, 99%) and RhB was purchased from Sigma-Aldrich. All reagents were at analytic grade and used without any further purification.
2.2. Materials preparation
ZTC materials were synthesized by the hydrothermal method from Zn(CH3COO)2, TaCl5, and PVA precursors. The content of doped Ta5+ was adjusted to 2 mol% of Zn2+ according to the previous study,26 while the proportions of C dopants were controlled at 5, 10, and 15 mol% of Zn2+ by the corresponding amount of PVA and denoted as ZTC5, ZTC10, and ZTC15, respectively. Initially, 1.647 g of Zn(CH3COO)2·2H2O and 0.054 g of TaCl5 were completely dissolved in 120 mL of C2H5OH (beaker 1). Another solution was prepared by dissolving 0.017, 0.033, or 0.050 g of PVA in 30 mL of distilled water (beaker 2). Subsequently, the transparent solutions in beaker 1 and beaker 2 were mixed, followed by a dropwise addition of a solution containing 2.4 g NaOH in 50 mL C2H5OH. The mixture was kept stirring for 1 h on a magnetic stirrer. The obtained solution was transferred to a 200 mL Teflon-lined autoclave and heated in an oven at 150 °C for 24 h. Later, the autoclave was cooled to ambient temperature, and the resultant product was isolated by centrifugation and then washed with distilled water and ethanol several times. Finally, the obtained ZTC sample was dried at 80 °C for 8 h. ZnO and TaZ samples were also prepared by a similar procedure with the corresponding precursors.2.3. Materials characterization
The crystal structure and phase purity of the prepared samples were assessed using X-ray diffraction (XRD) on a D8 Advance X-ray diffractometer with Cu Kα provided by Bruker (Germany). The average radius of the single crystal was calculated using Scherrer's equation (eqn (1)) based on the XRD results.
 | (1) |
The morphology of the catalysts was examined using scanning electron microscopy (SEM) with the S-4800 Hitachi instrument (Japan) at an operating voltage of 10 kV, as well as high-resolution transmission electron microscopy (HR-TEM) with S-4800 NIHE. The elemental composition of ZTC was determined using energy-dispersive X-ray spectroscopy (EDX) in conjunction with the SEM apparatus. The FTIR spectra of the synthesized materials were obtained at room temperature using a Shimadzu FTIR spectrometer, covering the range of 400–4000 cm−1. The samples were uniformly blended with KBr powder and compressed into pellets for FTIR analysis, and the obtained data was adjusted using the KBr background reference. The oxidation state of the elements present in each catalyst was determined exclusively using X-ray photoelectron spectroscopy (XPS) with an ESCA-3400 instrument (Shimadzu) that utilized Mg Kα radiation (1253.6 eV, 10 kV, 20 mA). The XPS spectra's binding energies were calibrated using the Au 4f7/2 peak of gold powder, which was measured to be 84.0 eV. The XPS peak deconvolution employed Shirley's background and Gaussian–Lorentzian functions for fitting. The samples' bandgap and optical properties were examined through UV-Vis diffuse reflectance spectra (DRS) using a JASCO V-500 UV-Vis spectrophotometer. The BioLogic SP-240 workstation with conventional three-electrode cells was used to perform the photocurrent response (PCR) and electrochemical impedance spectroscopy (EIS) on ZTC materials. The photocatalysts were applied onto a glassy carbon electrode with a surface area of 1 cm × 1 cm as the working electrode. The reference electrode, counter electrode, and electrolyte used in the experiment were an Ag/AgCl (saturated KCl), a Pt wire, and a Na2SO4 0.5 M aqueous solution, respectively.
2.4. Photocatalytic performance investigation
The RhB photodegradation was carried out using a 450 W low-pressure mercury vapor lamp provided by ACE Glass Inc (U.S.A), which was positioned in a 500 mL Pyrex immersion well. The light intensity on the exterior arc surface of the lamp and the well is 1.04 and 0.37 W cm−2, respectively. A circulating water stream was utilized to envelop the photoreactor, thereby ensuring the temperature stability of the reaction system. Before light exposure, a volume of 250 mL of the working mixture was continuously agitated in darkness using a magnetic stirrer for 12 h to allow the adsorption/desorption of RhB on the photocatalysts to reach a state of equilibrium. The content of C-dopant in materials (5, 10, and 15 mol%), the pH of mixtures (from 4.0 to 10.0), and the RhB initial concentration (7.0, 15.0, and 30.0 ppm) were varied for evaluation. The reactions were conducted at ambient temperature under atmospheric pressure. After a specific duration (depending on each set of experiments), 1 mL of reacted solution was extracted from the reactor. The extracted solution was centrifugated to isolate the catalyst residues. Subsequently, the concentration of RhB was determined by analyzing the samples using a UV-Vis absorption spectrometer.The degradation efficiency of ZTC at time t is calculated using the following equation (eqn (2)).
 | (2) |
The apparent degradation rate kapp is evaluated by a pseudo-first-order kinetics model as follows (eqn (3)).
 | (3) |
3. Results and discussion
3.1. Materials characterization of ZTC
Fig. 1A shows the XRD patterns of the prepared ZnO, TaZ, and ZTC samples. All samples generally exhibited the characteristic patterns of hexagonal wurtzite ZnO crystal structure.34 According to JCPDS standard 00-036-1454, the sharp peaks were attributed to the (100), (002), (101), (102), (110), (103), (200), (112), and (201) lattice planes. Since the TaZ sample was prepared with optimal preparation conditions mentioned in the previous study,26 the XRD patterns of the TaZ sample displayed analogously to those of the ZnO sample without the peaks of impurities. On the other hand, with the same preparation conditions, out of the presence of major diffraction peaks of the hexagonal wurtzite ZnO structure with a significant increase in peak intensities, the additional peaks of impurities were presented parallelly. The star marks represented the diffraction patterns of Ta2O5, whereas the triangle ones demonstrated those of ZnTa2O6.35 To clarify the success of doping foreign elements (Ta, C), a magnified image of XRD patterns in the 2θ range between 30° and 38° was also illustrated (Fig. 1B). While TaZ showed a slight negative shift in diffraction angles, ZTC displayed an insignificant positive one, which both confirmed the presence of doped-Ta and C atoms in the lattice structure of ZnO. Applying Scherrer's equation, the calculated average crystal size of ZnO, TaZ, and ZTC was 28.56, 19.38, and 29.30 nm.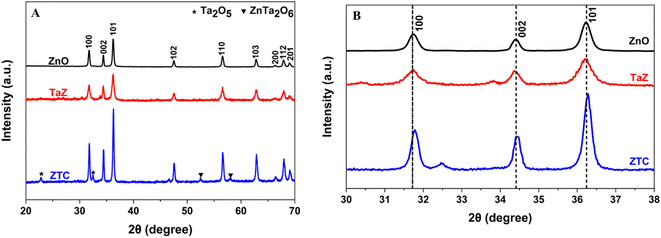 | ||
| Fig. 1 XRD patterns of (A) prepared TaZ and ZTC samples with (B) a magnified view in the 2θ range between 30° and 38°. | ||
Both the SEM and TEM images describe the uniform formation of ellipsoidal ZTC nanoparticles with a size of less than 100 nm (Fig. 2A and B). The HRTEM image clearly shows the distinctive lattice fringes with a d value of 0.249 nm (Fig. 2C). This spacing corresponds to the (101) interplanar spacing of ZTC NPs.36 In addition, the elemental composition analysis results for the ZTC sample are presented in Fig. 2D. The EDX spectrum demonstrates the presence of four main elements, including C, Ta, Zn, and O, without the existence of any other extraneous elements. The elemental analysis revealed that the proportion of Ta and C dopants in the ZnO lattice structure on the sample surface was approximately 1.5 mol% and 9.6 mol%, respectively (inset table of Fig. 2D). This is consistent with the initial ratio of Ta5+/Zn2+ and C/Zn2+ precursors, which was 2.0 mol% and 10.0 mol%. Moreover, the uniform distribution of C, Ta, Zn, and O was exhibited on the elemental mapping (Fig. 2E–I).
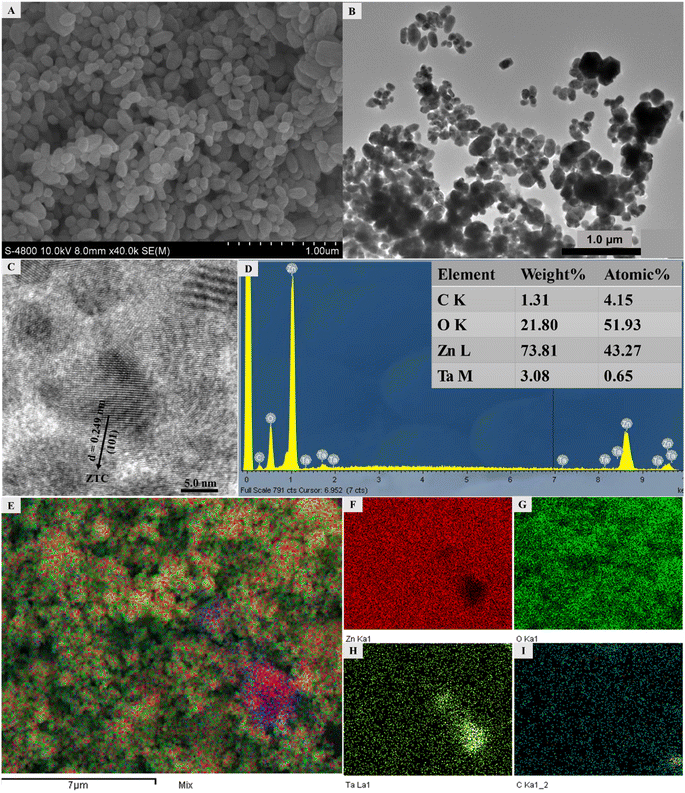 | ||
| Fig. 2 (A) SEM, (B) TEM, (C) HR-TEM images, (D) EDX spectra (inset table: elemental composition), and (E–I) elemental mapping of the ZTC sample. | ||
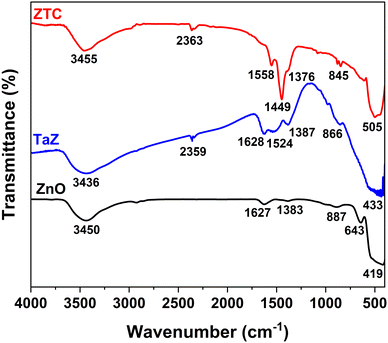
Fig. 3 displays the FTIR spectra of the prepared ZnO, TaZ, and ZTC. All samples exhibit peaks near 3450 cm−1 and 1630 cm−1, which are assigned to the stretching and vibration of the OH group of physisorbed water molecules on the material surface. The strong peaks below 800 cm−1 are attributed to the formation of metal–oxygen bonds, including Zn–O and Zn–O–Ta bonds, with a slight shift toward higher wavenumber when Ta and C atoms were doped into the ZnO structure. The absorption peaks near 2360 cm−1 in the spectra of ZTC and TaZ samples are ascribed to the stretching vibration mode of the strong Ta![[double bond, length as m-dash]](https://www.rsc.org/images/entities/char_e001.gif) O band.24,37 This confirms the successful doping of Ta atoms to the ZnO structure. Furthermore, the presence of hydrogen-related defects (HRDs) in TaZ and ZTC materials due to the hydrothermal process was confirmed by the detection of absorption peaks near 1380 cm−1, which could potentially affect their photocatalytic activity.24,38,39 While the FTIR spectrum of the ZnO sample hardly showed the signal of HRDs, the intensity of HRD peak significantly increased upon the doping of Ta but showed a decrease (compared to TaZ) when both Ta and C were co-doped into ZnO structures. In addition, the other peaks in the range of 800 and 1700 cm−1 can be attributed to the presence of C–C and C–O bonds originating from either C-dopants or PVA residuals.
O band.24,37 This confirms the successful doping of Ta atoms to the ZnO structure. Furthermore, the presence of hydrogen-related defects (HRDs) in TaZ and ZTC materials due to the hydrothermal process was confirmed by the detection of absorption peaks near 1380 cm−1, which could potentially affect their photocatalytic activity.24,38,39 While the FTIR spectrum of the ZnO sample hardly showed the signal of HRDs, the intensity of HRD peak significantly increased upon the doping of Ta but showed a decrease (compared to TaZ) when both Ta and C were co-doped into ZnO structures. In addition, the other peaks in the range of 800 and 1700 cm−1 can be attributed to the presence of C–C and C–O bonds originating from either C-dopants or PVA residuals.
The XPS technique provided a comprehensive analysis of the oxidation states of elements present on the surface of ZTC materials. As shown in Fig. 4, all binding energy peaks were associated with the core level spectra of Zn 2p, Ta 4f, O 1s, and C 1s orbitals. Zn 2p orbitals exhibit two distinct peaks at 1024.3 and 1047.4 eV, representing the energy levels of Zn 2p3/2 and Zn 2p1/2, respectively. The difference in binding energy (BE) distance between Zn 2p3/2, and Zn 2p1/2 was 23.1 eV, suggesting that Zn existed as Zn2+ in the ZTC sample.40 The deconvolution of Ta 4f core level spectra displayed two peaks centered at 28.6 and 30.5 eV, which can be assigned to 4f5/2 and 4f7/2 core level spectra of Ta5+. The O 1s profile was a combination of three different kinds of O species, as described in Fig. 4C. The peak observed at 532.9 eV is ascribed to Zn–O bonds in the hexagonal wurtzite structure of ZnO, whereas the peak at 534.3 eV belongs to Zn–O–C bonds or oxygen vacancies (VO) within the ZnO matrix.41 According to previous studies,16,17,41 with a high amount of VO, it was expected that the visible light absorption as well as the contaminant adsorption would be significantly improved, which later contributed to the enhancement in the photocatalytic activity of ZnO. The highest BE of O 1s is assigned to the chemisorbed adsorbed oxygen, specifically caused by the presence of surface adsorbed hydroxyl groups, H2O molecules, or PVA residues.24,42 The observed shift toward higher BE for both O 1s and Zn 2p compared to those of ZnO in previous studies suggests that the electron transfer occurs from Zn2+ to Ta5+ with the formation of Zn–O–Ta bonds in the sample.36 Furthermore, the C 1s core level spectra can be divided into four component peaks with an additional satellite peak centered at 279.3 eV. The peaks at 286.9, 287.7, 288.9, and 290.0 eV are associated with the Zn–C bonds, the C–C or C![[double bond, length as m-dash]](https://www.rsc.org/images/entities/char_e001.gif) C bonds, the Zn–O–C bonds, and C–O bonds (including C–O and C
C bonds, the Zn–O–C bonds, and C–O bonds (including C–O and C![[double bond, length as m-dash]](https://www.rsc.org/images/entities/char_e001.gif) O bonds), respectively.40,42 Based on the principle method and handbook of the XPS instrument, the calculated proportion of Ta5+/Zn2+ in ZTC was about 2.2 mol%, which was approximate to the Ta5+/Zn2+ feeding of 2.0 mol%.
O bonds), respectively.40,42 Based on the principle method and handbook of the XPS instrument, the calculated proportion of Ta5+/Zn2+ in ZTC was about 2.2 mol%, which was approximate to the Ta5+/Zn2+ feeding of 2.0 mol%.
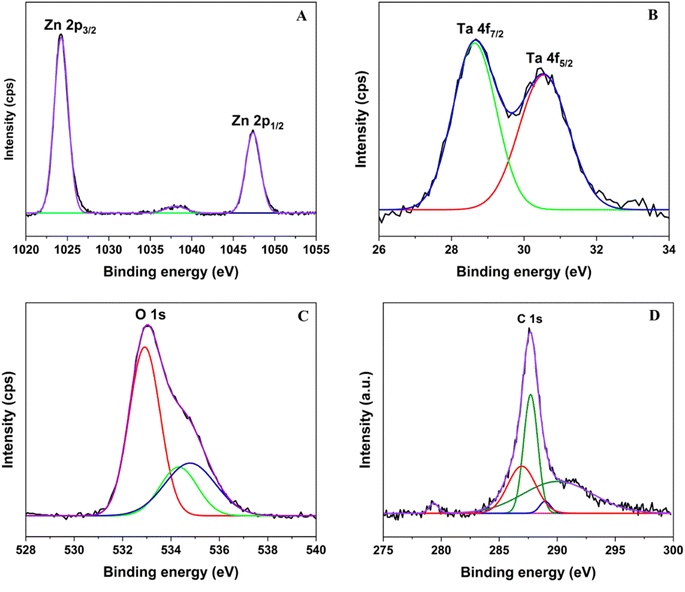 | ||
| Fig. 4 The corresponding (A) Zn 2p, (B) Ta 4f, (C) O 1s, and (D) C 1s core level spectra in ZTC sample recorded by XPS. | ||
The optical properties of the ZnO, TaZ, and ZTC samples were examined by the UV-DRS technique (Fig. 5). All UV-Vis spectra of examined materials demonstrated excellent absorption in the UV light range but limited absorption in the visible light range. By doping Ta or co-doping C and Ta into the ZnO lattice, the bandgap absorption edge experienced a significant shift toward the visible light region. The Kubelka–Munk rule was employed to calculate the direct bandgap energy (Eg) of ZnO, TaZ, and ZTC materials, which had the respective values of 3.04, 2.90, and 2.88 eV. The results suggest that both Ta and C contributed to narrowing the Eg of ZnO, leading to an enhancement in the photoactivity of ZnO in the visible region.
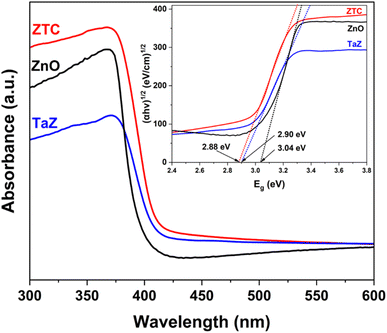 | ||
| Fig. 5 UV-Vis diffuse reflectance spectra of ZnO, TaZ, and ZTC samples (inset: Tauc plots derived from UV-Vis DRS). | ||
Finally, the transient photocurrent response and EIS measurement were conducted to investigate the photoelectron conductivity and the enhancement of electron–hole separation. Fig. 6A demonstrates the photocurrent response caused by the photocatalysts when exposed to visible light. Upon the activation of the light, the photocurrent rapidly achieved its peak value before reaching a steady state. The photocurrent of the prepared materials exhibited an ascending trend in order of ZnO < TaZ < ZTC. Then, the photocurrent immediately drops to ground value upon the light source being switched off. The behavior of the photocurrent curves remained unchanged after multiple switching periods. The rise in the photocurrent generally implies a better separation efficiency of photo-generated charge carriers in the ZTC sample than in the TaZ and ZnO samples. Furthermore, the Nyquist plots showed a decrease in the arc radius of the observed curves in the following order: ZnO > TaZ > ZTC. The reduction in the arc radius of ZTC also demonstrated enhanced material conductivity and decreased electron transfer interface resistance when both Ta and C were doped into the ZnO matrix. Therefore, the results of the EIS study also verified the improved effectiveness of charge separation in the ZTC sample. Hence, based on the material analyses, it is anticipated that the photocatalytic activity of ZnO will be promoted with the C and Ta dopants.
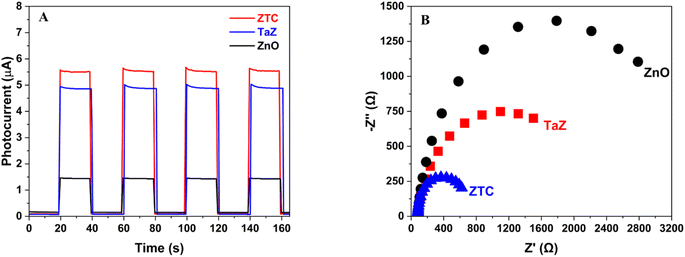 | ||
| Fig. 6 (A) Transient photocurrent response and (B) a Nyquist plots derived from EIS measurement of ZnO, TaZ, and ZTC samples. | ||
3.2. Photocatalytic performance of ZTC
In this part, to elucidate the photocatalytic activity of ZTC materials, a series of RhB degradations, as an organic contaminant model, were performed. The percentages of doped C in ZTC, the initial RhB concentration, and the pH of the working solution, were varied to investigate their influences and make comparisons.The synthesis of ZTC materials involved the modification of the PVA precursor percentage to obtain samples with various percentages of C-dopants. Fig. 7A reported the photodegradation efficiency of ZTC samples with the doped-C proportions of 5% (ZTC5), 10% (ZTC10), and 15% (ZTC15). It can be obviously seen that TaZ and ZTC materials significantly enhance RhB degradation efficiency (DE), from 66.6% of ZnO materials to more than 87.1% after being irradiated for 180 min. The RhB DE of tested materials exhibited an ascending trend, with ZnO showing the lowest value at 66.0%, followed by ZTC5 at 87.1%, TaZ at 90.9%, ZTC15 at 94.9%, and ZTC10 at the highest value of 97.8%. Meanwhile, the kapp of samples obtained from Fig. 7B also showed an increase in the order of ZnO (0.0060 min−1) < ZTC5 (0.0119 min−1) < TaZ (0.0134 min−1) < ZTC15 (0.0158 min−1) < ZTC10 (0.0215 min−1). The results indicated that ZTC samples containing 10% C-dopants demonstrated the highest level of catalytic efficiency. Subsequently, further experiments will focus on using ZTC10 for RhB photodegradation.
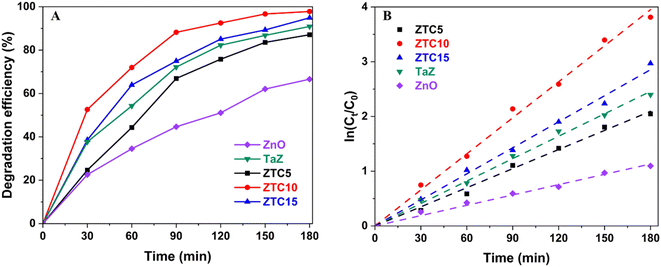 | ||
| Fig. 7 Influence of the doped-C percentage in ZTC materials on (A) RhB photodegradation efficiency and (B) degradation kinetics. | ||
The effects of initial RhB concentration on the photocatalytic performance of ZTC were also studied (Fig. 8A). After 120 min, most RhB (99.3%) was remediated when the initial concentration was 7 ppm. However, only 92.5% and 76.3% of RhB were removed from the solution as the initial RhB concentration increased to 15 ppm and 30 ppm, respectively. By applying the pseudo-first-order kinetic model to the appropriate concentration, it demonstrated that the higher the initial RhB concentration was, the lower the kapp was. As the initial RhB concentration increased from 7 to 30 ppm, the kapp considerably decreased from 0.0405 min−1 to 0.0122 min−1. This behavior can be explained by Beers' law and catalyst absorption capacity (qmax). Since the qmax value of ZTC is constant, an excess of RhB molecules that have not been absorbed on the catalyst surface and existed in the solution will prevent light transmission in the solution or hinder the active sites of the catalyst. The higher the concentration is, the lesser the amount of photons that contact with ZTC is. Consequently, a reduced portion of photogenerated charges can be produced, resulting in a decrease in the efficiency of photocatalytic activity.
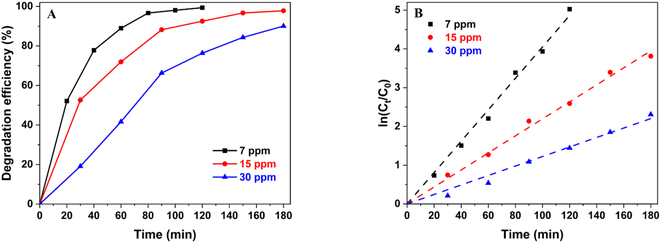 | ||
| Fig. 8 Influence of initial RhB concentration on (A) RhB photodegradation efficiency and (B) degradation kinetics. | ||
pH plays a crucial role in the photodegradation of organic dyes, especially RhB, since it controls the interaction between the catalyst and targeted substrates, and the presence of active charges in the solution.36 Fig. 9 illustrates the impact of pH on the RhB DE with the corresponding calculated kapp. While ZTC exhibited an outstanding catalytic performance in the slightly alkaline media (pH 8–10), it also demonstrated lesser activity when the solution became more acidic (pH < 7). In the acidic media, the DE curves showed a similar behavior with no significant change when the pH increased. In this pH range, the RhB photodegradation occurred more slowly than in other media and only reached the DE of about 85% to 90% after 180 min. The calculated kapp also gradually increased from 0.0100 min−1 to 0.0132 min−1 when pH increased from 4.0 to 6.0. At a neutral media (pH 7.0), the DE exhibited the first remarkable increase since about 90% of RhB was removed from the solution after the working solution was exposed to the light source for 120 min. The notable increase in kapp to 0.0177 min−1 confirmed the enhancement in photocatalytic performance at this pH. The RhB DE continuously improved significantly as the media became more alkaline. The photocatalytic activity of ZTC materials for RhB removals reached the best performance at pH 9.0 before slightly decreasing at pH 10.0. The DE values took only 60 min to pass 90%, and most RhB was remediated after 120 min. The kapp at pH 9.0 (0.1224 min−1) also demonstrated an impressive boost by 7 and 12 times compared to those at the neutral media (pH 7.0) and the acidic media (pH 4.0), respectively.
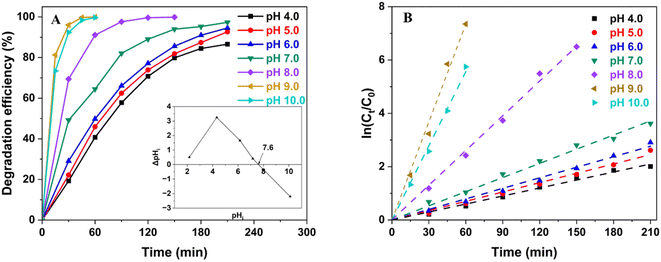 | ||
| Fig. 9 Influence of pH on (A) RhB photodegradation efficiency (inset figure: determination of the pHz of ZTC) and (B) degradation kinetics. | ||
To explain, the isoelectric point (pHz) of ZTC (pHz, ZTC) was determined, and the results were recorded in the inset figure of Fig. 9A. According to previous studies, the remediation/decolorization of RhB molecules occurs via the N-deethylation where N-terminals are absorbed onto the catalyst surface.36 At pH 4.0, which is smaller than the pKa of RhB (pKa, RhB) (about 4.2), both the carboxylic and N-terminals of RhB and ZTC surface are positively charged, resulting in a poor absorbability of RhB on the catalyst surface. At pH from 5.0 to 7.0 (pH < pHz, ZTC), RhB transforms into a zwitterionic form where the carboxylic is deprotonated, and both N-terminals and ZTC surfaces are still positively charged. RhB at these pHs can be absorbed onto ZTC via carboxylic terminals. Nonetheless, the decolorization occurred more favorably via N-terminals; therefore, the photodegradation shows no significant acceleration. However, when the media becomes more alkaline (pH > pHz, ZTC), the ZTC surface is negatively charged, and the N-terminal can be easier to attach to the catalyst and contact with the photogenerated active radicals on the catalyst surface. Hence, the decolorization and further mineralization can be accelerated. On the other hand, when the medium is more alkaline (pH 10.0), ZnO is more likely to be dissolved, which reduces the overall degradation efficiency of ZTC materials. In addition, the excessive amount of RhB molecules absorbed onto the ZTC surface inhibits the formation of oxygen radicals, which also contributes to less photocatalytic efficiency.43
Finally, the material stability and reusability were examined by repeating the photocatalytic degradation of RhB on a ZTC sample 5 times. The series of experiments were conducted on the ZTC10 sample with an initial RhB concentration of 7 ppm and pH 9.0 (Fig. 10A). All cycles exhibited a superior RhB degradation efficiency after being exposed to the light source for 60 min. There was only a slight change in the RhB DE, from 99.93% in the first cycle to 96.97% in the fifth cycle. The unremarkable loss was possibly due to the unremoved residues hindering the active site and decreasing the surface area of the materials. However, the XRD patterns of ZTC samples before and after the fifth cycle revealed no material crystalline and structure phase alteration (Fig. 10B). This confirmed the good stability and reusability of prepared materials, possibly enhancing the photodegradation of RhB.
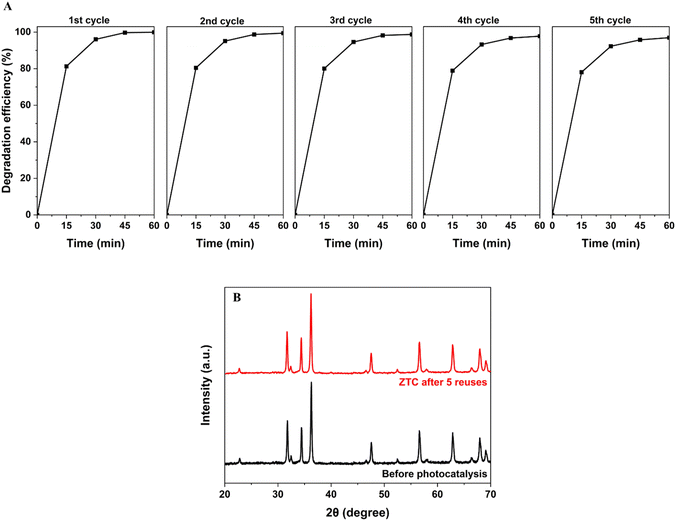 | ||
| Fig. 10 (A) RhB photodegradation efficiency and (B) XRD patterns of ZTC materials after five cycles. | ||
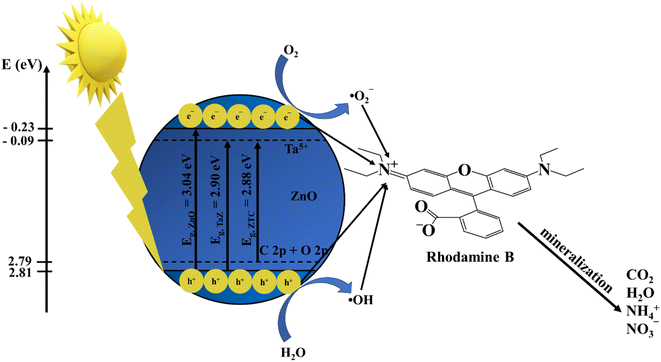
A simple degradation mechanism of RhB under light irradiation was also proposed to clarify the catalytic performance of ZTC (Fig. 11). The position of CBs and VBs can be determined following a previous study by Rajendran et al.44 (eqn (4) and (5)).
| EVB = χ − Ee + 0.5Eg | (4) |
| ECB = EVB − Eg | (5) |
After being struck by the light source, the electron in VB can absorb enough energy to be excited and move to the CB, leaving holes h+ in the VB. At the CB, with a more negative potential than E˙O2−/O2, the excited electrons react with dissolved O2 to generate superoxide radicals ˙O2−7. Meanwhile, since VB energy is more positive than E˙OH/H2O, h+ oxidizes water molecules to produce hydroxyl radical ˙OH.7 The introduction of Ta5+ shifts the energy of CB to a less negative potential, whereas the C 2p and O 2p are possibly hybridized to form a band with less positive energy,45 as described in Fig. 11. Consequently, the co-doping reduces the required energy for an electron to be excited, which accelerates the photocatalytic activity of materials. Finally, the generated active radicals, including h+, e−, ˙O2−, and ˙OH, come into contact with absorbed RhB substrates on the catalyst surface and mineralize them into inorganic products.
4. Conclusion
C,Ta-co-doped ZnO nanoparticles were successfully prepared by a straightforward hydrothermal method from Zn(CH3COO)2, TaCl5, and PVA precursors with the calcination temperature of 150 °C in 24 h. XRD patterns exhibited the ZTC average crystal size of 29.30 nm, whereas SEM and TEM results showed a particle size of less than 100 nm. UV-Vis spectra showed that co-doping resulted in a decrease in the bandgap of ZnO from 3.04 eV to 2.88 eV. Additionally, IR and XPS spectra provided evidence of other defects, specifically HRDs and VO, with Zn and Ta in oxidation states of +2 and +5, respectively. Furthermore, ZTC also exhibited a better ability for electron conductivity and improved charge separation. The photodegradation of RhB with different proportions of C-dopants (5 mol%, 10 mol%, and 15 mol%) showed the best performance of the ZTC sample with C/Zn2+ at 10 mol%. Further investigation also demonstrated that the slightly alkaline media (pH 9) possibly boosted the RhB degradation on ZTC materials. Under evaluated reaction conditions, ZTC demonstrated impressive photodegradation effectiveness and recyclability since the RhB DE only lost a small portion of less than 3% (from 99.93% to 96.97%) after five cycles without faulting the initial structure. Finally, a proposed mechanism for RhB degradation of ZTC photocatalyst was discussed.Data availability
All data and materials generated or analyzed during this study are included in this published article and supplementary information file and are available from the corresponding author upon reasonable request.Author contributions
Thi Viet Ha Luu: project administration, funding acquisition, methodology, investigation; Hong Yen Xuan Nguyen: investigation, software, formal analysis; Quoc Thang Nguyen: conceptualization, methodology; Quang Bac Nguyen: visualization, software, writing – review and editing; Thi Ha Chi Nguyen: resource, investigation; Ngoc Chuc Pham: investigation, formal analysis; Xuan Dung Nguyen: investigation, data curation; Trung Kien Nguyen: formal analysis, software, data curation, writing – original draft; Ngoc Nhiem Dao: validation, supervision, conceptualization, writing – review and editing.Conflicts of interest
The authors declare no conflict of interest.Acknowledgements
This research was supported by the program for Senior Researchers of the Vietnam Academy of Science and Technology under the grant number NVCC04.06/24-25. The authors would like to thank Prof. Hiroshi Inoue and Assoc. Prof. Eiji Higuchi (Department of Applied Chemistry, Graduate School of Engineering, Osaka Metropolitan University) for the allowance of using the XPS equipment in their laboratory during this study.References
- L. Varanasi, E. Coscarelli, M. Khaksari, L. R. Mazzoleni and D. Minakata, Water Res., 2018, 135, 22–30 CrossRef CAS PubMed.
- C. B. Ong, L. Y. Ng and A. W. Mohammad, Renewable Sustainable Energy Rev., 2018, 81, 536–551 CrossRef CAS.
- H. Chen, X. Pu, M. Gu, J. Zhu and L. Cheng, Ceram. Int., 2016, 42, 17717–17722 CrossRef CAS.
- X. Liu, M. Sayed, C. Bie, B. Cheng, B. Hu, J. Yu and L. Zhang, J. Mater., 2021, 7, 419–439 Search PubMed.
- P. Xing, P. Chen, Z. Chen, X. Hu, H. Lin, Y. Wu, L. Zhao and Y. He, ACS Sustain. Chem. Eng., 2018, 6, 14866–14879 CrossRef CAS.
- M. Samadi, M. Zirak, A. Naseri, E. Khorashadizade and A. Z. Moshfegh, Thin Solid Films, 2016, 605, 2–19 CrossRef CAS.
- W. H. Koppenol, D. M. Stanbury and P. L. Bounds, Free Radical Biol. Med., 2010, 49, 317–322 CrossRef CAS PubMed.
- L. Wang and N. C. Giles, J. Appl. Phys., 2003, 94, 973–978 CrossRef CAS.
- M. A. Mohd Adnan, N. M. Julkapli and S. B. Abd Hamid, Rev. Inorg. Chem., 2016, 36, 77–104 CAS.
- K. Qi and J. Yu, in Interface Science and Technology, Elsevier, 2020, vol. 31, pp. 265–284 Search PubMed.
- P. Raizada, A. Sudhaik and P. Singh, Mater. Sci. Energy Technol., 2019, 2, 509–525 Search PubMed.
- H. Liu, K. Du and H. Sun, Water, Air, Soil Pollut., 2024, 235, 111 CrossRef CAS.
- H. Liu, H. Li, K. Du and H. Xu, New J. Chem., 2022, 46, 14867–14878 RSC.
- M. Fang, X. Tan, Z. Liu, B. Hu and X. Wang, Research, 2021, 2021 DOI:10.34133/2021/9794329.
- A. Samokhvalov, Renewable Sustainable Energy Rev., 2017, 72, 981–1000 CrossRef CAS.
- G. Li, C. Dong, G. Sun, M. Li, X. Cao, L. Zhou, T. Chen and F. Yang, ACS Appl. Nano Mater., 2022, 5, 16178–16187 CrossRef CAS.
- J. Lei, H. Liu, C. Yuan, Q. Chen, J. A. Liu, F. Wen, X. Jiang, W. Deng, X. Cui, T. Duan, W. Zhu and R. He, Chem. Eng. J., 2021, 416, 129164 CrossRef CAS.
- K. Ye, K. Li, Y. Lu, Z. Guo, N. Ni, H. Liu, Y. Huang, H. Ji and P. Wang, TrAC, Trends Anal. Chem., 2019, 116, 102–108 CrossRef CAS.
- N. S. Vayghan and B. Eftekharinia, Plasmonics, 2022, 17, 2473–2481 CrossRef CAS.
- K. E. Karakitsou and X. E. Verykios, J. Phys. Chem., 1993, 97, 1184–1189 CrossRef CAS.
- M. A. Alim, T. Bak, A. J. Atanacio, M. Ionescu, B. Kennedy, W. S. Price, J. Du Plessis, M. Pourmahdavi, M. Zhou, A. Torres and J. Nowotny, Ionics, 2017, 23, 3517–3531 CrossRef CAS.
- R. Rajendran, K. Varadharajan and V. Jayaraman, Colloids Surf., A, 2019, 580, 123688 CrossRef CAS.
- S. Tao, S. Sun, T. Zhao, J. Cui, M. Yang, X. Yu, Q. Yang, X. Zhang and S. Liang, Appl. Surf. Sci., 2021, 543, 148798 CrossRef CAS.
- J. Z. Kong, A. D. Li, H. F. Zhai, Y. P. Gong, H. Li and D. Wu, J. Solid State Chem., 2009, 182, 2061–2067 CrossRef CAS.
- B. L. Guo, P. Han, L. C. Guo, Y. Q. Cao, A. D. Li, J. Z. Kong, H. F. Zhai and D. Wu, Nanoscale Res. Lett., 2015, 10, 336 CrossRef PubMed.
- T. V. Ha Luu, N. N. Dao, H. A. Le Pham, Q. B. Nguyen, V. C. Nguyen and P. H. Dang, RSC Adv., 2023, 13, 5208–5218 RSC.
- I. S. Cho, C. H. Lee, Y. Feng, M. Logar, P. M. Rao, L. Cai, D. R. Kim, R. Sinclair and X. Zheng, Nat. Commun., 2013, 4, 1723 CrossRef PubMed.
- X. Ma, Y. Wu, Y. Lu, J. Xu, Y. Wang and Y. Zhu, J. Phys. Chem. C, 2011, 115, 16963–16969 CrossRef CAS.
- W. J. Yin, H. Tang, S. H. Wei, M. M. Al-Jassim, J. Turner and Y. Yan, Phys. Rev. B: Condens. Matter Mater. Phys., 2010, 82, 045106 CrossRef.
- M. Joseph, H. Tabata and T. Kawai, Japanese Journal of Applied Physics: Letters. Part 2, 1999, vol. 38, pp. L1205–L1207 Search PubMed.
- H. P. He, F. Zhuge, Z. Z. Ye, L. P. Zhu, F. Z. Wang, B. H. Zhao and J. Y. Huang, J. Appl. Phys., 2006, 99(2) DOI:10.1063/1.2161419.
- K. Obata, H. Irie and K. Hashimoto, Chem. Phys., 2007, 339, 124–132 CrossRef CAS.
- L. T. V. Ha, L. M. Dai, D. N. Nhiem and N. Van Cuong, J. Electron. Mater., 2016, 45, 4215–4220 CrossRef CAS.
- O. A. Zelekew, P. Asefa, F. K. Sabir and A. D. Duma, SSRN Electron. J., 2021 DOI:10.2139/ssrn.3807243.
- Y. C. Zhang, B. J. Fu and X. Wang, J. Alloys Compd., 2009, 478, 498–500 CrossRef CAS.
- Z. Gao, Y. Myung, X. Huang, R. Kanjolia, J. Park, R. Mishra and P. Banerjee, Adv. Mater. Interfaces, 2016, 3(21) DOI:10.1002/admi.201600496.
- H. Ono and K. I. Koyanagi, Appl. Phys. Lett., 2000, 77, 1431–1433 CrossRef CAS.
- J. Lin, J. Lin and Y. Zhu, Inorg. Chem., 2007, 46, 8372–8378 CrossRef CAS PubMed.
- Z. Li, T. Yu, Z. Zou and J. Ye, Appl. Phys. Lett., 2006, 88(7) DOI:10.1063/1.2175479.
- A. S. Alshammari, L. Chi, X. Chen, A. Bagabas, D. Kramer, A. Alromaeh and Z. Jiang, RSC Adv., 2015, 5, 27690–27698 RSC.
- X. Deng, G. Zou, B. Tu, M. Hu, W. Zhu, R. He and T. Chen, CrystEngComm, 2022, 24, 6477–6485 RSC.
- X. Zhang, J. Qin, R. Hao, L. Wang, X. Shen, R. Yu, S. Limpanart, M. Ma and R. Liu, J. Phys. Chem. C, 2015, 119, 20544–20554 CrossRef CAS.
- W. Shi, W. X. Fang, J. C. Wang, X. Qiao, B. Wang and X. Guo, Photochem. Photobiol. Sci., 2021, 20, 303–313 CrossRef CAS PubMed.
- S. Rajendran, M. M. Khan, F. Gracia, J. Qin, V. K. Gupta and S. Arumainathan, Sci. Rep., 2016, 6, 1–11 CrossRef PubMed.
- L. C. Chen, Y. G. Lin, Y. K. Hsu, Y. C. Chen, S. Y. Chen and K. H. Chen, Nanoscale, 2012, 4, 6515–6519 RSC.
| This journal is © The Royal Society of Chemistry 2024 |

