 Open Access Article
A direct one-step synthesis of a smart graphene/silica nanocomposite and its application for improving the acid resistance and corrosion resistance properties of waterborne epoxy coatings†
Yanling Jia a and
Ke Zhang
 *bc
*bc
aCollege of Advanced Materials Engineering, Jiaxing Nanhu University, Jiaxing 314000, China
bBeijing Institute of Technology, Beijing 100081, China. E-mail: cr7zhangke_hz@buaa.edu.cn
cYangtze Delta Region Academy of Beijing Institute of Technology, Jiaxing 314000, China
First published on 15th April 2024
Abstract
Graphene has attracted tremendous attention as a potential building block of modern high performance coating systems. Herein, we demonstrate a green method for making reduced oxide graphene (rGO) using the natural product rutin as the reducing agent. The rGO, with residual rutin on the surface to provide surface affinity, is used in the one-step fabrication of a nanocomposite of rGO and silica nanoparticles (SN) with a corrosion inhibitor, benzotriazole (BTA), loaded in situ. The ternary nanocomposite, BTA@SN-rGO, can be easily dispersed in water. It not only has a high inhibitor loading capacity (85.1 μg mg−1) but also can release the inhibitor in a controlled manner triggered by pH. Combining both the extraordinarily good barrier properties and smart nanocontainer features, BTA@SN-rGO was further incorporated into an epoxy latex to assemble an intelligent anticorrosion coating. The effective duration of the coating protection for steel was remarkably prolonged in different media, especially in acidic media. In addition to the barrier capability, smart self-healing of artificial damage to the modified coating films is also shown. Electrochemical impedance spectroscopy (EIS) was applied to monitor the failure process of different kinds of coatings. All the results confirm the synergy of the passive and active functions of the BTA@SN-rGO coating.
1. Introduction
Developments in anti-corrosion materials have promoted economic development and possess a special niche in scientific research.1 Being a 2D layer of sp2-hybridized carbon, graphene has superior properties including good chemical stability,2 excellent barrier properties,3 and low gas–liquid permeability,4 which are all desirable for corrosion protection. In recent years, interesting investigations have been carried out in which graphene is utilized as the modifier in polymer coatings,5 and preliminary achievements have shown the enhanced corrosion resistance of these composite coatings mainly because of the barrier capability of the nano sheets.6 In anti-corrosion work in the literature, to date, most of the graphene utilized is prepared through the chemical reduction of GO. Despite the many preparation approaches that exist, such as mechanical exfoliation, epitaxial growth on a substrate, chemical vapor deposition and chemical reduction of graphene oxide (GO),7 chemical reduction is recognized as the most promising for the preparation at large scale and low cost.8 However, reduced graphene oxide (rGO) products suffer from poor compatibility with mediums and/or the polymer matrix. There is a strong tendency to aggregation and the high conductivity of the products facilitates the formation of electrochemical corrosion circuits which are suspected to accelerate the corrosion in some cases.2 Aiming to solve the problems associated with rGO, studies on new reducing agents as well as new preparation methods have been continually investigated.9–11 Alternatively, the design of nanocomposites has shed new light on rGO in the anticorrosion field. The introduction of other nanomaterials on the surface of rGO can largely modify the interfacial behavior. For example, the dispersing stability of SiO2-coated graphene,12 PS-functional graphene,13 and halloysite nanotubes-modified graphene14 are improved significantly. Moreover, nanocomposites could achieve some additional functions, for instance, SiO2-coated graphene could inhibit the corrosion–promotion activity of graphene15 and halloysite nanotubes-modified graphene could provide loading sites for small corrosion inhibiting molecules.16Among the different kinds of anti-corrosion coatings, waterborne epoxy anticorrosion coatings have widely attracted more and more attention recently due to their unique advantages of excellent mechanical properties, adhesion, resistance to chemicals as well as safety and environmental protection. However, their poor corrosion resistance to acid still has much room for improvement. In recent work, Xu et al. reported the loading of benzotriazole (BTA, a popular inhibitor studied) in SN and their doping into alkyd coatings. The doped coating exhibited effective corrosion protection and self-healing ability.17 In their preparation, cetyltrimethylammonium bromide (CTAB) was the key to their one-step synthesis which served both as the template to tailor the SN structure as well as the solubilizer for the in situ loading of BTA. Noticing that cationic CTAB would possibly trigger the controlled coagulation with anionic colloidal particles, we supposed that it would be possible to integrate the formation of SN, the loading of BTA together with our controlled coagulation with rGO, which would result in a facile preparation of smart BTA@SN-rGO. We envisaged that this system would exhibit synergy with the intelligently released inhibitor triggered by corrosion signals and the intrinsic barrier capability. BTA@SN-rGO is expected to improve corrosion resistance properties, especially the acid resistance of waterborne epoxy anticorrosion coatings. To achieve this aim, the prerequisite we need is a stable graphene dispersion, and dispersed nanosheets with an improved surface for a certain affinity with CTAB.
In this contribution, we here introduce rutin (3′,4′,5,7-tetrahydroxyflavone-3β-D-rutinoside, also known as rutoside or vitamin p), a bio-active flavonoid abundant in plants that can be used as an antioxidant to regulate biological and physiological activities,18 as the reducing agent during the preparation process of rGO. The multiple phenolic hydroxyl groups of rutin mean that it shows considerable activity in the reduction of GO. At the same time, the aromatic structures of the rutin molecules can π–π conjugate with the graphene surface and stabilize the in situ-produced rGO. Importantly, utilizing the additional sites provided by rutin, we fed BTA, CTAB, and tetraethoxysilane (TEOS, the precursor of SN) directly into the dispersion of rutin-rGO for a one-step synthesis of the smart BTA@SN-rGO nanocomposite. CTAB works as the synthesis template, the coagulation regulator and the solubilizer, thus enabling the tailoring of the fabrication process. This approach avoids tedious steps such as the separate synthesis of the SN and the subsequent loading of inhibitors. Moreover, the surface of rutin-rGO allows the tailoring of the size of the SN, which shows a dramatically decreased particle size of about 10 nm and is decorated uniformly on the nanosheets of the rGO. In the production of the BTA@SN-rGO nanocomposite, BTA acts as the inhibitor, rGO exerts the function of the support, and SN serves as the nanocontainer and shows a BTA loading capacity of 85.1 μg mg−1. Moreover, the loaded BTA shows obvious pH-responsive release properties because the disruption of the SN matrix is strongly influenced by the pH value. Another advantage of BTA@SN-rGO is its compatibility as it can be feasibly dispersed in waterborne coatings as a modifier. Meanwhile, a coating film containing BTA@SN-rGO exhibits the longest protection time of a steel substrate in different mediums, especially in an acidic medium. The contribution of the synergy of passive protection and active protection has been illustrated by EIS. The results involved are discussed in detail in the following sections.
2. Materials and methods
2.1. Materials
Tetraethoxysilane (TEOS) was purchased from Fuchen Chemical Reagent Factory in Tianjin. Rutin was purchased from Macklin Biochemical Company in Shanghai. Waterborne curing agent AB-HGF-100 was purchased from Zhejiang Anbang New Material Development Co. Ltd. Details of the other materials used can be found in ref. 15.2.2. Preparation of rutin-rGO(R-rGO)
GO was prepared using the improved Hummer's method.19 The as-synthesized GO can be reduced to become R-rGO by rutin reduction. The following is a detailed description of the R-rGO preparation process. GO powder (400 mg) was dispersed in 200 mL of deionized water under sonication for 2 h. NH3·H2O (2.4 mL) was used to adjust the pH to 12. The mixture was stirred at 35 °C and purged with nitrogen for 15 min before the temperature was elevated. Then rutin (8 g) was added to the mixture and the temperature was elevated to 95 °C. The mixture was stirred at that temperature for 12 h under a nitrogen atmosphere. The as-synthesized R-rGO was dialyzed for two weeks to remove the excess rutin. During this process, the R-rGO solution remained stable. The products were dried at room temperature for two days before the next operation. For simplicity, the rGO used in the nanocomposite in the following part is referred to R-rGO unless otherwise indicated.2.3. Fabrication of BTA@SN-rGO
The fabrication procedure of BTA@SN-rGO is as follows: 10 g of R-rGO powder and 0.42 g of NaOH were added to 711 mL of deionized water (80 °C). 1.5 g of CTAB and 2.5 g of BTA were added into the mixture while stirring. Subsequently, 7 g of TEOS was added slowly. Under vigorous magnetic stirring, the reaction mixture was kept at 80 °C for 2 h. In order to optimize the synthesis, different amounts of R-rGO and BTA were utilized, as shown in Table S1.†Comparatively, we also prepared a binary nanocomposite of SN-rGO via a similar process but without the addition of BTA. Similarly, BTA@SN was prepared without the addition of R-rGO. SN-GO was prepared with the replacement of R-rGO by GO. SN was also prepared without the addition of R-rGO and BTA.
2.4. Loading capacity of BTA and its release
The loading capacity of BTA in BTA@SN-rGO was measured by determining the concentration of BTA in the supernatant via UV-vis spectrophotometer after 3 days of release and drastic sonication. To evaluate the release properties, 20 mg of BTA@SN-rGO powder was dispersed in a 20 mL solution at different pHs regulated by hydrochloric acid or sodium hydroxide. Then we transferred the mixture into a dialysis bag which was subsequently immersed in a 200 mL solution with the corresponding pH value. The dialysis proceeded at 25 °C for 3 days under moderate magnetic stirring. At given time intervals, we took 6.0 mL of solution out and whereafter added 6.0 mL of fresh solution with the corresponding pH value. The release of BTA was monitored by analyzing the concentration of the solution taken out above. The concentration was also measured using UV-vis spectrometry.2.5. Preparation of the anticorrosion coating
The polymer latex in this work is a composite of epoxy and acrylic resin, which was synthesized using a method that we have previously reported. A certain content (0.25 wt% of the polymer) of the modifier (SN, SN-GO, SN-rGO or BTA@SN-rGO) was added into the prepared polymer latex. After stirring for 10 min, the correct amount of waterborne curing agent (AB-HGF-100) was added into the composite latex. The mixture was stirred for another 15 min and then sprayed on the steel substrate. These coatings were all dried at 40 °C until their surfaces were touch dry and subsequently incubated at 90 °C for 2 h until their surfaces were thoroughly dried. The thickness of the dry film was 50 ± 2 μm. For the sake of convenience, the coatings are named according to the name of the modifier used. For example, the polymer coating modified by BTA@SN-rGO is named as the BTA@SN-rGO coating.For the purpose of comparison, the coating using only a blank polymer latex without the addition of modifiers was also prepared and denoted as BPc. Moreover, SN-rGO and unloaded BTA were added to the polymer latex to prepare the BTA + SN-rGO coating. In addition, BTA@SN and R-rGO were added to the polymer latex to form the BTA@SN + rGO coating.
2.6. Characterization
A UV3150 spectrophotometer (Shimaduz, Japan) was used to monitor the reduction process and BTA concentration as well as the Fe3+ concentration. Zeta potential tests in aqueous dispersion were performed using a Malvern Zetasizer Nano ZS. Fourier-transform infrared (FTIR) spectra were obtained on a Bruker Tensor 37 spectrometer. X-ray diffraction studies were conducted on a D/max-2200/PC X-ray diffractometer (Rigaku, Japan) with a Cu Kα X-ray beam. The X-ray photoelectron spectroscopy (XPS) spectra were obtained using an ESCALAB 250 (Thermo Fisher Scientific, USA). The structures of the nano objects were observed using transmission electron microscopy (TEM) on a Hitachi H-800 transmission electron microscope with an accelerating voltage of 100 kV. The scanning electron microscopy (SEM) characterization of the nano objects and the fracture surfaces of the coated steel sheets was carried out on an S4700 (Hitachi, Japan) equipped with energy dispersive X-ray spectroscopy (EDS). Atomic force microscopy (AFM, Asylum Research MFP-3D-SA, USA) operated in the tapping mode was used to characterize the average thickness of the graphene and the topography of the surface coating on the steel specimens. The electrochemical measurements were conducted on a ZAHNER electrochemical workstation (Messsysteme, Germany) under an open circuit potential using a three-electrode electrochemical cell (the reference electrode was the saturated calomel electrode, the counter electrode was a platinum electrode and the working electrode was a coated steel sheet) in a frequency range of 100 kHz to 0.01 Hz. The coated panel has an exposed area of approximately 10 cm2 and the electrolyte solution was a 3.5% NaCl solution. The amplitude of the signal was 10 mV. Polarization curves were obtained in the potential range of −200 mV to +200 mV relative to the open circuit potential at a scan rate of 2 mV s−1. EIS data were analyzed with the ZSimpWin software. The chemical resistance of the coated panels was evaluated in acid and alkali conditions as well using the water immersion method according to ASTM D-1308 and ASTM D-870, respectively. The degrees of adhesion and visual inspection of the blisters and cracks of the coated panels were monitored at every 24 h of immersion. The coating with two artificial crossed scratches of size 10 mm × 0.1 mm was immersed in a 3.5 wt% NaCl solution for the evaluation of the self-healing performance. Meanwhile, the samples were checked at given time intervals and the concentration of ferric ions was measured using UV-vis spectrophotometer.203. Results and discussion
3.1. The synthesis of R-rGO
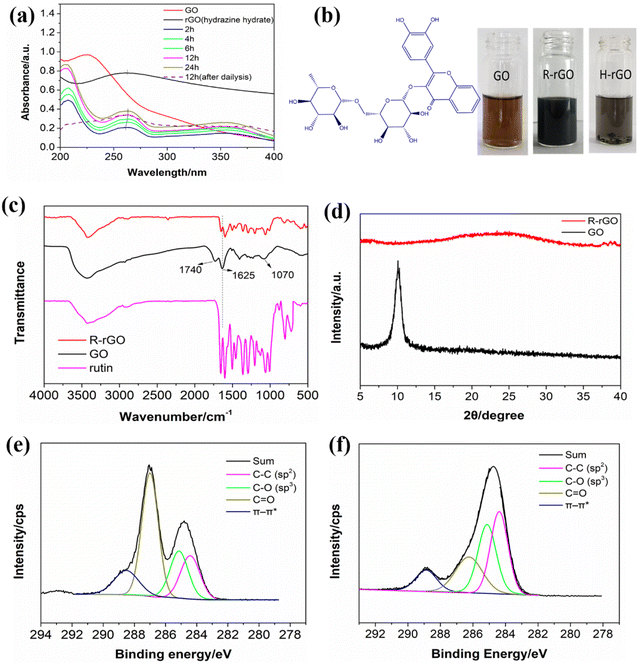
The reduction process was monitored by recording UV-vis spectra at different reaction times, as shown in Fig. 1a. The GO exhibits an absorption peak at 224 nm attributed to the π–π* transition. When the reaction time was 2 h, the observation of the absorption peak at 260 nm indicated the reduction of GO by rutin. As the reaction time increased to 12 h, the absorption peak red-shifted to 262 nm, without showing further movement as the reaction time was further prolonged to 24 h. Moreover, the intensity of the spectra increased as the reaction time was prolonged. Therefore, we set the reaction time at 12 h for R-rGO preparation. It is worth noting that an additional absorption peak at 210 nm was observed in the spectra of R-rGO. We think that the peak should be attributed to the absorption of rutin. After 7 days of dialysis, the absorption peak at 210 nm decreased significantly, as shown in the dashed line in Fig. 1a. However, rutin could not be removed completely owing to the π–π conjugation between the aromatic structures of rutin (shown in Fig. 1b) and graphene.The position of the rGO peak in the UV-vis spectrum can be used to evaluate the performance of the reducing agent.21 The spectrum of the rGO reduced by hydrazine hydrate (H-rGO) is also shown in Fig. 1a. In comparison with the H-rGO peak at 263 nm, the R-rGO peak is at 262 nm. The slight blueshift of the UV peak indicates a slightly lower reduction degree in R-rGO than in H-rGO. However, the profile of H-rGO appears at an elevated baseline implying the formation of large aggregates, which is not seen in the spectra of R-rGO. As shown in Fig. 1b, precipitates can be seen in the bottom of the bottle of the H-rGO aqueous dispersion after 7 days of storage. However, the aqueous dispersion of R-rGO remains stable and homogeneous. In addition, the zeta potential of R-rGO is −46.1 mV, as shown in Table S2,† which also proves that R-rGO has excellent water dispersibility like GO (−33.3 mV). The electrostatic repulsion between particles could keep the system stable and dispersed, which is consistent with the phenomenon of the stable aqueous dispersion of the R-rGO system. The improved dispersion stability suggests that applying rutin as the reductant should be beneficial to the stability of the R-rGO aqueous dispersion.
FTIR spectroscopy was utilized to characterize the changes in the oxygen-containing groups of GO before and after the reduction process. The weak peaks at 2322 cm−1 were observed, possibly due to the stretching and deformation of the O–H groups.22 The absorption bands of GO at 1740 cm−1 (–COOH), 1625 cm−1 (C![[double bond, length as m-dash]](https://www.rsc.org/images/entities/char_e001.gif) C and O–H), and 1070 cm−1 (C–O–C) are not seen in the spectrum of R-rGO. The disappearance of these peaks demonstrate that most of the oxide groups of GO have been reduced in R-rGO. Conversely, the IR bands in the range 1650–1005 cm−1 become more intense in R-rGO than in GO. This is probable evidence for the absorption of rutin molecules on the R-rGO sheets, as rutin shows absorption in the same range. In addition, the relatively broad peak at 3450–3550 cm−1 is due to the adsorbed water in the R-rGO,23 which indicates that the hydrophilic groups present in R-rGO are beneficial for its water dispersibility.
C and O–H), and 1070 cm−1 (C–O–C) are not seen in the spectrum of R-rGO. The disappearance of these peaks demonstrate that most of the oxide groups of GO have been reduced in R-rGO. Conversely, the IR bands in the range 1650–1005 cm−1 become more intense in R-rGO than in GO. This is probable evidence for the absorption of rutin molecules on the R-rGO sheets, as rutin shows absorption in the same range. In addition, the relatively broad peak at 3450–3550 cm−1 is due to the adsorbed water in the R-rGO,23 which indicates that the hydrophilic groups present in R-rGO are beneficial for its water dispersibility.
The XRD spectra of GO and R-rGO are shown in Fig. 1d. The d-spacing is calculated by the Bragg equation:
2d![[thin space (1/6-em)]](https://www.rsc.org/images/entities/char_2009.gif) sin sin![[thin space (1/6-em)]](https://www.rsc.org/images/entities/char_2009.gif) θ = nλ θ = nλ
| (1) |
The XPS spectra of GO and R-rGO are shown in Fig. 1e and f, respectively. The spectrum of GO in Fig. 1e is composed of a series of C 1s peaks in different oxidation states appearing typically at 284.4, 285.2, 287.1, and 288.6 eV, which are ascribed to the C–C (sp2), C–O (sp3), C![[double bond, length as m-dash]](https://www.rsc.org/images/entities/char_e001.gif) O, and π–π* of the carbon structures, respectively.25 Although the peaks also emerge in the spectrum of R-rGO in Fig. 1f at similar positions, their relative intensities have changed. As a consequence of the reduction reaction, the peak of C
O, and π–π* of the carbon structures, respectively.25 Although the peaks also emerge in the spectrum of R-rGO in Fig. 1f at similar positions, their relative intensities have changed. As a consequence of the reduction reaction, the peak of C![[double bond, length as m-dash]](https://www.rsc.org/images/entities/char_e001.gif) O, which is the strongest in Fig. 1e, is much less intense in Fig. 1f. Meanwhile, the outstandingly strong peak of the sp2 hybridized carbon is obvious in the profile of R-rGO. These findings indicate clearly that the oxygen content has decreased. However, as a partially reduced product is suggested by the previous characterization results, the sp3 hybridization of the C–O groups also contributes a certain amount to the R-rGO spectrum. The C–O groups could possibly be left over from the reduction of the rGO, from the absorbed rutin, or be the products of the reduction of C
O, which is the strongest in Fig. 1e, is much less intense in Fig. 1f. Meanwhile, the outstandingly strong peak of the sp2 hybridized carbon is obvious in the profile of R-rGO. These findings indicate clearly that the oxygen content has decreased. However, as a partially reduced product is suggested by the previous characterization results, the sp3 hybridization of the C–O groups also contributes a certain amount to the R-rGO spectrum. The C–O groups could possibly be left over from the reduction of the rGO, from the absorbed rutin, or be the products of the reduction of C![[double bond, length as m-dash]](https://www.rsc.org/images/entities/char_e001.gif) O. The XPS analyses are consistent with the preceding infrared results, which further validated the successful preparation of R-rGO.
O. The XPS analyses are consistent with the preceding infrared results, which further validated the successful preparation of R-rGO.
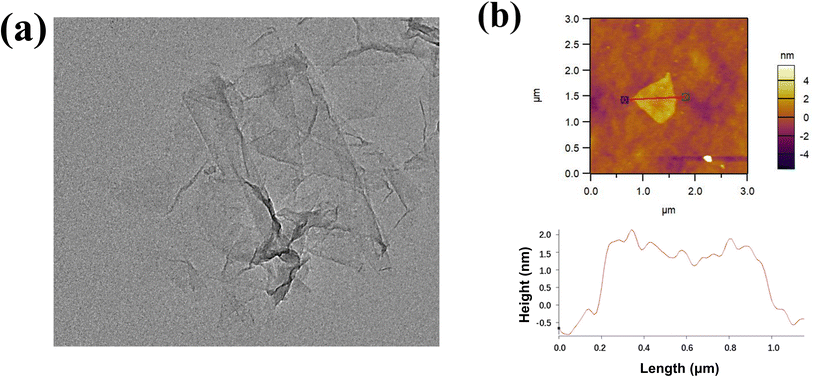
The nano-sheet structure of R-rGO can be further investigated via TEM and AFM. As displayed in Fig. 2a, R-rGO is transparent under TEM with a corrugated and lamellar morphology. The morphology of R-rGO is similar to that of GO (Fig. S1a†), but there is a slight increase in the “wrinkles” on the sheet, which is possibly induced by the reduction reaction.26 Moreover, there are no large and irregular aggregates that occur in the dispersion of R-rGO, unlike in the dispersion of H-rGO (Fig. S1b†). The thickness of R-rGO measured from the height profile of the AFM images in Fig. 2b is about 1.5 nm. The thickness is less than that of GO, which is 1.0 nm, as indicated in Fig. S1c.†
3.2. The synthesis of BTA@SN-rGO
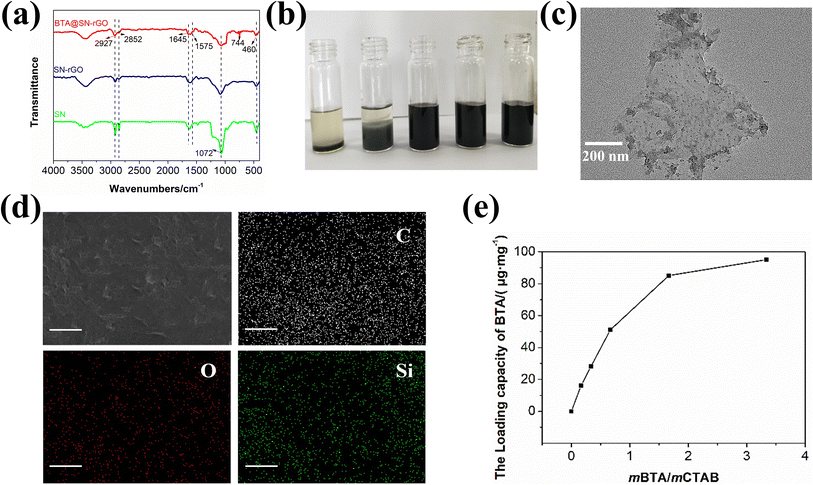
The first evidence for the one-step synthesis of BTA@SN-rGO from TEOS, CTAB and R-rGO is provided by the FTIR spectra in Fig. 3a. The absorption bands at 2927, 2852, and 1072 cm−1 correspond to the stretching vibrations of the C–H bonds of CTAB and the Si–O bonds of SN.27 Furthermore, the absorption bands at 1645, 1575, 1072 cm−1 are attributed to the Si–O–C bonds, and the band at 460 cm−1 is attributed to the symmetric stretch vibrations of the Si–O–Si bonds.28 These bands illustrate that SN has been prepared successfully from TEOS with the assistance of CTAB. Importantly, the peak for the stretching vibration of the aromatic C–H bonds at 744 cm−1 is observed in the BTA@SN-rGO, indicating the successful loading of BTA.The water dispersity of BTA@SN-rGO is presented in Fig. 3b. It can be seen that the mass ratio of TEOS/R-GO influence the dispersity. We find that most dispersions with mass ratio of TEOS/R-rGO below 1 remain homogeneous even after 7 days of storage, indicating the incorporation of BTA@SN on rGO provides good interfacial compatibility with water. Thus we can conclude that the control of the coagulation tailored by CTAB has proceeded as expected. However, too much TEOS is not beneficial to the process. As is also seen in Fig. 3b, when the TEOS/R-rGO ratio is increased to 7/6, phase separation occurs in the dispersion and becomes more apparent with a further increase to a ratio of 7![[thin space (1/6-em)]](https://www.rsc.org/images/entities/char_2009.gif) :
:![[thin space (1/6-em)]](https://www.rsc.org/images/entities/char_2009.gif) 1. Unless otherwise indicated, the BTA@SN-rGO used in the work is prepared with a TEOS/R-GO ratio 7
1. Unless otherwise indicated, the BTA@SN-rGO used in the work is prepared with a TEOS/R-GO ratio 7![[thin space (1/6-em)]](https://www.rsc.org/images/entities/char_2009.gif) :
:![[thin space (1/6-em)]](https://www.rsc.org/images/entities/char_2009.gif) 10.
10.
The TEM image in Fig. 3c depicts the microstructure of BTA@SN-rGO. In contrast, SN was synthesized under the same procedure but without the incorporation of R-rGO or BTA, and its TEM image is shown in Fig. S2a.† In Fig. S2a,† the SN are seen to be nanoparticles with spherical shapes and smooth surfaces whose average diameter is approximately 50 nm. However, the 10 nm size of the particle-like nanodots of BTA@SN-rGO in the image of Fig. 3c is much smaller than 50 nm. These small dots are decorated uniformly on the surface of the 2D nanosheets of R-rGO. To identify whether the dots are SN, SEM equipped with EDS was carried out with the elemental mapping images shown in Fig. 3d. The homogeneous distribution of C (white), O (red), and Si (green) on the surface of the BTA@SN-rGO undoubtedly shows the deposition of silicon oxide on the carbon substrate of graphene as we had designed. In an attempt to exclude the influence of BTA, we also prepared SN-rGO, which showed very similar morphology when examined using TEM (Fig. S2b†). Accordingly, we attribute the decreased size of the SN to R-rGO, which must play a role in the self-assembly of the in situ-produced silicone oxide through its rutin modified surfaces. We suppose that the surface affinity would provide abundant heterogeneous nucleation sites. As a result, smaller BTA@SN dots in a larger population are formed and decorated on the R-rGO sheets.
The incorporation of BTA inside BTA@SN-rGO can be quantified by the measurement of the loading capacity, which is plotted as the function of the mass ratio in Fig. 3e. It can be seen that the larger the BTA/CTAB ratio, the more BTA can be loaded. When the ratio is 5![[thin space (1/6-em)]](https://www.rsc.org/images/entities/char_2009.gif) :
:![[thin space (1/6-em)]](https://www.rsc.org/images/entities/char_2009.gif) 3, the loading capacity reaches its maximum (85.1 μg mg−1). Comparatively, we also tested the BTA capacity of BTA@SN (Fig. S3†) which reaches 130.7 μg mg−1 at the same BTA/CTAB ratio. The value for BTA@SN-rGO is lower than that of BTA@SN, which might be explained by the sacrifice of the internal loading spaces as a consequence of the decreased particle sizes caused by R-rGO. However, the additional barrier function of rGO would be of great significance for the long-term anti-corrosion protection of the coating.
3, the loading capacity reaches its maximum (85.1 μg mg−1). Comparatively, we also tested the BTA capacity of BTA@SN (Fig. S3†) which reaches 130.7 μg mg−1 at the same BTA/CTAB ratio. The value for BTA@SN-rGO is lower than that of BTA@SN, which might be explained by the sacrifice of the internal loading spaces as a consequence of the decreased particle sizes caused by R-rGO. However, the additional barrier function of rGO would be of great significance for the long-term anti-corrosion protection of the coating.
3.3. The controllable release of BTA
One characteristic of BTA@SN-rGO is that it releases BTA in response to pH, which is revealed in Fig. 4a. It can be seen that the release of BTA under acidic conditions is faster than under neutral conditions. At pH 1.0 and 3.0, 83% and 58% of the incorporated BTA is released within 2 h, respectively; while at pH 7.0, it needs about 24 h to release the same amount. Moreover, the accumulative release of the loaded BTA is 62% at pH 7.0 after 24 h of tests, whilst this figure is 89% and 97% at pH 3.0 and 1.0, respectively. The accelerated release of BTA@SN-rGO under acidic conditions is of great significance in improving the acid resistance of the coating.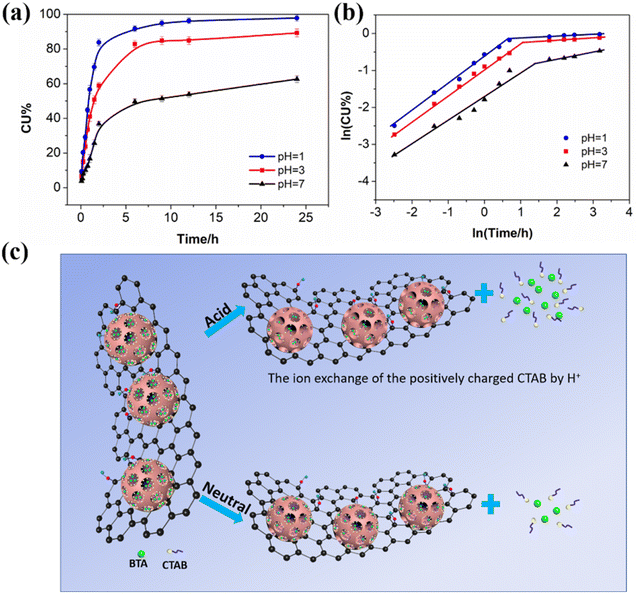 | ||
| Fig. 4 (a) BTA release profiles from BTA@SN-rGO. (b) The fitted curves obtained by employing a Ritger–Peppas model. (c) Schematic illustration of the release mechanism of BTA@SN-rGO. | ||
To illustrate the differences caused by pH, the Ritger–Peppas model is employed to fit the release curves, which is given by
ln![[thin space (1/6-em)]](https://www.rsc.org/images/entities/char_2009.gif) CU% = ln CU% = ln![[thin space (1/6-em)]](https://www.rsc.org/images/entities/char_2009.gif) k + n k + n![[thin space (1/6-em)]](https://www.rsc.org/images/entities/char_2009.gif) ln ln![[thin space (1/6-em)]](https://www.rsc.org/images/entities/char_2009.gif) t t
| (2) |
| pH | Time | n | k | R2 | Release mechanism |
|---|---|---|---|---|---|
| 1 | 0–2 h | 0.734 | 0.527 | 0.993 | Superposition |
| 2–24 h | 0.044 | 0.856 | 0.956 | Porous matrix | |
| 3 | 0–2 h | 0.704 | 0.388 | 0.995 | Superposition |
| 2–24 h | 0.052 | 0.754 | 0.925 | Porous matrix | |
| 7 | 0–2 h | 0.672 | 0.186 | 0.952 | Superposition |
| 2–24 h | 0.172 | 0.358 | 0.944 | Porous matrix |
The release behavior of BTA@SN-rGO in neutral water shows two stages similar to that seen in acid but shows a decreased value of k in both of the stages. This observation is quite reasonable as the dissolution of CTAB is slower without additional H+, as shown in Fig. 4c. Moreover, the n value in the initial stage drops from 0.734 (pH = 1) and 0.704 (pH 3) to 0.672 (pH 7). The closer n is to 0.5 in the first stage, the closer the release is to an ideal Fickian diffusion. In the second stage, the n value increases from 0.044 (pH = 1) and 0.052 (pH 3) to 0.172 (pH 7), indicating more deviation from the total disruption of the matrix.
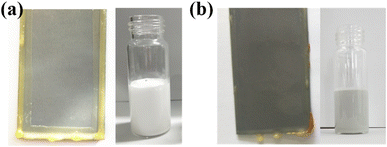
3.4. The function of BTA@SN-rGO in the latex coating
The prepared nanocomposite of BTA@SN-rGO was introduced into a latex coating as a new type of modifier. The digital images of the modified latex and the corresponding coating are displayed in Fig. 5. In comparison with the blank polymer latex and its coating film (BPc), no obvious phase separation is observed in the blended dispersion or the BTA@SN-rGO coating film.Further, the SEM images of the cross-section of the coating films are shown in Fig. S4.† It can be easily observed that the incorporated nanocomposite is homogeneously distributed in the coatings without large agglomerates. Moreover, the SN-GO, SN-rGO, and BTA@SN-rGO coating films have almost no defects, in contrast with those of BPc and SN where some defects are seen. The homogeneously distributed SN-rGO and BTA@SN-rGO have good compatibility with the matrix that may improve the compactness of coatings. As revealed by the RMS analysis of the AFM images in Fig. S5,† the roughness of BPc is the smallest, which is 7.565 nm. The roughness of the SN-rGO and BTA@SN-rGO coatings is 14.612 nm and 14.676 nm, respectively. The addition of the nanocomposite slightly increases the coating surface roughness. However, all the coatings show surface fluctuations of no more than 250 nm in the test region of 20 μm × 20 μm. Thus, we attribute the increased roughness mainly to the size effect of the nano additives.
The chemical resistance of the coatings is evaluated by the soaking test in different mediums including acid, alkali, and distilled water. The time duration before the coating failed is listed in Table 2. Using the protection time of BPc as the reference, which is the shortest, we can find that the addition SN has very little impact. Meanwhile, the SN-GO coating shows some improvement in the anticorrosion performance, but not as remarkable as the coatings of SN-rGO and BTA@SN-rGO. Such a result could be explained by the greater impermeability of the rGO-based nanoparticles due to the reduction of the hydrophilic oxygen-containing groups. It indicates that hydrophilic groups would be adverse to the performance of coatings to a certain extent. It is worth noting the necessity to retain these hydrophilic groups with respect to the dispersibility and the performance of the coating. As expected, the BTA@SN-rGO coating films provide the longest protection in all the above mediums. The duration is prolonged from 32, 65, 52, and 19 days for BPc, to 55, 106, 96, and 65 days for the BTA@SN-rGO coating in H2SO4, NaOH, NaCl solution and DW water, respectively, with an increase of 71%, 63%, 84% and 242%, respectively. To stress the function of the intelligent release of incorporated BTA, we can compare the protection time of BTA@SN-rGO with that of the SN-rGO coating in various mediums. The results clearly show the improvement in the duration in the H2SO4 medium (11 days, 28% enhancement) is better than the duration improvement in NaOH (9 days, 10%), NaCl (10 days, 13%) and distilled water (6 days, 10%). It is consistent with the above result that BTA@SN-rGO shows the rapidest BTA release rate in an acidic environment, and this is especially important for widely used waterborne epoxy anticorrosion coatings, as one drawback of such coatings is their poor resistance to acid.
| Coating | 10 wt% H2SO4 per d | 5 wt% NaOH per d | 3.5 wt% NaCl per d | DW per d |
|---|---|---|---|---|
| BPc | 32 | 65 | 52 | 19 |
| SN | 33 | 67 | 56 | 25 |
| SN-GO | 35 | 78 | 65 | 43 |
| SN-rGO | 39 | 87 | 80 | 59 |
| BTA@SN-rGO | 50 | 96 | 90 | 65 |
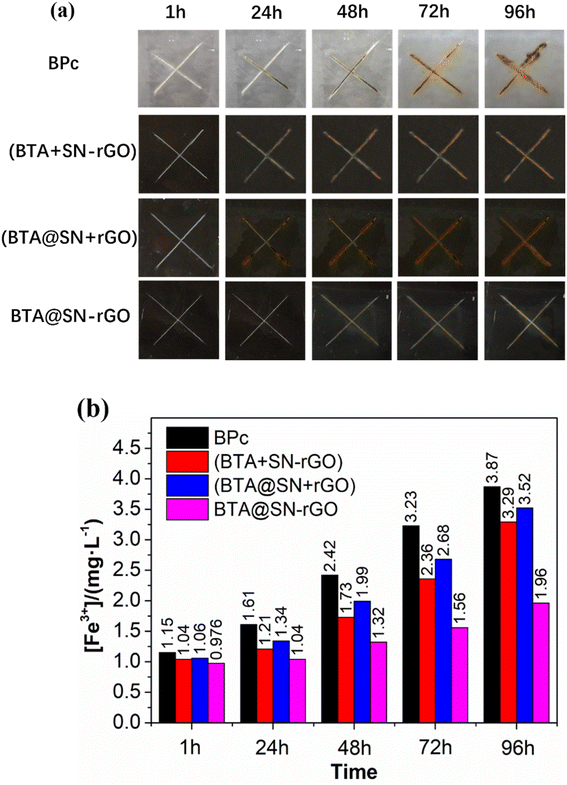
According to the present results, the improved anti-corrosion performance of BTA@SN-rGO coating is supposed to be the result of the synergy between the rGO barriers and the smart release of BTA which facilitates the self-healing of the corrosion damage. The latter is verified by the comparison of the scratched coatings of BPc, BTA@SN-rGO, (BTA + SN-rGO) and (BTA@SN + rGO). The digital photos of the coating surfaces after different periods of soaking are shown in Fig. 6a. After 1 h of soaking, the state of these four coatings was almost the same as that at the start. The corrosion along the crossed scratches on the BPc, (BTA + SN-rGO) and (BTA@SN + rGO) coatings emerged after an immersion time of 24 h. As time went on, the corrosion became progressively worse. However, for our BTA@SN-rGO coating, slight rust could only be seen on the crossed scratches after 48 h of immersion. The corrosion of the BTA@SN-rGO coating also became aggravated as the immersion time prolonged, but at a very depressed rate according to the photographs taken after 96 h, where the BTA@SN-rGO coating shows the lightest corrosion on the surface. Undoubtedly, the formation of a passivation film on the metal surface at the damaged part of the coating should account for the slower corrosion due to a self-healing process. The test on the artificial scratches illustrates clearly that the smart release of BTA from the evenly distributed BTA@SN-rGO in response to the pH triggered by the chemical etching reactions exhibits the most effective healing process.
In order to evaluate the self-healing quantitatively, the concentration of ferric ions ([Fe3+]) in the soaking bath solution of different coating systems was measured by UV/vis spectroscopy via a conventional sulfosalicylic acid spectrophotometry method.32 The standard curve is shown in Fig. S6,† and the absorbance after different soaking times is shown in Table S3.† The [Fe3+] in solution as a function of the soaking time is shown in Fig. 6b. Over the entire test period, [Fe3+]BPc rose from 1.15 mg L−1 (1 h) to 3.87 mg L−1 (96 h), indicating the severest corrosion of the metal. However, there were less ferric ions drifting away from the steel surface to the solution bath for the (BTA + SN-rGO), (BTA@SN + rGO) and BTA@SN-rGO coating samples. In particular, the [Fe3+] in the solution of the BTA@SN-rGO coating bath was the lowest, at only 1.96 mg L−1 (96 h). So it can be seen again that the BTA@SN-rGO coating has the a superior corrosion inhibition function, which, integrated with the barrier function of R-rGO, would serve to protect the metal substrate over the long term.
3.5. Electrochemical study
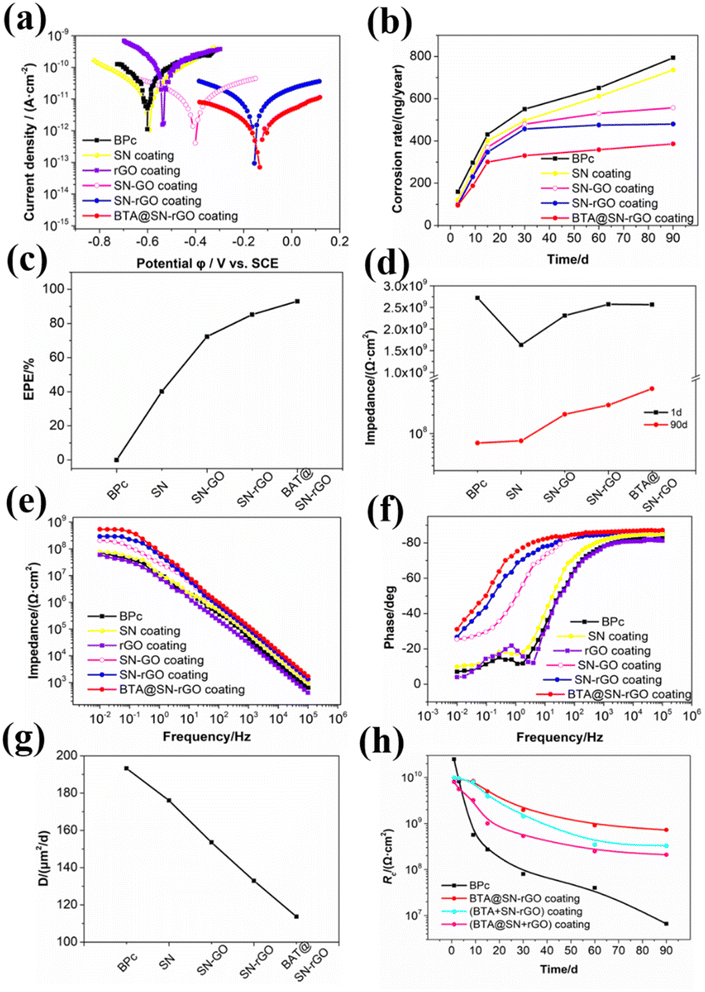
To further gain a thorough understanding of the anticorrosion performance of BTA@SN-rGO, we have applied potential dynamic polarization measurements and electrochemical impedance spectroscopy (EIS) to confirm the synergy in BTA@SN-rGO. The electrochemical results are presented in Fig. 7 and analyzed in detail in the following section.Fig. 7a shows the Tafel polarization plots of different coatings in 0.35 wt% NaCl aqueous solution. Information about corrosion potential can be obtained from the Tafel plots by extrapolating the cathodic and anodic polarization curves to their intersection points.33 The corrosion potential of all the other coatings shows a positive shift compared with BPc, which reveals that the corrosion tendency decreases. Being consistent with the results from the soaking tests, the corrosion potential of the SN coating shows the smallest positive shift, the SN-GO coating shows a middling shift, and the SN-rGO and BTA@SN-rGO coatings show the most positive shifts, affirming the clear superiority of the rGO-based nanoparticles over the GO-based nanoparticles in anticorrosion applications. However, the BTA@SN-rGO coating film exhibits a little more positive corrosion potential than SN-rGO. The trend shown in the Tafel plots validates that the BTA@SN-rGO coating would be the most impermeable.
Further, the decrease of the corrosion rate (CR) and the enhanced protection efficiency (EPE%) suggests the superiority of the modifiers. The CR was then evaluated by substituting Icorr in the following equation:34
 | (3) |
The (EPE%) was evaluated using the following equation:35
The impedance modulus obtained from EIS at a low frequency of 10 mHz also provides an important reference for us to judge the protective capabilities of coatings.36 A coating film is deemed to be of acceptable anticorrosion capability when its impedance modulus at that frequency is higher than 108 Ω cm2. As can be seen in Fig. 7d, the impedance moduli of all the investigated coatings were higher than 109 Ω cm2 at the beginning. After 90 days of soaking, the impedance of the coating films containing nano additives were all higher than that of BPc (7.0123 × 10⁷ Ω cm2), and increased in the sequence of SN (7.6042 × 10⁷ Ω cm2), SN-GO (2.0589 × 10⁸ Ω cm2), SN-rGO (2.898 × 10⁸ Ω cm2) and BTA@SN-rGO (5.3812 × 10⁸ Ω cm2). Their corresponding specific Bode plots (Z–f) are shown in Fig. 7e. The BTA@SN-rGO coating shows optimum corrosion resistance in good agreement with the polarization measurements. In addition, the Bode plots (phase-f) after 90 days shown in Fig. 7f also illustrate the enhanced anticorrosion performance of the BTA@SN-rGO coating. The Bode phase plots of the BTA@SN-rGO, SN-rGO and SN-GO coatings display only one peak, indicating one time constant. Such a time constant suggests classical barrier behavior which means that the coating can shield metals well. However, for the SN and BPc coating films, an additional time constant is visible at intermediate/low frequencies. The additional time constant is responsive to metal and reflects the corrosion behavior of the metal substrate.
Next, the EIS results of the coatings were fitted using ZSimpWin from the equivalent electric circuits presented in Fig. S7.† The equivalent circuit of model A is for impermeable coatings, while that for permeable coatings is model B. Through the fitting, we can obtain the coating resistance (Rc) and coating capacitance (Qc). Rc relates to the number of pores or capillary channels in the coating film and the increase of Qc is due to the ingress of water.
In order to provide more evidence of the above-mentioned improved barrier performance of the BTA@SN-rGO coating, we have estimated the overall diffusion coefficient of the active corrosive species (Dacs) in the BPc, SN, SN-GO, SN-rGO and BTA@SN-rGO coatings. The diffusion coefficient can be calculated from the following equation shown below according to the simplified Fick's second law of diffusion:37
Not only are the barrier properties an important factor in determining the anticorrosion performance, but the intelligent release characteristics are also of great significance. For the purpose of investigating the intelligent release characteristic of the BTA@SN-rGO coatings, the evolution of the Rc values of the BPc, BTA@SN-rGO, (BTA + SN-rGO) and (BTA@SN + rGO) coatings is shown in Fig. 7h as a function of the soaking time. In the initial 1–15 days of immersion, the Rc values of the BPc descended sharply, illustrating the generation of capillary channels or pores. The (BTA + SN-rGO), (BTA@SN + rGO) and BTA@SN-rGO coating films all showed higher Rc values than BPc, and among them, the Rc value of BTA@SN-rGO is the largest. Containing the same components as the BTA@SN-rGO coating, the Rc value of the (BTA + SN-rGO) coating is lower than that of BTA@SN-rGO, which confirms the significance of the loading of BTA. From this finding, it could be interpreted that the free inhibitors would leak out uncontrollably at the beginning and could not form a film directed toward where the damage has occurred. The Rc value of the (BTA@SN + rGO) coating is also lower than that of BTA@SN-rGO, which, in another way, illustrates the necessity of the composition of the SN and rGO. We think that the improvement is probably because of the diffusion of BTA is hindered by the R-rGO. The differences in the Rc values confirm that the (BTA + SN-rGO) and (BTA@SN + rGO) coatings are inferior to the BTA@SN-rGO coating, which verify the synergy of the extraordinarily good barrier characteristics and the smart nanocontainer features of BTA@SN-rGO. It is possible that the excellent passive protection of rGO for the good barrier capability would work at the initial immersion time, and the very helpful active protection of BTA, which is encapsulated in the SN and hindered by the rGO inside the coating, would show its effectiveness only when coating damage occurs.
Further analysis also suggests that the function of BTA@SN-rGO is not only limited to the improvement of the barrier capability and the delay of the rate of invasion of corrosive molecules. When the epoxy coating film is damaged, BTA@SN-rGO exposed to a corrosive acidic environment would release the corrosion inhibitor at the damaged area and prevent the spread of corrosion, as presented in Fig. 8d, which plays a crucial role in enhancing the corrosion properties of the epoxy coating. However, for the BPc coating, the corrosive particles would quickly reach the steel (Fig. 8a). For the (BTA@SN + rGO) coating, the heterogeneous system would have an insufficient rGO barrier effect, as shown in Fig. 8b. For the (BTA + SN-rGO) coating, the active protection is prone to be exhausted quickly due to the uncontrolled release of the inhibitors, as shown in Fig. 8c. These observations all confirm that the design of BTA@SN-rGO is imperative in improving the acid resistance and corrosion resistance properties of waterborne epoxy coatings.
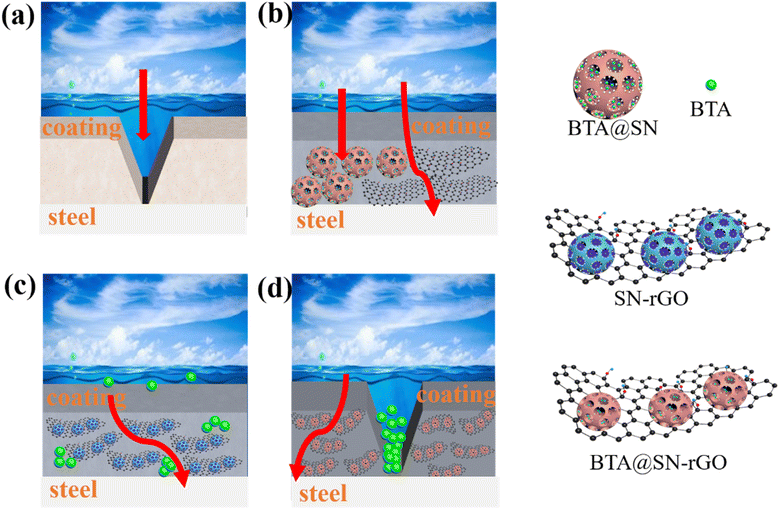 | ||
| Fig. 8 Proposed protection mechanisms for the (a) BPc, (b) (BTA@SN + rGO), (c) (BTA + SN-rGO), and (d) BTA@SN-rGO coatings. | ||
4. Conclusions
In this work, we first prepared R-rGO via a green method using the natural product of rutin as the reductant. Characterization using UV-vis, FTIR, XRD, and XPS suggests a partial reduction of the GO and that the residual rutin is absorbed on the R-rGO which modifies the surface of the nanosheets. Utilizing the affinity sites on the R-rGO, controlled coagulation was induced by CTAB during the template synthesis of BTA@SN. The in situ decoration of BTA@SN nanodots on the R-rGO sheets was confirmed using TEM, SEM, and elemental mapping. The obtained BTA@SN-rGO nanocomposite showed good dispersion stability in water, and it was able to release BTA in response to pH. Moreover, BTA@SN-rGO has good compatibility with the polymer both in the latex dispersion and in the coating matrix. The obtained coating showed a remarkable improvement in anticorrosion performance in different media. Further, EIS has been applied to monitor the corrosion process, which reveals the synergistic effect of the inherited impermeability (passive protection) along with smart self-healing properties (active protection). This novel BTA@SN-rGO material is easy to synthesize and endows the waterborne coating with enhanced anticorrosion performance, which would provide a step towards more environmentally friendly effective anticorrosion technology.Author contributions
Yanling Jia: conceptualization, methodology, visualization, investigation, software and writing – review & editing; Ke Zhang: project administration, supervision, funding acquisition and writing – review & editing.Conflicts of interest
The authors declare no conflict of interest.Acknowledgements
This work was supported by the Jiaxing Science and Technology Plan Project (Grant No. 2023AY11023), General scientific research projects of Zhejiang Provincial Department of Education (Grant No. Y202250344), the National Natural Science Foundation of China (Grant No. 62304018), and the Zhejiang Provincial Natural Science Foundation of China (Grant No. LQ22F040002).References
- M. L. Zhu, R. X. Yuan, C. J. Wang, Q. H. Gao, H. Y. Wang and H. J. Qian, Appl. Surf. Sci., 2023, 615, 156287 CrossRef CAS.
- S. M. Ren, M. J. Cui, C. B. Liu and L. P. Wang, Corros. Sci., 2023, 212, 110939 CrossRef CAS.
- S. C. Yuan, Y. Sun, C. Cong, Y. R. Liu, D. Lin, L. C. Pei, Y. J. Zhu and H. Y. Wang, Carbon, 2023, 205, 54–68 CrossRef CAS.
- S. Singh, A. M. Varghese, D. Reinalda and G. N. Karanikolos, J. CO2 Util., 2021, 49, 101544 CrossRef CAS.
- J. Mu, F. J. Gao, G. Cui, S. Wang, S. Tang and Z. L. Li, Prog. Org. Coat., 2021, 157, 106321 CrossRef CAS.
- S. S. A. Kumar, S. Bashir, K. Ramesh and S. Ramesh, Prog. Org. Coat., 2021, 154, 106215 CrossRef CAS.
- A. Gutiérrez-Cruz, A. R. Ruiz-Hernández, J. F. Vega-Clemente, D. G. Luna-Gazcón and J. Campos-Delgado, J. Mater. Sci, 2022, 57, 14543–14578 CrossRef.
- N. Kumar, R. Salehiyan, V. Chauke, O. J. Botlhoko, K. Setshedi, M. Scriba, M. Masukume and S. S. Ray, FlatChem, 2021, 27, 100224 CrossRef CAS.
- A. Razaq, F. Bibi, X. X. Zheng, R. Papadakis, S. H. M. Jafri and H. Li, Materials, 2022, 15, 110939 CrossRef PubMed.
- W. Liu and G. Speranza, ACS Omega, 2021, 6, 6195–6205 CrossRef CAS PubMed.
- R. Wijaya, G. Andersan, S. Permatasari Santoso and W. Irawaty, Sci. Rep., 2020, 10, 667 CrossRef CAS PubMed.
- Y. Chen, Y. Wu, G. Dai, Z. Li, C. Ma and W. Cui, J. Electron. Mater., 2020, 49, 1889–1895 CrossRef CAS.
- B. Shen, W. Zhai, C. Chen, D. Lu, J. Wang and W. Zheng, ACS Appl. Mater. Interfaces, 2011, 3, 3103–3109 CrossRef CAS PubMed.
- Y. Jia, T. Qiu, L. Guo, J. Ye, L. He and X. Li, ACS Appl. Nano Mater., 2018, 1, 1541–1550 CrossRef CAS.
- W. Sun, L. Wang, T. Wu, Y. Pan and G. Liu, J. Mater. Chem. A, 2015, 3, 16843–16848 RSC.
- Y. Jia, T. Qiu, L. Guo, J. Ye, L. He and X. Li, ACS Appl. Surf. Sci., 2020, 504, 1541–1550 Search PubMed.
- J.-B. Xu, Y.-Q. Cao, L. Fang and J.-M. Hu, Corros. Sci., 2018, 140, 349–362 CrossRef CAS.
- D. Stojkovic, J. Petrovic, M. Sokovic, J. Glamoclija, J. Kukic-Markovic and S. Petrovic, J. Sci. Food Agric., 2013, 93, 3205–3208 CrossRef CAS PubMed.
- W. S. Hummers Jr and R. E. Offeman, J. Am. Chem. Soc., 1958, 80, 1339 CrossRef.
- E. Abdullayev, V. Abbasov, A. Tursunbayeva, V. Portnov, H. Ibrahimov, G. Mukhtarova and Y. Lvov, ACS Appl. Mater. Interfaces, 2013, 5, 4464–4471 CrossRef CAS PubMed.
- J. Li, G. Xiao, C. Chen, R. Li and D. Yan, J. Mater. Chem. A, 2013, 1, 1481–1487 RSC.
- S. Liu, L. Gu, H. Zhao, J. Chen and H. Yu, J. Mater. Sci. Technol., 2016, 32, 425–431 CrossRef CAS.
- M. Gupta, H. F. Hawari, P. Kumar and Z. A. Burhanudin, Crystals, 2022, 12, 264 CrossRef CAS.
- S. Liu, X. He, J. Zhu, L. Xu and J. Tong, Sci. Rep., 2016, 6, 35189 CrossRef CAS PubMed.
- Y. Wang, Y. Shao, D. W. Matson, J. Li and Y. Lin, ACS Nano, 2010, 4, 1790–1798 CrossRef CAS PubMed.
- Y. Lei, Z. Tang, R. Liao and B. Guo, Green Chem., 2011, 13, 1655–1658 RSC.
- D. Amouzou, L. Fourdrinier, F. Maseri and R. Sporken, Appl. Surf. Sci., 2014, 320, 519–523 CrossRef CAS.
- Y. Zhang, H. Yin, A. Wang, M. Ren, Z. Gu, Y. Liu, Y. Shen, L. Yu and T. Jiang, Appl. Surf. Sci., 2010, 257, 1351–1360 CrossRef CAS.
- J. Qu, X. Zhao, P. X. Ma and B. Guo, Acta Biomater., 2017, 58, 168–180 CrossRef CAS PubMed.
- O. V. Dement'eva, I. N. Senchikhin, M. E. Kartseva, V. A. Ogarev, A. V. Zaitseva, N. N. Matushkina and V. M. Rudoy, Colloid J., 2016, 78, 586–595 CrossRef.
- L. Jia, Z. Li, J. Shen, D. Zheng, X. Tian, H. Guo and P. Chang, Int. J. Pharm., 2015, 489, 318–330 CrossRef CAS PubMed.
- A. Shahat, N. Y. Elamin and W. Abd El-Fattah, ACS Omega, 2022, 7, 1288–1298 CrossRef CAS PubMed.
- J. E. Ramón, J. M. Gandía-Romero, R. Bataller, M. Alcañiz, M. Valcuende and J. Soto, Cem. Concr. Compos., 2020, 110, 103590 CrossRef.
- D. Dutta, A. N. F. Ganda, J.-K. Chih, C.-C. Huang, C.-J. Tseng and C.-Y. Su, Nanoscale, 2018, 10, 12612–12624 RSC.
- W. Sun, L. Wang, T. Wu, Y. Pan and G. Liu, Carbon, 2014, 79, 605–614 CrossRef CAS.
- S. X. Zhao, B. J. Dou, S. Duan, X. Z. Lin, Y. J. Zhang, W. Emori, X. L. Gao and Z. W. Fang, RSC Adv., 2021, 11, 17558–17573 RSC.
- M. M. Wind and H. J. W. Lenderink, Prog. Org. Coat., 1996, 28, 239–250 CrossRef CAS.
Footnote |
| † Electronic supplementary information (ESI) available. See DOI: https://doi.org/10.1039/d4ra00522h |
| This journal is © The Royal Society of Chemistry 2024 |

