DOI:
10.1039/D4RA00443D
(Paper)
RSC Adv., 2024,
14, 7061-7072
Energy transfer for Ce3+ → Tb3+ → Sm3+ induced bright white emission in single-phase CaLa4(SiO4)3O:Ce3+, Tb3+, Sm3+ phosphors and their application in white-light-emitting diodes
Received
17th January 2024
, Accepted 13th February 2024
First published on 28th February 2024
Abstract
The emergence of phosphor-converted white-light-emitting diodes has crucial significance in the sustainable development of energy; hence, the evolution of phosphors with eminent luminescence and high stability is imperative. In this study, a tri-doped system composed of rare earth ions Ce3+, Tb3+, and Sm3+ incorporated into a CaLa4(SiO4)3O host is reported, and the energy transfer, tunable single-phase white emission, and favorable thermostability of the Ce3+–Tb3+–Sm3+ system were explored. Rietveld refinement results coincided with the original model of the crystal structure, and a band gap energy of 4.612 eV calculated using density functional theory (DFT) demonstrated the system as an appropriate luminescent host with a wide energy gap. Furthermore, ET processes for Ce3+ → Tb3+, Tb3+ → Sm3+, and Ce3+ → Tb3+ → Sm3+ were investigated via steady-state photoluminescence and decay measurements. Besides, the activation energies of CLSO:3%Ce3+, 9%Tb3+, y%Sm3+ (y = 7, 9) were 0.205 eV and 0.223 eV, respectively, showing outstanding thermal quenching resistance. Devices made with LED beads containing CLSO:3%Ce3+, 9%Tb3+, y%Sm3+ (y = 7, 9) phosphors exhibited bright white light with CCT ≈ 3586 and 3307 K and Ra ≈ 81.0 and 78.5, respectively. This study demonstrates that energy transfer for Ce3+–Tb3+–Sm3+ in a tri-doped system offers an interesting design prospect for promoting single-phase white emission phosphors.
1. Introduction
Lanthanide activated inorganic luminescent materials with superior features for color modulation covering almost the entire range of visible light have been found to possess important application value in the lighting field.1–3 While energy-conserving phosphor-converted white-light-emitting diodes (pc-WLEDs) are predicted to become the fourth generation artificial lighting,4,5 currently, the commercial combined patterns of white LEDs involve a InGaN blue chip + YAG:Ce3+ yellow phosphor. However, the imperfections of its color rendering and color temperature are still criticized.6,7 There are two ways for overcoming this problem: one is the supplementation of red components that can effectively absorb blue emission; the other is to apply a mixture of blue, green and yellow phosphor coating with an ultraviolet chip to acquire a soft white light. However, both the schemes involve reabsorption and aging rate differences for mixed phosphors, which can affect luminescence efficiency.8–11 Current effective alternate solutions to eliminate these inadequacies are expected to involve a single-phase white emission phosphor with high thermal stability, and one that would also be more appropriate for the ultraviolet region.12
Based on the current situation, following tactics are applied to induce white emission for rare earth ion-doped single-phase phosphors: (I) activation of a single ion in a low phonon energy host. Although white light may be derived from Dy3+ ions for f–f transition or by Eu2+ ion emission from d–f transition, the low emission efficiency of f–f transition due to cross relaxation and inadequate red emission for d–f transition remain disputed.13–15 (II) Varying the ratio of emission centers and with an excitation of a particular wavelength when multiple activated ions are mixed into a feasible matrix. However, the degradation of white light due to a slight deviation in the excitation wavelength is a major challenge.16,17 (III) Energy transfer among different dopants. However, the current energy-transfer system mostly involves double doping, and the energy-transfer efficiency and luminescent color need to be further improved.18,19 Thus, more research needs to be carried out on energy transfer in tri-doped systems.
The energy transfer in tri-doped systems offers better patterns that can make up for the above deficiencies and realize high-quality white light in a single component, but the implementation conditions are more stringent. As is well known, Ce3+ ions can have an outstanding effect as vital sensitizers due to their 4f electronic configuration; while Tb3+ and Sm3+ ions are also effective doping activations for green and red emission, respectively.20–22 Hence, the effective energy absorbed by Ce3+ eventually transferring to Sm3+ through Tb3+ in the Ce3+–Tb3+–(Sm3+)n model can be considered to produce white light emission. Furthermore, the crystal field environment in which the above three ions reside is also crucial to this process. Silicate is universally recognized for its simple synthesis, remarkable thermal stability and low cost, and has been substantiated as an admirable luminescent substrate.23 A2B8(SiO4)6O2 (A = alkaline metal, B = rare earth), as oxyapatite-related silicate constituents, are favorable rare earth-activating matrixes in the silicate family. These compounds possess two special sites in their lattice structures: a seven-coordinated 6h site with the Cs point symmetry and a nine-coordinated 4f site with the C3 point symmetry, which provide lattice placeholders for different categories of emission of the activation ions.24 In this research, it is demonstrated that the CaLa4(SiO4)3O (henceforth shortened as CLSO) oxyapatite silicate host exhibited energy transfer for the Ce3+–Tb3+–Sm3+ tri-doped systems for white-light emission. The ET principles of Ce3+–Tb3+, Tb3+–Sm3+, and Ce3+–Tb3+–Sm3+ ions were investigated in detail on the strength of the steady-state photoluminescence process and lifetime consequences. Impressively, the results indicated that the chromaticity coordinates of CLSO:Ce3+, Tb3+, Sm3+ phosphors can enter the white zone by alteration of the Sm3+ ion concentration, and the performance of the thermal stabilities in the phosphors was ideal. Finally, the application test for a device assembly based on UV LED chips was carried out. This is the first study that has reported achieving white-light emission through the Ce3+–Tb3+–Sm3+ triply-doped CLSO system.
2. Experimental
2.1 Material fabrication
A solid-phase synthesis was applied to the preparation of a series of CLSO:Ce3+/Tb3+/Sm3+ phosphors. The primary materials mainly consisted of CaCO3, SiO2, La2O3, CeO2, Tb4O7 and Sm2O3 (analytical reagent grade), and all were obtained from Sinopharm Chemical Reagent. The above compounds were combined in an agate mortar according to the proportion of the chemical constituents. After mixing thoroughly, the mixed samples were transferred to a muffle furnace for presintering at 1000 °C for 1 h, and soon afterwards programmed to 1500 °C in a tube furnace and maintained at that temperature for 4 h under a reduction atmosphere of N2 (95%)/H2 (5%). Finally, after natural cooling, the mixtures were crushed to obtain powder products for the following tests.
2.2 White LED prototype fabrication
Serial white LED devices were fabricated with a coating on the cover of commercial 360 nm LED chips with the as-synthesized CLSO:3%Ce3+, 9%Tb3+, y%Sm3+ (y = 7, 9) phosphors. The working voltage of 3.0 V and bias current of 20 mA were employed to operate the fabricated LED prototypes.
2.3 Measurements and characterization
The characterization tests for obtaining the phase data and crystal structure were based on X-ray diffraction (XRD) patterns obtained using a Bruker AXS D8 diffractometer, in the 2θ range of 10° to 80°, with CuKα radiation. The crystal structure refinement was resolved employing the Rietveld method in the GSAS program. Evaluation of the band structures for CLSO was performed based on density functional theory calculations performed in the CASTAP module. The steady-state spectra for the excitation and emission were measured on an Edinburgh FS5 spectrometer with a 150 W xenon lamp. The decay curves of the transient-state luminescence measurements were recorded by nanosecond and millisecond pulse lasers as the excitation sources on the Edinburgh FLS980 spectrometer. The luminescence thermal stability was investigated on the same system equipped with a temperature controller. The electroluminescence and correlative performances (CIE, CRI and CCT) of the LED prototypes were traced utilizing an EVERFINE HAAS-2000 LED Spectro-photocolorimeter system.
3. Results and discussion
3.1 Crystal structure and simple phase analysis
The XRD patterns of the samples with different doping content are presented in Fig. 1a. All the results could be well indexed to the crystal structure of CLSO derived from the standard diffraction data (JCPDS 71-1368), suggesting that the signals of other components were not observed in these samples. This further illustrates that the crystal structure of CLSO could be retained even with the small introduction of rare earth ions, and that the Ce3+, Tb3+ and Sm3+ ions had been dissolved into the crystal lattice of the host. It is suggested that Ce3+ (r = 1.07 Å for CN = 7 and r = 1.19 Å for CN = 9), Tb3+ (r = 0.98 Å for CN = 7 and r = 1.09 Å for CN = 9) and Sm3+ (r = 1.02 Å for CN = 7 and r = 1.13 Å for CN = 9) occupy the La3+ (r = 1.10 Å for CN = 7 and r = 1.22 Å for CN = 9) lattice in CLSO:Ce3+, Tb3+, Sm3+ considering the ionic radii, valence state, and atomic coordination.24–26 The model of the space unit for CLSO was constituted employing Diamond software and based on the literature. As exhibited in Fig. 1b, the CLSO compound crystallized in the hexagonal oxyapatite structure with the space group P63/m (176), with the lattice parameters a = b = 9.651 Å, c = 7.151 Å, V = 576.8 Å. In this structure, Ca1/La1 ions are situated at the 4f site with a nine-fold coordination and Ca2/La2 ions are situated at the 6h site with a seven-fold coordination, which are linked to the isolated SiO4 tetrahedron.27–29 The obvious crystal field environment difference between the 6h and 4f sites will lead to diverse crystal field strengths and a nephelauxetic effect for the emission centers in the host.30
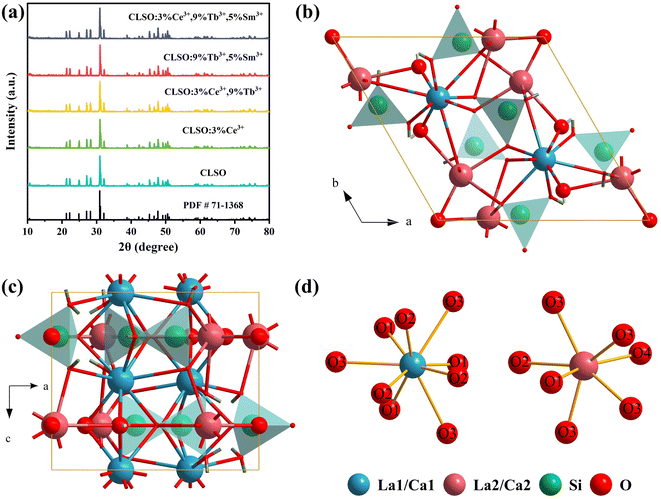 |
| | Fig. 1 (a) XRD patterns for the prepared CLSO samples, CLSO:Ce3+/Tb3+/Sm3+ phosphors and the CLSO standard data (PDF # 71-1368). (b and c) Crystal structure of the CLSO host. (d) Coordination environments for cation sites (La1/Ca1 and La2/Ca2). | |
Rietveld refinement of the XRD patterns for the CLSO and CLSO:Ce3+ samples was performed (the recorded, computed and difference XRD profiles are depicted in Fig. 2). The refined fraction factors were Rp = 11.85%, Rwp = 13.25%, and χ2 = 3.881 for CLSO and Rp = 10.94%, Rwp = 12.11%, and χ2 = 3.395 for CLSO:Ce3+, indicating that the refinements of the crystal structures were dependable. The cell constants of CLSO and CLSO:Ce3+ were a = b = 9.651 Å, c = 7.155 Å, V = 577.15 Å3 and a = b = 9.650 Å, c = 7.146 Å, V = 576.53 Å3, respectively, with the final particular refinement information summarized in Tables 1 and 2.
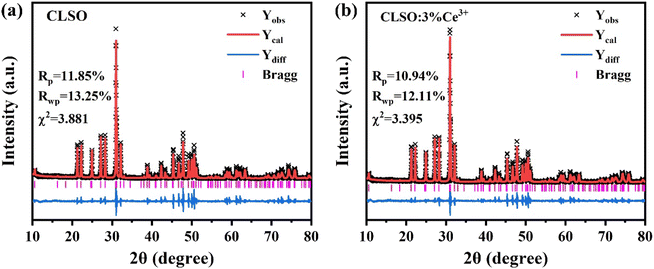 |
| | Fig. 2 Rietveld refinements of the XRD patterns for (a) CLSO and (b) CLSO:3%Ce3+ samples. | |
Table 1 Crystal structural data and atomic coordinates of CLSO as a result of Rietveld refinement
| Crystallographic data of CLSO |
Atomic coordinates and site occupancy fraction |
| Atom |
x |
y |
z |
SOF |
| Space group |
P63/m |
La1 |
0.3333 |
0.6666 |
0.0031 (1) |
0.522 (1) |
| a/Å |
9.6510 (1) |
Ca1 |
0.3333 |
0.6666 |
0.0031 (1) |
0.478 |
| b/Å |
9.6510 (1) |
La2 |
0.2460 (1) |
0.0142 (1) |
0.2500 |
0.983 (1) |
| c/Å |
7.1550 (1) |
Ca2 |
0.2460 (1) |
0.0142 (1) |
0.2500 |
0.017 |
| α/deg |
90 |
Si1 |
0.3758 (1) |
0.3976 (1) |
0.2500 |
1 |
| β/deg |
90 |
O1 |
0.4696 (4) |
0.5961 (4) |
0.2500 |
1 |
| γ/deg |
120 |
O2 |
0.4933 (4) |
0.3261 (4) |
0.2500 |
1 |
| V/Å3 |
577.1450 (3) |
O3 |
0.2561 (3) |
0.3419 (5) |
0.0693 (4) |
1 |
| Rp/% |
11.85 |
O4 |
0.0000 |
0.0000 |
0.2500 |
1 |
| Rwp/% |
13.25 |
|
|
|
|
|
| χ2 |
3.881 |
|
|
|
|
|
Table 2 Crystal structural data and atomic coordinates of CLSO:3%Ce3+ as a result of Rietveld refinement
| Crystallographic data of CLSO:3%Ce3+ |
Atomic coordinates and site occupancy fraction |
| Atom |
x |
y |
z |
SOF |
| Space group |
P63/m |
La1 |
0.3333 |
0.6666 |
0.0038 (1) |
0.4902 (1) |
| a/Å |
9.6505 (1) |
Ca1 |
0.3333 |
0.6666 |
0.0038 (1) |
0.4757 |
| b/Å |
9.6505 (1) |
La2 |
0.2449 (1) |
0.0151 (1) |
0.2500 |
0.9532 (1) |
| c/Å |
7.1460 (1) |
Ca2 |
0.2449 (1) |
0.0151 (1) |
0.2500 |
0.0142 |
| α/deg |
90 |
Si1 |
0.3785 (1) |
0.4069 (1) |
0.2500 |
1 |
| β/deg |
90 |
O1 |
0.4697 (4) |
0.5958 (4) |
0.2500 |
1 |
| γ/deg |
120 |
O2 |
0.4954 (4) |
0.3242 (4) |
0.2500 |
1 |
| V/Å3 |
576.5260 (3) |
O3 |
0.2594 (3) |
0.3464 (5) |
0.0692 (4) |
1 |
| Rp/% |
10.94 |
O4 |
0.0000 |
0.0000 |
0.2500 |
1 |
| Rwp/% |
12.11 |
Ce1 |
0.3333 |
0.6666 |
0.0038 (1) |
0.0341 |
| χ2 |
3.395 |
Ce2 |
0.2449 (1) |
0.0151 (1) |
0.2500 |
0.0326 |
Furthermore, on the basis of the refinement, calculations of the electronic band structure for CLSO were performed utilizing Materials Studio software in the CASTAP module, as exhibited in Fig. 3a, to investigate the promotion effect of the electron band environment on the luminescence. The top of the valence band and bottom of the conduction band were both situated at the G point in the Brillouin region, indicating that CLSO had a direct band gap.31 The computed result of Eg (4.612 eV) showed it belonged to an insulator material with a wide band gap.32,33 It is predicted that CLSO would be a good luminescent host possessing a sufficient energy gap to contain the energy levels of the luminescent ions, which would be favorable for energy absorption and utilization of the 4f–5d transition for rare earth ions with a broad band emission.34,35 The distributions of the total and partial density of states for the calculated electronic band structure in CLSO are shown in Fig. 3b. It could be further understood that the conduction band constituted the electronic orbital in the CaLa-4s 3d and Si-4s 3p states while the valence band involved the O-2s 2p electronic states.
 |
| | Fig. 3 (a) Band gap structure and energy value of the CLSO host. (b) Total and partial density of states (DOS) for CLSO by DFT calculations. (c) Diffuse reflectance spectra of CLSO; inset reveals the calculated Eg value obtained with the Kubelka–Munk function. | |
The experimental value of the band gap can be related to the diffuse reflectance spectra (Fig. 3c), and can be estimated through the equation:36
where
α is the absorption coefficient,
hν represents the photon energy, and
A is a proportional constant and the direct band gap for
n = 2. The value of
α is associated with the coefficient of reflection
R:
37| |
 | (2) |
The energy band value was determined to be 4.6 eV for the CLSO sample as shown in the inset (the diffuse reflectance spectra treated by the Kubelka–Munk function). The theoretical value based on DFT (4.612 eV) was almost equal to the experimental one, highlighting the consistency of the two results.
3.2 Luminescence properties of CLSO:Ce3+, CLSO:Tb3+ and CLSO:Sm3+
Fig. 4 presents the photoluminescence excitation and emission spectra of Ce3+/Tb3+/Sm3+ single-doped CLSO. At 390 nm emission wavelength, the excitation spectrum derived from the parity-allowed 4f–5d transitions of Ce3+ ion showed a broad band from 250 to 400 nm (Fig. 4a). Under 287 nm excitation, the Ce3+-doped CLSO demonstrated an intense emission spectrum involving an asymmetric emission band with a maximum at 390 nm, related to the transition from the excited state 5d to the doublet levels 2F7/2 and 2F5/2 of 4f. As displayed in Fig. 4b, the emission spectrum of Tb3+ was constituted by a cluster of strong lines at 491, 542, 583 and 624 nm on account of the characteristic emission for 5D4 → 7FJ (J = 6, 5, 4, and 3) excited at 377 nm, of which the green emission of 542 nm had the greatest intensity. Monitoring the dominant green emission, a PLE spectrum with a remarkable absorption line at 377 nm (the 7F6 → 5D3 transition) was obtained. In Fig. 4c, when monitored at 598 nm, the excitation spectrum of CLSO:Sm3+ appeared in the spectral range of 200–500 nm and included a sequence of narrow lines at 345 nm (6H5/2–4H7/2), 361 nm (6H5/2–4F9/2), 372 nm (6H5/2–4D5/2), 402 nm (6H5/2–4K11/2), 415 nm (6H5/2–6P5/2) and 474 nm (6H5/2–4I11/2), respectively. Upon the characteristic excitation, several emission bands at 564, 598 and 648 nm emerged in the PL spectrum, assigned to the transition of Sm3+ ion for 4G5/2 → 6H5/2, 4G5/2 → 6H7/2 and 4G5/2 → 6H9/2, respectively.
 |
| | Fig. 4 (a) Excitation and emission spectra of the CLSO:3%Ce3+ phosphor. (b) Excitation and emission spectra of the CLSO:9%Tb3+ phosphor. (c) Excitation and emission spectra of the CLSO:5%Sm3+ phosphor. | |
3.3 Luminescence properties and energy transfer of CLSO:Ce3+, Tb3+
The energy-transfer system involving double doping is a precondition for tri-doped systems, and correspondingly, the energy transfer from Ce3+ to Tb3+ is the primary area of concern here. To research the process in the CLSO host, the emission spectra with invariant Ce3+ concentration (3%) while altering the Tb3+ content were monitored, as shown in Fig. 5a; meanwhile Fig. 5b demonstrates the curve graphs of the variation in the emission intensity based on the Tb3+ contents. With the gradual augment of the Tb3+ content, the green emission strength derived from Tb3+ transition increased along with the decrease in the Ce3+ violet emission at 347 nm excitation. The enhanced green emission of 542 nm (Tb3+) by degree is the credit for the energy transfer of Ce3+ → Tb3+. The chromaticity coordinates for CLSO:3%Ce3+, y%Tb3+ as shown in Fig. 5c, were regulated from (0.276, 0.223) to (0.338, 0.567), displaying a color fluctuation from violet to green for y (1–13). All the relevant coordinate results are aggregated and listed in Table 3.
 |
| | Fig. 5 (a) Emission spectra of CLSO:3%Ce3+, y%Tb3+ (y = 1–13). (b) Variation in the emission intensity versus the Tb3+ content. (c) CIE chromaticity coordinates for these phosphors. | |
Table 3 CIE chromaticity coordinates for CLSO:3%Ce3+, y%Tb3+ phosphors
| Sample no. |
Sample |
CIE coordinates (x, y) |
| 1 |
CLSO:3%Ce3+, 1%Tb3+ |
(0.276, 0.223) |
| 2 |
CLSO:3%Ce3+, 5%Tb3+ |
(0.312, 0.355) |
| 3 |
CLSO:3%Ce3+, 9%Tb3+ |
(0.331, 0.425) |
| 4 |
CLSO:3%Ce3+, 11%Tb3+ |
(0.323, 0.524) |
| 5 |
CLSO:3%Ce3+, 13%Tb3+ |
(0.338, 0.567) |
The fluorescence lifetime of Ce3+ ions can be a direct response to the luminescence kinetics and energy transfer; therefore, the decay curves of the CLSO:3%Ce3+, y%Tb3+ (0–13) samples were explored as indicated in Fig. 6. The lifetime curve for the singly Ce3+-doped CLSO could be well fitted into a single-exponential function while that of the other co-doped samples could be well-explained by a double-exponential equation:
| |
I = I0![[thin space (1/6-em)]](https://www.rsc.org/images/entities/char_2009.gif) exp(−t/τ) exp(−t/τ)
| (3) |
| |
I = I0 + A1![[thin space (1/6-em)]](https://www.rsc.org/images/entities/char_2009.gif) exp(−t/τ1) + A2 exp(−t/τ1) + A2![[thin space (1/6-em)]](https://www.rsc.org/images/entities/char_2009.gif) exp(−t/τ2) exp(−t/τ2)
| (4) |
where
I0 and
I express the luminescence intensities at time 0 and
t, respectively, and
τ1 and
τ2 are the decay times for the exponential components, respectively. It can be found that as more Tb
3+ ions are brought in, the attenuation degree for the lifetime curves of Ce
3+ ion also increased by degrees. The different effective fluorescence lifetimes can be defined as:
38| |
 | (5) |
where
I(
t) expresses the intensity at time
t. The decay times of Ce
3+ ion were determined to be 25.71, 24.94, 23.93, 23.02, 22.92 and 21.73 ns, respectively, for the values of
y = 0, 1, 5, 9, 11, 13 for the Tb
3+ contents, whereby the tendency toward shorter lifetimes substantiated the energy-transfer process.
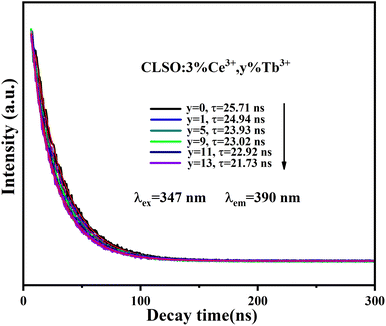 |
| | Fig. 6 Decay curves for Ce3+ emission from CLSO:3%Ce3+, y%Tb3+ (y = 0–13) (excited at 347 nm, monitored at 390 nm). | |
The energy-transfer efficiency (ηT) from the sensitizer (Ce3+) to activator (Tb3+) could be resolved based on the corresponding formula by Paulose et al.:39
| |
 | (6) |
where
ISO and
IS denote the luminous intensities of Ce
3+ in CLSO:3%Ce
3+ and CLSO:3%Ce
3+,
y%Tb
3+ (0–13), respectively. It could be inferred from
Fig. 7 that
ηT showed a trend of gradually rising with the increase in the introduced amount of Tb
3+ ions, ultimately approaching saturation. The maximum value of 70% for
ηT at
y = 0.13 revealed the efficient energy-transfer process.
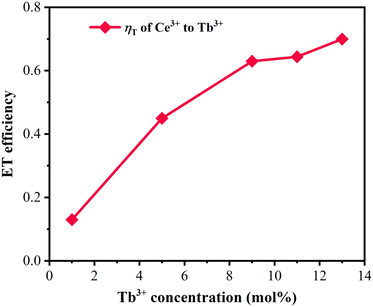 |
| | Fig. 7 Dependence of energy-transfer efficiency ηT on Tb3+ concentration. | |
3.4 Energy transfer for Tb3+ → Sm3+ in the CLSO host
The PL spectra with the constant Tb3+ amount and varied content of Sm3+ in the CLSO host at 377 nm excitation are depicted in Fig. 8a, while Fig. 8b demonstrates the curve graphs of the variation in emission intensity with the variation in Sm3+ content. In spite of the Tb3+ content remaining the same (9%), the green special emission (Tb3+) was reduced with the increase in Sm3+ concentration, while simultaneously, that of Sm3+ was promoted until a maximum value at y = 5, and then decreased. The color modulation of the CLSO:9%Tb3+, y%Sm3+ (y = 1–13) phosphor could also be demonstrated through the energy-transfer process, and the CIE graph is shown in Fig. 8c. The chromatic coordinates could be converted from green emission (0.403, 0.476) to yellow (0.393, 0.387) approaching white light in the wake of the Sm3+ content advancing in value of y from 1 to 13, as shown in Table 4. The fundamental findings suggest that white light emission could be anticipated for the Ce3+, Tb3+, Sm3+ tri-doped system.
 |
| | Fig. 8 (a) Emission spectra of CLSO:9%Tb3+, y%Sm3+ (y = 1–13). (b) Variation in emission intensity versus the Sm3+ content. (c) CIE chromaticity coordinates for these phosphors. | |
Table 4 CIE chromaticity coordinates for CLSO:9%Tb3+, y%Sm3+ Phosphors
| Sample no. |
Sample |
CIE coordinates (x, y) |
| 1 |
CLSO:9%Tb3+, 1%Sm3+ |
(0.403, 0.476) |
| 2 |
CLSO:9%Tb3+, 5%Sm3+ |
(0.420, 0.454) |
| 3 |
CLSO:9%Tb3+, 7%Sm3+ |
(0.435, 0.435) |
| 4 |
CLSO:9%Tb3+, 9%Sm3+ |
(0.422, 0.421) |
| 5 |
CLSO:9%Tb3+, 11%Sm3+ |
(0.402, 0.398) |
| 6 |
CLSO:9%Tb3+, 13%Sm3+ |
(0.393, 0.387) |
The lifetime curves of Tb3+ ions monitored at the emission wavelength of 542 nm with varying the content of Sm3+ ions were evaluated to explore the energy transfer from Tb3+ to Sm3+ in CLSO. As demonstrated in Fig. 9, the decay curve for singly Tb3+-doped CLSO could be well fitted into a single-exponential function, eqn (3), while that of the other co-doped samples could be well-explained by a double-exponential equation, eqn (4). The effective lifetimes were determined to be 2.102, 2.029, 2.014, 1.905, 1.814, 1.728 and 1.701 ms, respectively, by means of eqn (5), showing a decrease when more Sm3+ ions were imported as 0%, 1%, 5%, 7%, 9%, 11% and 13% mol concentrations, which strongly indicated that Tb3+ could effectively transfer energy to Sm3+. The ET efficiencies of Tb3+ → Sm3+ were also resolved using eqn (6), as shown in the trend curve of Fig. 10, from which one can note the continuous growth of ηT with the Sm3+ concentrations rising, with the greatest value of 90% obtained at y = 13.
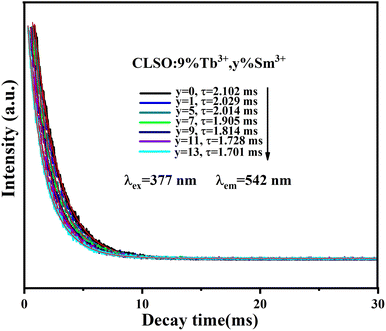 |
| | Fig. 9 Decay curves for Tb3+ emission from CLSO:9%Tb3+, y%Sm3+ (y = 0–13) (excited at 377 nm, monitored at 542 nm). | |
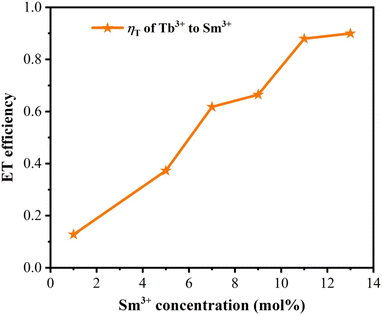 |
| | Fig. 10 Dependence of the energy-transfer efficiency ηT on Sm3+ concentration. | |
3.5 Energy-transfer mechanism and white light emission for CLSO:Ce3+, Tb3+, Sm3+
The white light emission for the energy-transfer system with the tri-doped single substrate can drive innovation for high-quality w-LEDs. As contrasted in Fig. 11a, the excitation spectrum for CLSO:3%Ce3+, 9%Tb3+, 7%Sm3+ with the emission of Sm3+ monitored at 598 nm mainly comprised the absorption bands of Ce3+, Tb3+ and Sm3+ ions. Meanwhile, under particular excitation (347 nm), the three characteristic emission bands of Ce3+, Tb3+ and Sm3+ were produced simultaneously. Accordingly, the emission spectra with fixing the contents of Ce3+ and Tb3+ at 3% and 9%, and varying the Sm3+ concentration were obtained, as shown in Fig. 11b. Meanwhile Fig. 11c presents the curve graphs for the change in the intensity as a function of the Sm3+ concentration. With an increase in Sm3+ ions, Ce3+/Tb3+ emission was weakened, while Sm3+ emission was elevated until y = 7, which was a consequence of energy transfer for the Ce3+ → Tb3+ → Sm3+ tri-doped system. The process causes the CLSO:3%Ce3+, 9%Tb3+, y%Sm3+ system to vary in the blue to white zones with varying the Sm3+ ion concentration, with white light emission arising at y = 7 and 9, while the relevant coordinate were (0.295, 0.285) and (0.284, 0.280), respectively, as shown in Fig. 11d and Table 5.
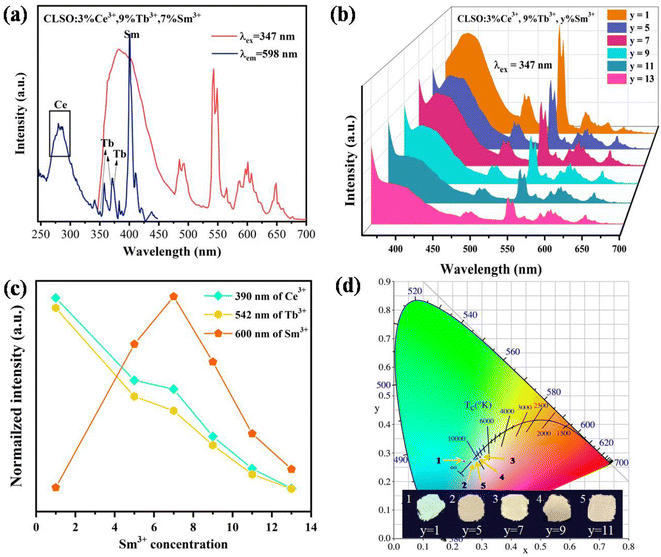 |
| | Fig. 11 (a) PLE spectrum and PL spectrum for CLSO:3%Ce3+, 9%Tb3+, 7%Sm3+ samples. (b) PL spectra of CLSO:3%Ce3+, 9%Tb3+, y%Sm3+ (y = 1–13) samples. (c) Changes in the intensity as a function of the Sm3+ concentration. (d) CIE chromaticity coordinates for the corresponding phosphors. | |
Table 5 CIE chromaticity coordinates for CLSO:3%Ce3+, 9%Tb3+, y%Sm3+ phosphors
| Sample no. |
Sample |
CIE coordinates (x, y) |
| 1 |
CLSO:3%Ce3+, 9%Tb3+, 1%Sm3+ |
(0.240, 0.270) |
| 2 |
CLSO:3%Ce3+, 9%Tb3+, 5%Sm3+ |
(0.268, 0.272) |
| 3 |
CLSO:3%Ce3+, 9%Tb3+, 7%Sm3+ |
(0.295, 0.285) |
| 4 |
CLSO:3%Ce3+, 9%Tb3+, 9%Sm3+ |
(0.284, 0.280) |
| 5 |
CLSO:3%Ce3+, 9%Tb3+, 11%Sm3+ |
(0.277, 0.276) |
The lifetime curves of Ce3+ in CLSO:3%Ce3+, 9%Tb3+, y%Sm3+ were also assessed to validate the energy transfer for Ce3+ → Tb3+ → Sm3+(Fig. 12), and the decay curve for the Ce3+, Tb3+ co-doped CLSO could be well fitted with a double-exponential function, eqn (4), while that of the other tri-doped samples could be well-explained by a triple-exponential equation as follows:
| |
I = I0 + A1![[thin space (1/6-em)]](https://www.rsc.org/images/entities/char_2009.gif) exp(−t/τ1) + A2 exp(−t/τ1) + A2![[thin space (1/6-em)]](https://www.rsc.org/images/entities/char_2009.gif) exp(−t/τ2) + A3 exp(−t/τ2) + A3![[thin space (1/6-em)]](https://www.rsc.org/images/entities/char_2009.gif) exp(−t/τ3) exp(−t/τ3)
| (7) |
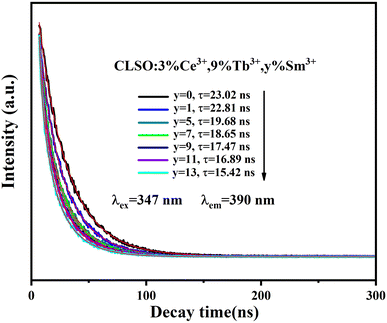 |
| | Fig. 12 Decay curves for Ce3+ emission from CLSO:3%Ce3+, 9%Tb3+, y%Sm3+ (y = 0–13) (excited at 347 nm, monitored at 390 nm). | |
In a previous study, the existence of three luminescence centers and their energy transfer were preliminarily proved by the excitation spectrum of a CLSO:3%Ce3+, 9%Tb3+, 7%Sm3+ sample (Fig. 11a) and emission spectra of CLSO:3%Ce3+, 9%Tb3+, y%Sm3+ (y = 1–13) samples (Fig. 11b). Therefore, the decay curves (value) for CLSO:3%Ce3+, 9%Tb3+, y%Sm3+ (y = 1–13) should be made up of three parts: the emission from Ce3+ ions (luminescence center 1), the effect from Tb3+ ion emission (luminescence center 2) and the effect from Sm3+ ion emission (luminescence center 3), and the three luminescence centers work together (the energy transfer effect) to determine the final decay curves (value). Hence, the decay curve for the tri-doped samples could be well-explained by a triple-exponential equation, indicating that the decay curves can be determined and influenced by the three luminescence centers. The τ values were determined to be 23.02, 22.81, 19.68, 18.65, 17.47, 16.89 and 15.42 ns, respectively (with y = 0, 1, 5, 7, 9, 11, 13 for the Sm3+ content). The increasing of attenuation for Ce3+ with more Sm3+ ions launching is the embodiment of energy transfer for tri-doped system.
A schematic model of the energy level is exhibited in Fig. 13 and briefly shows the photoelectron transitions and energy transfer in the Ce3+, Tb3+ and Sm3+ tri-doped CLSO. Upon 347 nm excitation, the ground state electrons in Ce3+ ions were excited to the excited state (5d) and subsequently attenuated to the lowest excited band. Then a portion of the excited electrons fall back to the 4f ground level for 2F5/2 and 2F7/2, producing the bandwidth blue-violet emission of Ce3+ ions. The energy transfer for Ce3+ → Tb3+ → Sm3+ in the tri-doped system is the result of the following three processes: (1) While the other portion of the excited electrons for Ce3+ ions might transfer energy to Tb3+ firstly, this happens due to the overlapping of Ce3+ emission spectrum and Tb3+ excitation spectrum (Ce3+ → Tb3+), and then from the 5D4 state for Tb3+ ions eventually to Sm3+ corresponding to the ignorable energy discrepancy between Tb3+ and Sm3+, wherein Tb3+ ions having the function of transmission intermediary. This can be expressed as Ce3+ → Tb3+ → Sm3+. (2) Moreover, Tb3+ can also transfer self-absorbed energy to Sm3+ (the energy Tb3+ absorbs from ultraviolet light), expressed as Tb3+ → Sm3+. (3) The process where Ce3+ directly transfers energy to Sm3+ and not via Tb3+ is non-negligible, and happens due to the overlapping of the Ce3+ emission spectrum and Sm3+ excitation spectrum, expressed as Ce3+ → Sm3+. The Sm3+ emission intensity heightening and that of Ce3+, Tb3+ being in the opposite direction are the effects of the combined actions in the three-step energy transfer approach. Ultimately, white light emission is realized based on the strength of the energy transfer for Ce3+ → Tb3+ → Sm3+ in the tri-doped system.
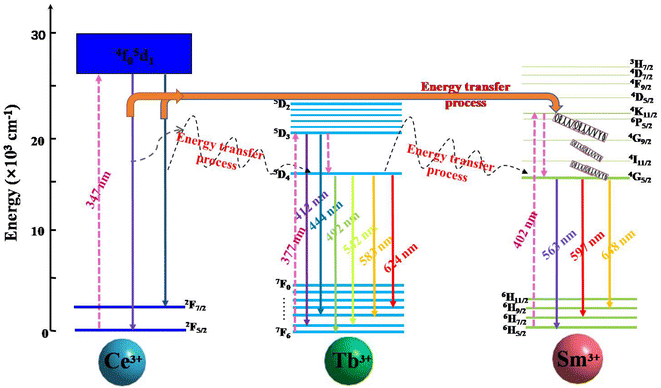 |
| | Fig. 13 Proposed energy-level mechanism diagram for energy transfer for Ce3+ → Tb3+ → Sm3+ in the CLSO tri-doped system. | |
3.6 Performance of LED prototypes
Abundant research work should be devoted to the thermal quenching effect of phosphors, since LED devices usually operate at higher temperature. As shown in Fig. 14, the emission spectra in the case of variable temperature for CLSO:3%Ce3+, 9%Tb3+, y%Sm3+ (y = 7, 9) phosphors were measured. A similar thermal stability was embodied in the emission intensities of the two samples with the temperature increasing. The phosphor CLSO:3%Ce3+, 9%Tb3+, 9%Sm3+ displayed no significant differences in the blue, green and red characteristic emission bands with increasing the temperature from 298 to 473 K. While the relative intensity for Ce3+ ions still maintained 75% of the initial value recorded at 473 K, in contrast Tb3+ and Sm3+ emission declined slightly more, but still preserved 65% and 60% of their initial values. Overall, the intensity of CLSO:3%Ce3+, 9%Tb3+, y%Sm3+ (y = 7, 9) phosphors decreased to a slight degree with the temperature rising. The Arrhenius equation can be employed to determine the activation energy barrier (ΔE) for further explaining the thermal quenching process:40| |
 | (8) |
where, I0 is the initial intensity; I is the emission intensity at a certain temperature, C is a constant and k is Boltzmann's constant. The linear fitting of ln[(I0/I) − 1] and 1/kT in Fig. 14e and f manifested that the activation energy for CLSO:3%Ce3+, 9%Tb3+, y%Sm3+ (y = 7, 9) was 0.205 eV and 0.223 eV, respectively. In recent years, some excellent phosphors have been reported, such as Ca2YZr2(AlO4)3:Ce3+, Tb3+,41 Tb3Al5O12:Ce3+, Mn2+,20 K2NbF7:Mn4+,42 their emission intensity has declined to below 60% of the initial value at 393 K. Therefore, compared with these representative phosphors, it was shown that the CLSO:3%Ce3+, 9%Tb3+, y%Sm3+ (y = 7, 9) phosphors had excellent thermal stability.
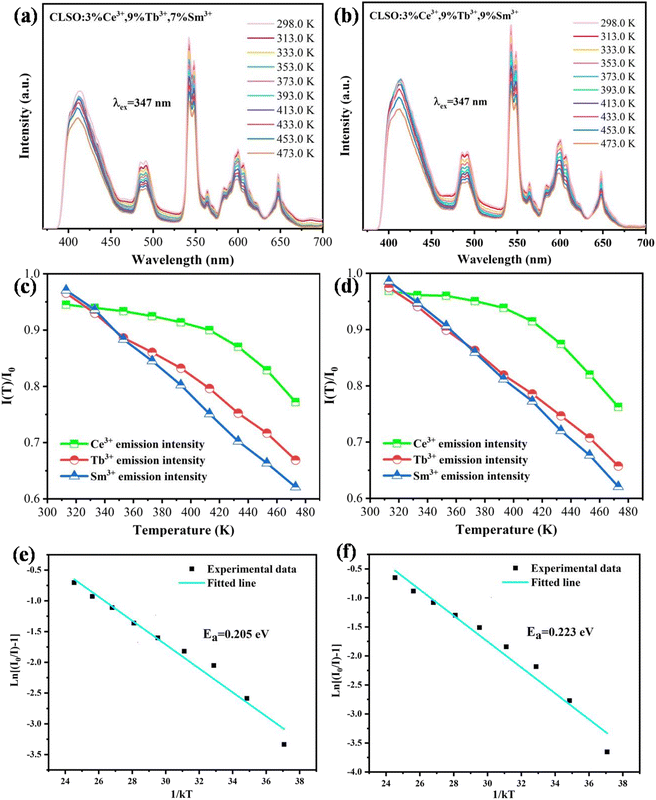 |
| | Fig. 14 Temperature-dependent emission spectra for (a) CLSO:3%Ce3+, 9%Tb3+, 7%Sm3+ and (b) CLSO:3%Ce3+, 9%Tb3+, 9%Sm3+ phosphors excited at 347 nm. Temperature-dependent normalized PL intensities of Ce3+, Tb3+ and Sm3+ in (c) CLSO:3%Ce3+, 9%Tb3+, 7%Sm3+ and (d) CLSO:3%Ce3+, 9%Tb3+, 9%Sm3+. ln[(I0/I) − 1] versus 1/kT plot and the activation energy of (e) CLSO:3%Ce3+, 9%Tb3+, 7%Sm3+ and (f) CLSO:3%Ce3+, 9%Tb3+, 9%Sm3+ phosphors. | |
We attempted to manufacture prototypes of white LED single beads by coating CLSO:3%Ce3+, 9%Tb3+, y%Sm3+ (y = 7, 9) phosphors on commercial 360 nm UV chips, which gives impetus to the practical application of phosphors. The electroluminescence spectra and physical photographs for two LED devices at 20 mA forward bias current are shown in Fig. 15. It was apparent that the spectra had no disparity compared with the emission spectra of phosphors, comprising a blue-green-red emission band within the coverage for the entire visible region, which originated from the emission of Ce3+, Tb3+ and Sm3+ ions in CLSO:3%Ce3+, 9%Tb3+, y%Sm3+ (y = 7, 9), respectively. The as-fabricated LED lamps emitted bright white light and the corresponding test parameters are shown in the illustration. The findings reveal that the two fabricated LED devices had chromaticity coordinates for the white light region, and the CCT and CRI were 3586 K, 81.0 (a), 3307 K, 78.5 (b), that is, normal white light and warm white light, respectively.43,44 In relative terms, the white LED (a) was the more ideal one. Compared with current commercial white LEDs (YAG:Ce3+ + blue chip, CRI < 80, CCT ≈ 7750 K, a cool color white), a red component was added, and the CCT for 3586 K was advanced but slightly warmer (daily lighting white: 4000–5500 K), while the CRI for 81 is improved. These performances suggest that the CLSO:3%Ce3+, 9%Tb3+, y%Sm3+ (y = 7, 9) were favorable for providing high-quality white emission to apply in w-LEDs with UV chip excitation.
 |
| | Fig. 15 Electroluminescence spectra and photographs of white LED prototypes fabricated by combining a 360 nm UV chip with (a) CLSO:3%Ce3+, 9%Tb3+, 7%Sm3+ and (b) CLSO:3%Ce3+, 9%Tb3+, 9%Sm3+ phosphors. (c) CIE chromaticity coordinates for corresponding WLED devices. | |
4. Conclusion
In this paper, single-phase CaLa4(SiO4)3O:Ce3+, Tb3+, Sm3+ phosphors inducing white emission via the ET process for Ce3+ → Tb3+ → Sm3+ were successfully prepared. The Rietveld refinement demonstrated the dependability of the obtained crystal structure and the band gap energy was about 4.612 eV according to DFT calculations. Since Tb3+ ions were sensitized by Ce3+ ions and Sm3+ ions were sensitized by Ce3+ and Tb3+ ions, energy transfer could occur in the tri-doped system, and the ET processes for Ce3+ → Tb3+, Tb3+ → Sm3+ and Ce3+ → Tb3+ → Sm3+ were explored in detail. The single-phase white emission was successfully promoted by means of the above ET process in the tri-doped system. Moreover, the emission intensity of CLSO:3%Ce3+, 9%Tb3+, y%Sm3+ (y = 7, 9) still maintained 75% of the initial value with the temperature rising from 298 to 473 K, indicating a prominent thermal quenching resistance. Finally, prototype WLED devices involving CLSO:3%Ce3+, 9%Tb3+, y%Sm3+ (y = 7, 9) phosphors were developed and tested, and the LED lamps displayed bright white light, with CCT = 3586 K, 3307 K and CRI = 81.0, 78.5, respectively. These results demonstrate the potential application value for the Ce3+, Tb3+, Sm3+ tri-doped single-phase phosphor in pc-WLEDs.
Conflicts of interest
There are no conflicts to declare.
Acknowledgements
This funding for the present work is supported by the Free Exploration Basic Research Project of Jilin Province Office of Science and Technology, China (YDZJ202201ZYTS649), the Major Project for the Field (2016009), Jilin Institute of Chemical Technology and Fundamental Research Cultivating Fund, Jilin Institute of Chemical Technology.
References
- Z. Xia, Z. Xu, M. Chen and Q. Liu, Dalton Trans., 2016, 45, 11214–11232 RSC.
- S. Gu, M. Xia, C. Zhou, Z. Kong, M. S. Molokeev, L. Liu, W.-Y. Wong and Z. Zhou, Chem. Eng. J., 2020, 396, 125208 CrossRef CAS.
- Y. Zhu, L. Fu, D. Wu, J. Peng, F. Du, X. Ye, L. Chen and W. Zhuang, J. Lumin., 2021, 232, 117854 CrossRef CAS.
- D. Wu, L. Fu, S. He, F. Xu, L. Liu, L. Yao, F. Du, J. Peng and X. Ye, Ceram. Int., 2020, 46, 25382–25391 CrossRef CAS.
- X. Huang, S. Han, W. Huang and X. Liu, Chem. Soc. Rev., 2013, 42, 173–201 RSC.
- X. Zhang, L. Huang, F. Pan, M. Wu, J. Wang, Y. Chen and Q. Su, ACS Appl. Mater. Interfaces, 2014, 6, 2709–2717 CrossRef CAS PubMed.
- P. Pust, P. J. Schmidt and W. Schnick, Nat. Mater., 2015, 14, 454–458 CrossRef CAS PubMed.
- S. Wu, P. Xiong, X. Liu, Y. Fu, Q. Liu, Y. Chao, Q. Dong, Y. Li, W. Chen, Y. Chen, Z. Ma and M. Peng, J. Mater. Chem. C, 2021, 9, 3672–3681 RSC.
- W. Yan, Y. Wei, M. S. Molokeev, S. Wang and G. Li, J. Alloys Compd., 2022, 908, 164621 CrossRef CAS.
- H. D. Nguyen, C. C. Lin and R. S. Liu, Angew. Chem., Int. Ed., 2015, 54, 10862–10866 CrossRef CAS PubMed.
- D. Liu, X. Yun, P. Dang, H. Lian, M. Shang, G. Li and J. Lin, Chem. Mater., 2020, 32, 3065–3077 CrossRef CAS.
- X. Yu, D. Yuan and X. Mi, J. Alloys Compd., 2021, 857, 157585 CrossRef CAS.
- G. Li, Z. Hou, C. Peng, W. Wang, Z. Cheng, C. Li, H. Lian and J. Lin, Adv. Funct. Mater., 2010, 20, 3446–3456 CrossRef CAS.
- X. Li, L. Zhou, J. Hong, S. He, X. Jing, M. D. Dramićanin, J. Shi and M. Wu, J. Mater. Chem. C, 2020, 8, 6715–6723 RSC.
- J. Long, F. Chu, Y. Wang, C. Zhao, W. Dong, X. Yuan, C. Ma, Z. Wen, R. Ma, M. Du and Y. Cao, Inorg. Chem., 2017, 56, 10381–10386 CrossRef CAS PubMed.
- J. Zhang and C. Jiang, Mater. Res. Bull., 2014, 60, 467–473 CrossRef CAS.
- Y. Kawano, S. W. Kim, T. Ishigaki, K. Uematsu, K. Toda, H. Takaba and M. Sato, Opt. Mater. Express, 2014, 4, 1770–1774 CrossRef CAS.
- L.-F. Liu, G.-G. Wang, Q. Yang, B. Yan, H.-Y. Zhang and J.-C. Han, Ceram. Int., 2018, 44, 11693–11701 CrossRef CAS.
- C. Xu, Y. Song, H. Guan, Y. Sheng, P. Ma, X. Zhou, Z. Shi and H. Zou, Phys. Chem. Chem. Phys., 2017, 19, 22197–22209 RSC.
- Y. Duan, C. Zhao, H. Lin, R. Hong, C. Tao, Z. Han, D. Zhang and S. Zhou, Opt. Mater., 2021, 111, 110670 CrossRef CAS.
- S. Shimono, T. Izaki, N. Tanaka, Y. Nanai, T. Morimoto, H. Kishimura and A. Aruga, Mater. Res. Bull., 2021, 143, 111441 CrossRef CAS.
- Y. Xiang, Z. Y. Liu, Y. Gao, L. Feng, T. Zhou, M. J. Liu, Y. Zhao and D. J. Gao, Chem. Eng. J., 2023, 456, 140901 CrossRef CAS.
- Y. Zhang, Y. Liang, S. Miao, D. Chen, S. Yan and J. Liu, Inorg. Chem. Front., 2021, 8, 5186–5194 RSC.
- N. Liu, L. Mei, L. Liao, J. Fu and D. Yang, Sci. Rep., 2019, 9, 15509 CrossRef PubMed.
- H. Liu, L. Liao, M. S. Molokeev, Q. Guo, Y. Zhang and L. Mei, RSC Adv., 2016, 6, 24577–24583 RSC.
- K. Li, J. Fan, M. Shang, H. Lian and J. Lin, J. Mater. Chem. C, 2015, 3, 9989–9998 RSC.
- S. Unithrattil, H. J. Kim, K. H. Gil, N. H. Vu, V. H. Hoang, Y. H. Kim, P. Arunkumar and W. B. Im, Inorg. Chem., 2017, 56, 5696–5703 CrossRef CAS PubMed.
- X. Zhang, Q. Liu, J.-W. Luo, A. J. Freeman and A. Zunger, Nat. Phys., 2014, 10, 387–393 Search PubMed.
- X. Q. Wang, X. M. Han and C. M. Zhen, J. Nanosci. Nanotechnol., 2011, 11, 9714–9716 CrossRef CAS PubMed.
- X. Chen, Z. Xia and Q. Liu, Dalton Trans., 2014, 43, 13370–13376 RSC.
- M. A. L. Marques, J. Vidal, M. J. T. Oliveira, L. Reining and S. Botti, Phys. Rev. B: Condens. Matter Mater. Phys., 2011, 83, 035119 CrossRef.
- Z. Jiang, Y. Wang, Z. Ci and H. Jiao, J. Electrochem. Soc., 2009, 156, J317–J320 CrossRef CAS.
- M. Pepper, Contemp. Phys., 1979, 20, 483–485 CrossRef.
- Z. G. Xia, C. G. Ma, M. S. Molokeev, Q. L. Liu, K. Ricket and K. R. Poeppelmeier, J. Am. Chem. Soc., 2015, 137, 12494–12497 CrossRef CAS PubMed.
- Y. Wang, J. Ding and Y. Wang, J. Phys. Chem. C, 2017, 121, 27018–27028 CrossRef CAS.
- M. Zhao, H. Liao, L. Ning, Q. Zhang, Q. Liu and Z. Xia, Adv. Mater., 2018, 30, 1802489 CrossRef PubMed.
- N. Zhang, J. Zheng, J. Gao, Y. Wu, R. Zhang, T. Li and C. Guo, Dyes Pigm., 2017, 136, 601–611 CrossRef CAS.
- D. Wu, Y. Xiao, L. Zhang, X. Dong, S. Zhao, W. Zhou, Q. Lu and J. Zhang, J. Mater. Chem. C, 2020, 8, 17176–17184 RSC.
- P. I. Paulose, G. Jose, V. Thomas, N. V. Unnikrishnan and M. K. R. Warrier, J. Phys. Chem. Solids, 2003, 64, 841–846 CrossRef CAS.
- A. Zhang, M. Jia, Z. Sun, G. Liu, Z. Fu, T. Sheng, P. Li and F. Lin, J. Alloys Compd., 2019, 782, 203–208 CrossRef CAS.
- L. L. Sun, B. Devakumar, J. Liang, S. Y. Wang, Q. Sun and X. Y. Huang, J. Mater. Chem. C, 2019, 7, 10471–10480 RSC.
- J. Wu, Z. Y. Li, L. Luo, Y. H. Xiong, L. Y. Jiang, R. Guo and L. L. Meng, J. Alloys Compd., 2021, 863, 158058 CrossRef CAS.
- L. Zhou, P. Du, W. Li and L. Luo, New J. Chem., 2019, 43, 16445–16453 RSC.
- X. Zhang, Z. An, R. Dong, Y. Song, K. Zheng, Y. Sheng, Z. Shi and H. Zou, ACS Sustainable Chem. Eng., 2019, 7, 10724–10733 CrossRef CAS.
|
| This journal is © The Royal Society of Chemistry 2024 |
 Open Access Article
 *a,
Jiaxuan Goua,
Chaochao Qia,
Li Konga,
Mingyang Qua,
Guoyan Luana and
Xiangting Zhangb


![[thin space (1/6-em)]](https://www.rsc.org/images/entities/char_2009.gif) exp(−t/τ)
exp(−t/τ)
![[thin space (1/6-em)]](https://www.rsc.org/images/entities/char_2009.gif) exp(−t/τ1) + A2
exp(−t/τ1) + A2![[thin space (1/6-em)]](https://www.rsc.org/images/entities/char_2009.gif) exp(−t/τ2)
exp(−t/τ2)


![[thin space (1/6-em)]](https://www.rsc.org/images/entities/char_2009.gif) exp(−t/τ1) + A2
exp(−t/τ1) + A2![[thin space (1/6-em)]](https://www.rsc.org/images/entities/char_2009.gif) exp(−t/τ2) + A3
exp(−t/τ2) + A3![[thin space (1/6-em)]](https://www.rsc.org/images/entities/char_2009.gif) exp(−t/τ3)
exp(−t/τ3)


