 Open Access Article
Hydrothermal synthesis of B, S, and N-doped carbon quantum dots for colorimetric sensing of heavy metal ions†
Aysenur Aygun,
Ipek Cobas,
Rima Nour Elhouda Tiri and
Fatih Sen *
*
Sen Research Group, Department of Biochemistry, Dumlupinar University, 43000 Kutahya, Turkey. E-mail: fatihsen1980@gmail.com
First published on 4th April 2024
Abstract
In this study, glucose was used as the carbon source to synthesize carbon quantum dots (CQDs) and also aimed to synthesize CQDs doped with heteroatoms such as sulphur, nitrogen, and boron to enhance their functionality. The obtained material has been characterized by several techniques. According to FL analysis, the highest peaks for CQD, N-CQD, B-CQD, and S-CQD were determined as 432 nm (ex 350), 425 (ex 350), 430 nm (ex 340 nm), and 436 nm (ex 340 nm), respectively. FTIR spectra showed different characteristic peaks for CQD, and the FTIR results show that CQDs have a unique structure. According to TEM analysis, the morphology of all CQDs was found to be spherical and monodisperse with average sizes in the range of 5–7 nm. The characterization results of CQDs show that the addition of heteroatoms changes the properties of CQDs. The synthesized CQDs were also tested as colorimetric sensors for the detection of heavy metals. It was observed that CQDs detected Fe3+ metal ions, B-CQD and S-CQD detected Fe3+ and Ag+ metal ions, and N-CQDs detected Ca2+ metal ions. Sensor studies were performed for all CQDs and linear plots were obtained against metal concentrations in the range of 0.06–1.23 μM. LOD values for CQD, N-CQD, S-CQD, and B-CQD were calculated as 0.187 μM (Fe3+), 0.391 μM (Ca2+), 0.224 μM (Fe3+)–0.442 μM (Ag+), and 0.182 μM (Fe3+)–0.174 μM (Ag+), respectively. The results show that the addition of B, N, and S atoms to CQDs plays a role in the improvement and modification of colorimetric sensor properties and has the potential to be used in sensor applications for the detection of heavy metals in areas such as the environment and health.
1. Introduction
The fast growth of technology has made human activities significantly contribute to the global generation of environmental pollution. The contamination by heavy metal is a global concern due to the potentially harmful consequences.1 It is evident to all that heavy metals do not biodegrade. Therefore, if heavy metal elements are directly dumped into rivers or the soil, the ecosystem may become severely contaminated. Such heavy metal ions can be enriched thousands of times before they eventually enter the human body because of the biological amplification effect of the biological chain. For example, heavy metal poisoning in humans can cause a lot of symptoms, from bone discomfort to unusual disorders like Minamata sickness and even death, if heavy metal ions build up in fish or are absorbed by rice or other crops and then consumed by humans.2 Furthermore, the human body experiences a strong interaction between heavy metal ions and proteins, or enzymes, which causes the protein to lose function and eventually leads to chronic poisoning.3 Determining the concentration of heavy metal ions is of tremendous importance since some metals, while highly significant for biological systems, may be poisonous in large quantities and cause major harm to individuals and the environment. Fe3+ plays an important role in biological systems by participating in the structure of regulatory proteins. Additionally, Fe3+ concentration is an important marker for Parkinson's disease.4 However, excess Fe3+ ions cause excessive production of free radicals, which can induce cytotoxicity. Therefore, Fe3+ detection and environmental monitoring in biological systems are of great importance.5,6 Silver (Ag) metal is frequently preferred in antibacterial applications, medicine, and cosmetics due to its properties. However, concentrations of Ag metal above a certain level have harmful effects on humans.7 High quantities of Ag metal in the body may cause enzymes containing sulfhydryl groups to become inactive.8 Additionally, depending on the accumulation of Ag metal, it can cause argentosis, stomach pain, skin irritation, cell membrane damage, organ edema, and even death.9 The most common cation in the body is the calcium(II) ion, which plays a variety of roles in the actions of muscles, nerves, and bone construction. It is also involved in other biological processes. The blood level of calcium in a healthy individual is within a tightly controlled range of 2.1–2.6 mM, with variations not exceeding 3%. Numerous disorders, such as malignant tumors, hyperthyroidism, and primary hyperparathyroidism, can be linked to changes in calcium levels.10 Therefore, there is a need for rapid and accurate determination of Ca level. Consequently, there has been a growing focus on heavy metal detection in recent years.11 Progress in scientific studies and nanotechnology continues to find solutions or facilitate the resolution of obstacles that were previously considered complex or difficult to solve.12 Nowadays, nanotechnology is linked and developed in different fields such as medicine, biology, and chemistry.13 Therefore, the use of nanomaterials in sensor systems is very popular.Colorimetric sensors are among the most frequently used methods in detecting heavy metals due to their simplicity, easy use, and rapid and on-site detection.14 Many sensor methods have been developed for the detection of heavy metal ions, such as atomic absorption spectrometry,15 electrochemistry,16 fluorescence,17,18 inductively coupled plasma mass spectrometry,19 ion printing technology,20 and surface-enhanced Raman scattering (SERS).21 However, these methods have disadvantages such as expensive and sensitive devices, complex procedures, and limitations in the laboratory. Colorimetric sensors provide a great advantage in their ability to be detected quickly and with the naked eye.22 Quantum dots (QDs) are among the nanomaterials used for colorimetric detection of heavy metals. Two detection mechanisms can be mentioned for colorimetric detection for CQDs. This detection mechanism is the growth of quantum dots induced by heavy metal ions or the interaction of quantum dots with heavy metal ions.14
Fluorescent nanomaterials are increasingly the subject of multiple studies given their optical properties.23,24 Carbon quantum dots (QDCs) are semiconductor nanostructures with a core made of graphitic carbon.25 They are well known for their use in imaging, as tracers and can be integrated into photovoltaic devices, due to their high stability and low toxicity.26–30 A lot of study has been done on the viability of applying CQDs in sensing applications for the identification of environmental contaminants such as cations, anions, biomolecules, and tiny organic pollutants (pesticides and herbicides).31 It has been established that using natural resources to produce CQDs through green synthesis is an appropriate and environmental method.32 The large-scale production of CQDs by this synthesis method is due to its economic viability and the accessibility of cheap and readily available precursors and waste sources. Consequently, this will facilitate trash management as well.
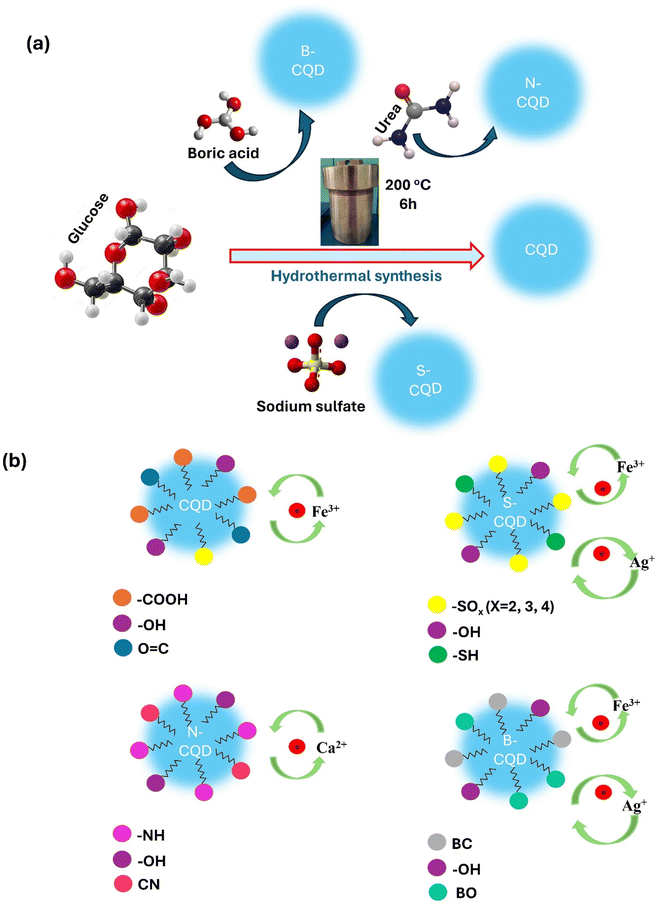
In the current study, the synthesized carbon dots (CQD) using glucose as a carbon source and doped with heteroatoms such as sulphur, boron, and nitrogen (Scheme 1a). All obtained CQDs were characterized by various methods and the effect of heteroatom doping on heavy metal sensing capacity and colorimetric sensor applications was investigated (Scheme 1b). Comparative colorimetric detection properties of N-CQDs, B-CQDs, and S-CQDs obtained by adding different atoms to CQDs were examined for the first time in this study. It was observed that metal doping added to CQDs was effective in improving or differentiating the sensor properties of CQDs. It can be said that the reason for this is related to the differences in the functional groups added to CQDs and the molecular orbital energy diagrams of the added metals.
2. Experimental
2.1. CQDs's preparation
Using a one-step hydrothermal procedure, CQDs were created from an aqueous glucose solution doped with boric acid, urea, and sodium sulfate as sources of boron, sulphur, and nitrogen, respectively.33 In total, 0.5 g of doping formulation and 1 g of glucose were dissolved in 60 mL of deionized water with stirring. The mixture was then transferred to a 100 mL stainless steel reactor lined with polytetrafluoroethylene (Teflon) and allowed to react at 200 °C for six hours. To remove unreacted components, the reaction product was centrifuged for 30 min at 10![[thin space (1/6-em)]](https://www.rsc.org/images/entities/char_2009.gif) 000 rpm after cooling. After that, contaminants were removed from the supernatant by filtering it using a syringe filter (25 mm diameter nylon filter, pore size: 0.22 μM). The same processes were carried out without the use of an additive to generate glucose-carbon dots (CQDs). Depending on the type of dopant, the CDs created were labelled CQD, B-CQD, S-CQD, and N-CQD.
000 rpm after cooling. After that, contaminants were removed from the supernatant by filtering it using a syringe filter (25 mm diameter nylon filter, pore size: 0.22 μM). The same processes were carried out without the use of an additive to generate glucose-carbon dots (CQDs). Depending on the type of dopant, the CDs created were labelled CQD, B-CQD, S-CQD, and N-CQD.
2.2. Characterization methods
The CQDs, B-GCD, S-GCD, and N-GCD were characterized using different methods. FTIR analysis (PerkinElmer Spectrum Two) was performed in 400–4000 cm−1. A PerkinElmer Lambda 750 spectrophotometer was used to analyse the UV-vis spectra in the wavelength range 200–800 nm. A PerkinElmer LS55 fluorescence spectrophotometer was used to determine the FL spectra of all CQDs. Particle morphology and size of all CQDs were determined using JEOL JEM 1220 TEM.2.3. Sensor study
100 μM concentration of different metal ions (Co2+, Cu2+, Zn2+, and Fe3+, Ca2+, Mn2+, Ni2+, K+, Ag+) were added to 1.5 mL CQDs, and color changes were observed after 2 min. UV-vis analysis of pure CQDs and CQDs containing metal ions were then performed. The metal ions with color change were confirmed by UV-vis analysis and the different concentration has been studied. The concentration of metal ions in the analyze range of 0.06–1.23 μM was detected by CQDs. The absorbance values in the UV-vis spectrum of CQDs containing different concentrations of metal ions were analyzed. The same procedures were performed for B-CQDs, S-CQDs and N-CQDs.2.4. Real time sample analysis
Tap water samples taken from our laboratory (Kutahya Dumlupınar University) were filtered with a 0.22 μm filter and different volumes of metal solutions were added. Metal solutions were then mixed with CQDs and measured.203. Results and discussion
UV-vis analysis was used to verify the synthesis by examining the plasmonic resonance of CQDs.34 Fig. 1a shows the UV-vis spectrum of glucose-derived CQD, N-CQD, S-CQD, and B-CQDs. An absorbance peak between 270-285 nm was observed in the UV-vis spectrum of all CQDs, and this peak corresponds to the n–π* transition of C![[double bond, length as m-dash]](https://www.rsc.org/images/entities/char_e001.gif) O, C
O, C![[double bond, length as m-dash]](https://www.rsc.org/images/entities/char_e001.gif) H, or C–OH bonds.33,35–37 The UV-vis results confirm the successful synthesis of glucose-derived CQDs.35 Also, in Fig. 1a, slight shifts and hyperchromic effects were observed in the CQD UV-vis spectrum with the doping of different atoms. This indicates that the absorption property of CQDs can be changed by surface passivation or modification.36 FTIR analysis was performed to identify the functional groups involved in the synthesis of CQDs. Fig. 1b shows the FTIR spectra of CQD, N-CQD, B-CQD, and S-CQDs. Different characteristic peaks were observed for each CQD in the FTIR spectrum, and the FTIR results show that CQDs have a unique structure.38 For CQD, the peaks at 3260 cm−1 and 2924 cm−1 can be attributed to the O–H and C–H groups, respectively.39 The peaks at 852 cm−1, 1023 cm−1, 1293 cm−1, 1593 cm−1, and 1695 cm−1, in the CQD FTIR spectrum can be attributed to the C–H, C–OH, C–O, C
H, or C–OH bonds.33,35–37 The UV-vis results confirm the successful synthesis of glucose-derived CQDs.35 Also, in Fig. 1a, slight shifts and hyperchromic effects were observed in the CQD UV-vis spectrum with the doping of different atoms. This indicates that the absorption property of CQDs can be changed by surface passivation or modification.36 FTIR analysis was performed to identify the functional groups involved in the synthesis of CQDs. Fig. 1b shows the FTIR spectra of CQD, N-CQD, B-CQD, and S-CQDs. Different characteristic peaks were observed for each CQD in the FTIR spectrum, and the FTIR results show that CQDs have a unique structure.38 For CQD, the peaks at 3260 cm−1 and 2924 cm−1 can be attributed to the O–H and C–H groups, respectively.39 The peaks at 852 cm−1, 1023 cm−1, 1293 cm−1, 1593 cm−1, and 1695 cm−1, in the CQD FTIR spectrum can be attributed to the C–H, C–OH, C–O, C![[double bond, length as m-dash]](https://www.rsc.org/images/entities/char_e001.gif) C, and C
C, and C![[double bond, length as m-dash]](https://www.rsc.org/images/entities/char_e001.gif) O functional groups, respectively.40,41 The peak at 3108 cm−1 in the FTIR spectrum for N-CQD corresponds to the O–H or N–H functional groups.5 The peaks observed at 1569 cm−1, 1320 cm−1, 1095 cm−1, and 925 cm−1 for N-CQD correspond to the N–H, C–N, C–O, and C–C groups, respectively.33,38,42 The peaks at 3088 cm−1, 2842 cm−1, 1474 cm−1, 1308 cm−1, 1088 cm−1, and 961 cm−1 in the FTIR spectrum for B-CQD correspond to functional groups O–H, C–H, B–O, B–OH, and C–B, respectively.43–45 For S-CQD, the peak at 3292 cm−1 refers to the OH group.46 The peaks at 1673 cm−1, 1606 cm−1, and 1277 cm−1 in the S-CQD FTIR spectrum can be attributed to the C
O functional groups, respectively.40,41 The peak at 3108 cm−1 in the FTIR spectrum for N-CQD corresponds to the O–H or N–H functional groups.5 The peaks observed at 1569 cm−1, 1320 cm−1, 1095 cm−1, and 925 cm−1 for N-CQD correspond to the N–H, C–N, C–O, and C–C groups, respectively.33,38,42 The peaks at 3088 cm−1, 2842 cm−1, 1474 cm−1, 1308 cm−1, 1088 cm−1, and 961 cm−1 in the FTIR spectrum for B-CQD correspond to functional groups O–H, C–H, B–O, B–OH, and C–B, respectively.43–45 For S-CQD, the peak at 3292 cm−1 refers to the OH group.46 The peaks at 1673 cm−1, 1606 cm−1, and 1277 cm−1 in the S-CQD FTIR spectrum can be attributed to the C![[double bond, length as m-dash]](https://www.rsc.org/images/entities/char_e001.gif) O, C
O, C![[double bond, length as m-dash]](https://www.rsc.org/images/entities/char_e001.gif) C, and C
C, and C![[double bond, length as m-dash]](https://www.rsc.org/images/entities/char_e001.gif) S functional groups, respectively.47 The peaks at 1135 cm−1 and 1019 cm−1 can be attributed to the –SO3− and C–S groups, respectively.48 FTIR results show that glucose-derived CQDs were synthesized and that B, N, and S atoms were successfully doped into the CQD structure. In addition, the FTIR results revealed that the surface of each CQD has different properties.38
S functional groups, respectively.47 The peaks at 1135 cm−1 and 1019 cm−1 can be attributed to the –SO3− and C–S groups, respectively.48 FTIR results show that glucose-derived CQDs were synthesized and that B, N, and S atoms were successfully doped into the CQD structure. In addition, the FTIR results revealed that the surface of each CQD has different properties.38
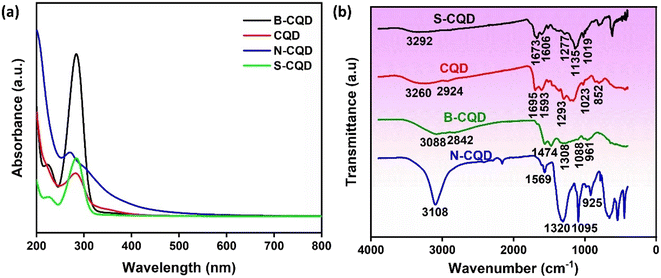 | ||
| Fig. 1 (a) The absorption spectrum of UV-vis analysis and (b) FTIR analysis spectra of CQD, N-CQD, S-CQD, and B-CQD. | ||
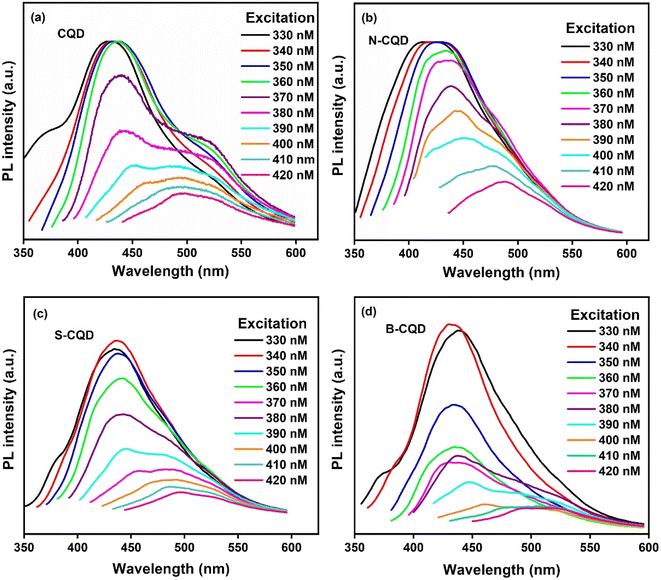
Fluorescence spectrophotometry was used to provide information about the photoluminescence properties of CQDs. Fig. 2 shows the photoluminescence (FL) spectra of CQD (Fig. 2a), N-CQD (Fig. 2b), S-CQD (Fig. 2c), and B-CQDs (Fig. 2d) at different excitation wavelengths. The FL phenomenon is a result of the quantum effect and is an important feature of CQDs.49 The strong emission peaks in the blue region were observed for all CQDs, and a gradual bathochromic (red) shift in emission was observed depending on the excitation wavelength.50 For CQDs, excitation-induced emission variation is a known feature. The PL behaviour of CQDs can be explained by the presence of different particle sizes of CQDs. Differences in particle size of CQDs are observed due to the quantum confinement effect and π-electron delocalization and this can increase or decrease the energy band gap. The PL mechanism of CQDs is quite complex and based on many factors. Among these factors, there are surface defects, and the presence of various functional groups on the surface. In general, we can say that the PL mechanism depends on the particle size and surface defects of CQDs. In addition, doping of different atoms to CQDs causes significant changes in PL emission.33,49,51 The highest peaks for CQD, N-CQD, B-CQD, and S-CQD were determined as 432 nm (ex 350), 425 (ex 350), 430 nm (ex 340 nm), and 436 nm (ex 340 nm), respectively. The peak shift trend occurred in the ranges of 429–495.5 nm, 413–488, 430–508 nm, and 436–497 nm for CQD, N-CQD, B-CQD, and S-CQD, respectively. It was observed that the addition of N, B, and S atoms to CQDs caused different shifts in the PL spectrum. The fluorescence intensity of CQDs and heteroatom doped CQDs showed no obvious decrease after storage at +4 °C for 1 year (Fig. S1†).
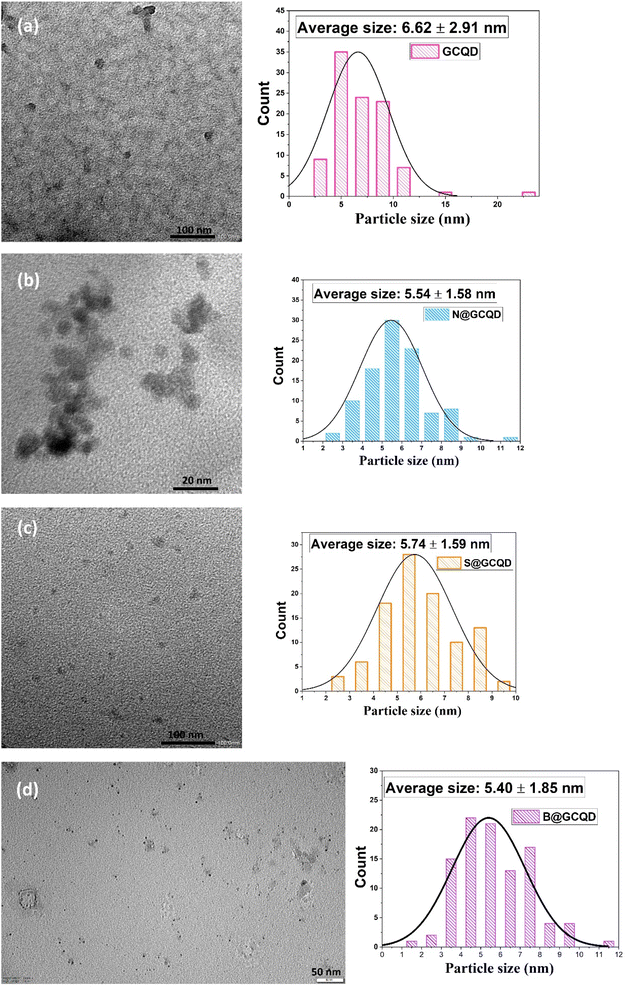
TEM analysis was used to determine the particle size and morphology of CQDs. Fig. 3 contains TEM images of CQDs. Fig. 3a shows the TEM image of the CQD and its average particle size found as 6.62 ± 2.91 nm. The average particle sizes for N-CQD (Fig. 3b), S-CQD (Fig. 3c), and N-CQD (Fig. 3d) were found to be 5.54 ± 1.58 nm, 5.74 ± 1.59 nm, and 5.40 ± 1.85 nm, respectively. In TEM analysis, all CQDs were observed to be spherical and monodisperse. N, B, and S doping of CQDs caused very minor changes in particle size. The TEM results obtained are compatible with the literature.33
The synthesized CQDs were tested for the production of colorimetric sensors for heavy metal determination (Fig. 4). Different responses were observed when the synthesized CQDs were treated with different types of metal ions (100 μM, Ca2+, Mn2+, Ni2+, K+, Ag+, Co2+, Cu2+, Zn2+, and Fe3+). In Fig. 4a, it was seen that CQDs reacted only against Fe3+ among metals, and the change was observed both in the UV-vis spectrum and visually. B-CQDs and S-CQDs reacted against Fe and Ag ions among metal ions (Fig. 4b and c). It can be said that the addition of B and S atoms to CQDs contributes to the sense of two different metal ions in CQDs. By adding B and S atoms, the sensor ability of CQDs was improved. In Fig. 4d, with the addition of N atoms to CQDs, a complete change in the sensor properties of CQDs was observed, and N-CQDs reacted with Ca ions among the metal ions. N-CQDs were effective in detecting Ca ions, unlike CQDs, B-CQDs, and S-CQDs.
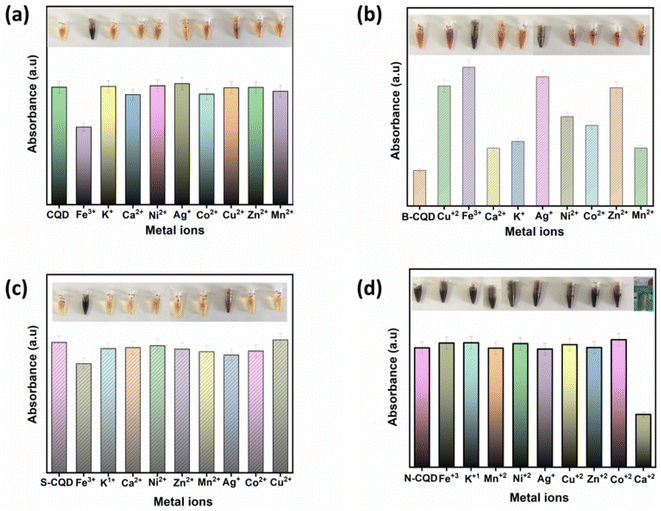 | ||
| Fig. 4 UV-vis response histogram of (a) CQD, (b) B-CQD, (c) S-CQD, and (d) N-CQDs in the presence of various metal ions (1.5 mL CQD; 1.23 μM metal ions concentration; 2 min response time). | ||
In Fig. 4a, the absorbance of CQDs decreased significantly in the presence of Fe3+, while no obvious decrease was observed when other metal ions at the same concentration were added. The results obtained indicate that CQDs exhibit a specific response to Fe3+ and will have the potential to be used to produce a selective colorimetric sensor for Fe3+. Once it was determined that CQDs exhibited a specific response to Fe3+, their absorbance at different concentrations of Fe3+ was examined. The absorbance of CQDs at different Fe3+ (0–1.23 μM) concentrations decreased as the concentration increased (Fig. 5a). This may be due to the formation of a chelating complex between the functional groups observed in the FTIR spectrum of CQDs and Fe3+ 6. There is a linear relationship between CQDs and different Fe3+ concentrations in the range of 0.1–1.23 μM. The Fe3+ detection time of CQDs was 2 min and the LOD value was calculated as 0.187 μM according to the 3σ/S formula6 (Fig. 5b). In the water quality standards recommended by WHO (World Health Organization) and EPA (US Environmental Protection Agency), the concentration of Fe3+ ions is determined as 0.3 ppm (∼5.36 μm), and the LOD value of CQDs is significantly lower than this value.52
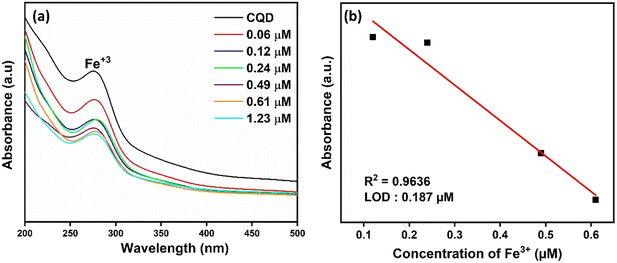 | ||
| Fig. 5 (a) UV-vis spectra of CQDs at different Fe3+ concentrations and (b) linear calibration curves of the absorption intensity of CQDs at different Fe3+ concentrations. | ||
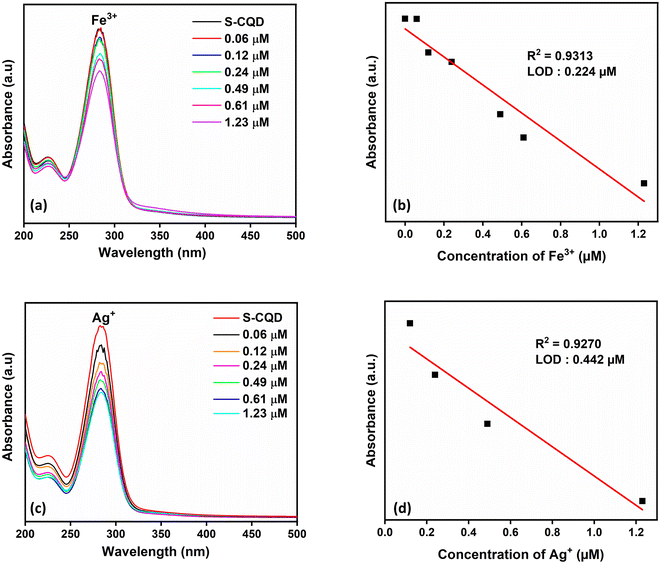
With the addition of S atom to CQDs, there was a visual color change for Fe3+ and Ag+ metal ions and a decrease in absorbance in the UV-vis spectrum (Fig. 4c). The sensor property of S-CQDs towards Fe3+ and Ag+ was examined at different concentrations (Fig. 6a and c). The absorbance value of S-CQDs decreased with increasing concentration of both metal ions. The detection mechanism of Ag+ ion of S-CQDs may be related to Ag–S− interaction and the formation of precipitate by transforming this interaction into Ag2S form.8 S-CQDs exhibited different color formations towards Fe3+ and Ag+ ions. A black color was observed for Fe3+, while a dark brown color was observed for Ag+. Precipitate formation occurred for both Fe3+ and Ag+ metal ions. The detection mechanism of Fe3+ metal ions of S-CQDs is similar to CQDs. The static quenching mechanism may be due to the complex formation between S-CQDs and Fe3+. Fig. 6b and d show that the absorbance intensity at the SPR peak of S-CQDs is linear with the concentration of Fe3+ and Ag+ ions. The detection time of Fe3+ and Ag+ ions of S-CQDs was approximately 2 minutes, and the LOD value was calculated as 0.224 μM and 0.442 μM, respectively. The presence limit of Ag+ ions in drinking water has been determined by WHO and EPO as 50 ppb (0.46 μmol L−1).7 The LOD values of S-CQDs for Fe and Ag are below the limit set by WHO and EPO.
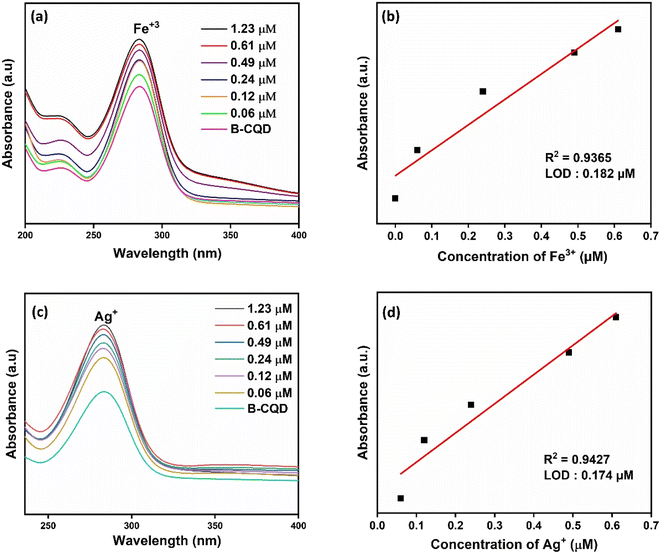
B-CQDs changed from light brown to dark color against Fe3+ ions and were observed to change from light brown to grey color against Ag+ ions (Fig. 4c). Thus, B-CQDs provided colorimetric detection against Fe3+ and Ag+ ions. When different concentrations of Fe3+ (Fig. 7a) and Ag+ (Fig. 7c) ions were added to B-CQDs, an increase in the absorbance peak was observed. There is a linear relationship between B-CQDs and different Fe3+ and Ag+ concentrations in the range of 0.1–1.23 μM (Fig. 7b and d). The Fe3+ and Ag+ detection time of CQDs was 2 min and the LOD values were calculated as 0.182 μM and 0.174 μM, respectively. Functional groups on the surfaces of B-CQDs in the presence of Fe3+ and Ag+ may be effective in the formation of a coordination complex that can change the reaction color and absorption spectrum.
Color change was observed with the addition of Ca2+ to N-CQDs, and Ca2+ was effective in detecting metal ions (Fig. 4d). It was observed that the absorbance peak in the UV-vis spectrum of N-CQDs decreased as the concentration of Ca2+ metal ions increased (Fig. 8a). There is a linear relationship between N-CQDs and different Ca2+ concentrations in the range of 0.1–1.23 μM (Fig. 8b). The Ca2+ detection time of CQDs was 2 minutes and the LOD value was calculated as 0.391 μM. Doping N atoms into CQDs was effective in detecting a different metal from CQDs. N-CQDs containing functional groups such as hydroxyl, carboxyl, and amine groups react with Ca2+ and aggregation can occur through interactions such as, π–π stacking, hydrogen bonding, and electrostatic interactions.53,54
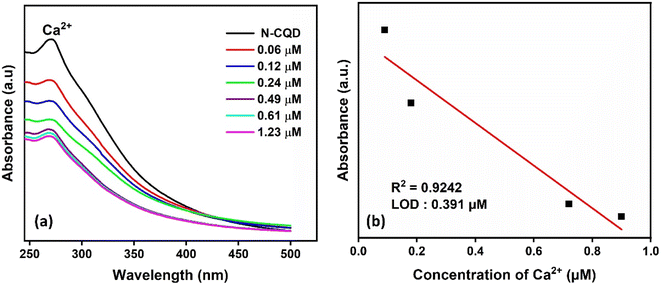 | ||
| Fig. 8 (a) UV-vis absorption spectra of N-CQDs and (b) calibration curves of the absorption intensity of N-CQDs at different Ca2+ concentrations. | ||
In line with the results obtained, it can be concluded that the addition of different heteroatoms to CQDs is effective in the formation of different sensor properties. B-CQDs and S-CODs, created as a result of boron and sulphur doping into CQDs, were effective in the development of a multi-sensor by sensing 2 metal ions. B-CQDs enabled the creation of a more sensitive sensor than CQDs. While CQDs were effective in determining only the Fe3+ metal ion, B-CQD, and S-CQD were effective in determining both Fe3+ and Ag+ metal ions. With the addition of N atom to CQDs, a completely different sensor effect was observed and, unlike the other 3 CQDs, Ca2+ metal ions were detected. It was determined that adding different heteroatoms to CQDs allows changing and improving the properties of CQDs. The reason for these changes occurring between CQDs and heteroatom doped CQDs may be various types of functional groups such as carboxyl and hydroxyl groups covering the surface of the produced CQDs.55 These existing hydrophilic groups serve as conjugated linkers. The S atom generally has an affinity for metal ions due to its lone pair of electrons.56 It can form complexes by coordinating with Fe3+ and Ag+ ions, leading to an electron transfer from S-CQDs to metal ions.57 With the aggregation of S-CQDs, interactions occurred that led to precipitate formation.56 Additionally, a specific binding interaction can be found between S-CQDs and metal ions (Fe3+ and Ag+), and therefore it can be said to have good selectivity.57 A similar mechanism to S-CQDs can be said for CQDs. The reason why CQDs do not interact with Ag+ may be the functional group differences on their surface. A coordination complex may have formed between the functional groups on the surface of B-CQDs and Fe+3 and Ag+ metal ions. This may cause changes in the solution color and absorption spectrum. Unlike CQDs, increasing the number of amino groups (NH2, N–H, C–N, etc.) on the surface of N-CQDs may have been effective in detecting Ca2+ ions. In the literature, in a study conducted on the detection of heavy metal ions by CQDs and N-CQDs, it was reported that the sensitivity of N-CQDs to Fe3+ detection was reduced and showed better selectivity for Fe2+ ions compared to CQDs.58 Table 1 shows the comparison of the synthesized CQDs, B-CQDs, S-CQDs, and N-CQDs with other sensor probes in the literature.
| Feature | Detection sample | Detection methods | Linear range | LOD value | References |
|---|---|---|---|---|---|
| CD spectrum (L/D-CQDs) | Ag+ | Fluorescence | 20–140 μM | 0.39 μM/0.31 μM | 59 |
| Hg2+ | 20–100 μM | 0.68 μM/0.64 μM | |||
| Cu2+ | 20–100 μM | 0.64 μM/0.61 μM | |||
| CQD | Hg2+ | Fluorescence | 0.05–10 mM | 1.67 μM | 60 |
| S/N-CQDs | Cr3+ | Fluorescence | 0–0.5 mM | 6 μM | 61 |
| Ag-CQDs NCs | Hg2+ | Colorimetric | 1–1000 ppm | — | 62 |
| N-CQDs | Hg2+ | Fluorescence | 1.–50 μM | 1.04 μM | 63 |
| MWCNT/CQDS/MnO2-1 | Cr6+ | Electrochemical | 10–100 μg L−1 | 0.32 μg L−1 | 64 |
| COF-CdS QDs | Co2+ | Colorimetric | 0.5–14 μg mL−1 | 0.23 μg mL−1 | 65 |
| CQD | Hg2+ | Fluorescence | 0–500 μM | ∼06.2 nM | 66 |
| CQD | Fe3+ | Colorimetric | 0.06–1.23 μM | 0.187 μM | In this study |
| B-CQD | Fe3+ | Colorimetric | 0.06–1.23 μM | 0.182 μM | In this study |
| Ag+ | 0.174 μM | ||||
| S-CQD | Fe3+ | Colorimetric | 0.06–1.23 μM | 0.224 μM | In this study |
| Ag+ | 0.442 μM | ||||
| N-CQD | Ca2+ | Colorimetric | 0.06–1.23 μM | 0.391 μM | In this study |
A real sample was used to evaluate the effectiveness of the created sensors in analysing metal ions. Since it can be difficult to find heavy metal pollution in real water, metal ions detected for each CQD were added to tap water samples. Colorimetric tests were performed in triplicate. Table 2 shows the results obtained. The results demonstrated the potential of using CQDs as colorimetric sensors for the detection of metal ions in real ambient water samples.
| Sample | Detection | Added (μM) | Found (μM) (mean ± SD, n = 3) | Recovery (%) | |
|---|---|---|---|---|---|
| Tap water | CQD | Fe3+ | 0.50 | 0.55 ± 0.023 | 110 |
| B-CQD | Fe3+ | 0.50 | 0.53 ± 0.0089 | 106 | |
| Ag+ | 0.54 ± 0.0023 | 108 | |||
| S-CQD | Fe3+ | 0.50 | 0.52 ± 0.017 | 104 | |
| Ag+ | 0.53 ± 0.014 | 106 | |||
| N-CQD | Ca2+ | 0.50 | 0.58 ± 0.0037 | 116 |
4. Conclusions
CQDs and CQDs doped with different hetero-atoms (boron, sulphur, and nitrogen) using glucose as a C source were synthesized, characterized and their colorimetric sensor activity for the detection of heavy metals was investigated. The peaks of B, N, and S atoms bound to the CQDs were observed by FTIR analysis and it was concluded that the doping was successful. The effect of B, N, and S doped CQDs on the size change of CQDs was examined by TEM analysis and it was observed that hetero-atoms doping had no effect on the size. In addition, the changes in the optical properties of CQDs after doping with different hetero-atoms were analysed by UV-vis and FL spectrophotometry. It was observed that UV-vis and FL spectra of B-CQDs, N-CQDs, and S-CQDs showed shifts in peaks compared to CQDs. This indicates that the addition of hetero-atoms to CQDs is effective in changing the optical properties of CQDs. The sensor properties of CQDs, B-CQDs, N-CQDs, and S-CQDs were investigated for the detection of heavy metals, and it was determined that the addition of hetero-atoms gave new properties to CQDs. CQDs enabled the detection of Fe3+ metal ion and the LOD value was calculated as 0.187 μM. B-CQDs and S-CQDs enabled the detection of Fe3+ (LOD: 0.182 μM (B-CQD) and 0.224 μM (S-CQD)) and Ag+ (LOD: 0.174 μM (B-CQD) and 0.442 μM (S-CQD)) metal ions and allowed the simultaneous detection of 2 different metals. N-CQDs enabled the detection of Ca2+ metal ion and the LOD value was calculated as 0.391 μM. In line with the results obtained, further studies are needed to determine how the functional groups and properties such as electronegativity of the heteroatoms added to CQDs affect the sensor mechanism. According to the results obtained, CQDs and heteroatom doped CQDs have great potential for the detection of heavy metals in wastewater and applications in the field of healthcare.Conflicts of interest
There are no conflicts to declare.Acknowledgements
The authors would like to thank TUBITAK 2209-A-2022/2 for the financial support. The authors dedicated this publication to the 100th anniversary of the Republic of Türkiye. As scientists raised by Türkiye, they are proud to be citizens of this country.References
- H. Karimi-Maleh, A. Khataee, F. Karimi, M. Baghayeri, L. Fu, J. Rouhi, C. Karaman, O. Karaman and R. Boukherroub, Chemosphere, 2022, 291(3), 132928 CrossRef CAS PubMed.
- M. Balali-Mood, K. Naseri, Z. Tahergorabi, M. R. Khazdair and M. Sadeghi, Front. Pharmacol., 2021, 12, 643972 CrossRef CAS PubMed.
- A. S. Adeleye, J. R. Conway, K. Garner, Y. Huang, Y. Su and A. A. Keller, Chem. Eng. J., 2016, 286, 640–662 CrossRef CAS.
- C. Zhu, J. Zhai and S. Dong, Chem. Commun., 2012, 48, 9367–9369 RSC.
- Y. Fu, G. Gao and J. Zhi, J. Mater. Chem. B, 2019, 7, 1494–1502 RSC.
- A. Aygun, G. Sahin, R. N. E. Tiri, Y. Tekeli and F. Sen, Chemosphere, 2023, 339, 139702 CrossRef CAS PubMed.
- J. C. Jin, B. B. Wang, Z. Q. Xu, X. H. He, H. F. Zou, Q. Q. Yang, F. L. Jiang and Y. Liu, Sens. Actuators, B, 2018, 267, 627–635 CrossRef CAS.
- L. Wang, C. Zhang, H. He, H. Zhu, W. Guo, S. Zhou, S. Wang, J. R. Zhao and J. Zhang, Int. J. Biol. Macromol., 2020, 163, 593–602 CrossRef CAS PubMed.
- Y. Qu, I. Yakub, R. Baini, W. S. Hu and L. Wang, J. Anal. Sci. Technol., 2023, 14, 1–14 CrossRef.
- S. Kim, J. W. Park, D. Kim, D. Kim, I. H. Lee and S. Jon, Angew. Chem., Int. Ed., 2009, 48, 4138–4141 CrossRef CAS PubMed.
- W. He and J. Lu, Chem. Ecol., 2000, 17, 113–123 CrossRef CAS.
- B. Bhushan, Springer Handbooks, 2017, pp. 1–19 Search PubMed.
- M. C. Roco, J. Nanopart. Res., 2001, 3, 353–360 CrossRef.
- Z. Chen, Z. Zhang, J. Qi, J. You, J. Ma and L. Chen, J. Hazard. Mater., 2023, 441, 129889 CrossRef CAS PubMed.
- A. Sharifi, R. Hallaj and S. Bahar, J. Anal. Methods Chem., 2022, 2023, 5424221 Search PubMed.
- Y. Wang, L. Wang, W. Huang, T. Zhang, X. Hu, J. A. Perman and S. Ma, J. Mater. Chem. A, 2017, 5, 8385–8393 RSC.
- Y. Yu, C. Liu, B. Tian, X. Cai, H. Zhu, P. Jia, Z. Li, X. Zhang, W. Sheng and B. Zhu, Dyes Pigm., 2020, 177, 108290 CrossRef CAS.
- N. Chaudhary, P. K. Gupta, S. Eremin and P. R. Solanki, J. Environ. Chem. Eng., 2020, 8, 103720 CrossRef CAS.
- B. H. Chen, S. J. Jiang and A. C. Sahayam, Food Chem., 2020, 324, 126698 CrossRef CAS PubMed.
- Z. Q. Zhou, Y. P. Liao, J. Yang, S. Huang, Q. Xiao, L. Y. Yang and Y. Liu, Spectrochim. Acta, Part A, 2020, 228, 117795 CrossRef CAS PubMed.
- R. Zhou, C. Wen, J. Lv, H. Xu, Z. Qiu, Z. Wu and X. Zhang, Chem. Phys. Lett., 2023, 813, 140324 CrossRef CAS.
- A. Ko and C. Liao, Anal. Methods, 2023, 15, 4377–4404 RSC.
- A. Vibhute, T. Patil, R. Gambhir and A. P. Tiwari, Appl. Surf. Sci., 2022, 11, 100311 CrossRef.
- P. Das, S. Ganguly, S. R. Ahmed, M. Sherazee, S. Margel, A. Gedanken, S. Srinivasan and A. R. Rajabzadeh, ACS Appl. Polym. Mater., 2022, 4, 9323–9340 CrossRef CAS.
- V. N. Mehta, S. Jha and S. K. Kailasa, Mater. Sci. Eng., C, 2014, 38, 20–27 CrossRef CAS PubMed.
- A. P. Demchenko and M. O. Dekaliuk, Methods Appl. Fluoresc., 2013, 1, 042001 CrossRef CAS PubMed.
- V. Borse, M. Thakur, S. Sengupta and R. Srivastava, Sens. Actuators, B, 2017, 248, 481–492 CrossRef CAS.
- Y. Liu, W. Li, P. Wu, C. Ma, X. Wu, M. Xu, S. Luo, Z. Xu and S. Liu, Sens. Actuators, B, 2019, 281, 34–43 CrossRef CAS.
- A. Saravanan, P. Das, M. Maruthapandi, S. Aryal, S. Michaeli, Y. Mastai, J. H. T. Luong and A. Gedanken, Surf. Interfaces, 2024, 46, 103857 CrossRef CAS.
- M. Y. Larina, O. V. Farafonova, S. A. Eremin and T. N. Ermolayeva, J. Anal. Chem., 2023, 78, 54–62 CrossRef CAS.
- S. Zhu, Y. Song, X. Zhao, J. Shao, J. Zhang and B. Yang, Nano Res., 2015, 8, 355–381 CrossRef CAS.
- P. Das, M. Sherazee, P. K. Marvi, S. R. Ahmed, A. Gedanken, S. Srinivasan and A. R. Rajabzadeh, ACS Appl. Mater. Interfaces, 2023, 15, 29425–29439 CrossRef CAS PubMed.
- P. Ezati, J. W. Rhim, R. Molaei, R. Priyadarshi, S. Roy, S. Min, Y. H. Kim, S. G. Lee and S. Han, Sustainable Mater. Technol., 2022, 32, e00397 CrossRef CAS.
- M. Alim-Al-Razy, G. M. A. Bayazid, R. U. Rahman, R. Bosu and S. S. Shamma, J. Phys.: Conf. Ser., 2020, 1706, 012020 CrossRef CAS.
- H. J. Yashwanth, S. R. Rondiya, N. Y. Dzade, S. D. Dhole, D. M. Phase and K. Hareesh, Vacuum, 2020, 180, 109589 CrossRef CAS.
- N. Azam, M. Najabat Ali and T. Javaid Khan, Front. Mater., 2021, 8, 700403 CrossRef.
- S. Sun, S. Guo, Q. Qin, Y. Liao, M. Li and F. Du, Chemosensors, 2022, 10, 453 CrossRef CAS.
- E. Budak, D. Erdoğan and C. Ünlü, Photosynth. Res., 2021, 147, 1–10 CrossRef CAS PubMed.
- M. Javed, A. N. S. Saqib, A. U. Rehman, B. Ali, M. Faizan, D. A. Anang, Z. Iqbal and S. M. Abbas, Electrochim. Acta, 2019, 297, 250–257 CrossRef CAS.
- A. Dager, T. Uchida, T. Maekawa and M. Tachibana, Sci. Rep., 2019, 9, 1–12 CrossRef CAS PubMed.
- S. Yu, L. Ding, H. Lin, W. Wu and J. Huang, Biosens. Bioelectron., 2019, 146, 111760 CrossRef CAS PubMed.
- L. Zhao, Y. Wang, X. Zhao, Y. Deng and Y. Xia, Polym., 2019, 11, 1731 CAS.
- Y. Guo, Y. Chen, F. Cao, L. Wang, Z. Wang and Y. Leng, RSC Adv., 2017, 7, 48386–48393 RSC.
- A. Meng, Y. Zhang, X. Wang, Q. Xu, Z. Li, L. Sheng and L. Yan, Colloids Surf., A, 2022, 648, 129150 CrossRef CAS.
- Y. Ma, A. Y. Chen, Y. Y. Huang, X. He, X. F. Xie, B. He, J. H. Yang and X. Y. Wang, Carbon, 2020, 162, 234–244 CrossRef CAS.
- G. Huang, Y. Lin, L. Zhang, Z. Yan, Y. Wang and Y. Liu, Sci. Rep., 2019, 9, 1–9 CrossRef PubMed.
- J. Duan, J. Yu, S. Feng and L. Su, Talanta, 2016, 153, 332–339 CrossRef CAS PubMed.
- Q. Xu, P. Pu, J. Zhao, C. Dong, C. Gao, Y. Chen, J. Chen, Y. Liu and H. Zhou, J. Mater. Chem. A, 2014, 3, 542–546 RSC.
- X. Zhang, L. An, C. Bai, L. Chen and Y. Yu, Mater. Today Chem., 2021, 20, 100425 CrossRef CAS.
- P. Chandrasekaran, V. Arul and M. G. Sethuraman, J. Fluoresc., 2020, 30, 103–112 CrossRef CAS PubMed.
- B. De and N. Karak, RSC Adv., 2013, 3, 8286–8290 RSC.
- L. Chen, C. Wu, P. Du, X. Feng, P. Wu and C. Cai, Talanta, 2017, 164, 100–109 CrossRef CAS PubMed.
- S. K. Tammina, D. Yang, S. Koppala, C. Cheng and Y. Yang, J. Photochem. Photobiol., B, 2019, 194, 61–70 CrossRef CAS PubMed.
- C. Wang, H. Shi, M. Yang, Z. Yao, B. Zhang, E. Liu, X. Hu, W. Xue and J. Fan, Colloids Surf., B, 2021, 205, 111874 CrossRef CAS PubMed.
- Z. Zhang, Z. Zhang, H. Liu, X. Mao, W. Liu, S. Zhang, Z. Nie and X. Lu, Biosens. Bioelectron., 2018, 103, 87–93 CrossRef CAS PubMed.
- F. Arshad and M. P. Sk, ACS Appl. Nano Mater., 2020, 3, 3044–3049 CrossRef CAS.
- H. Wu, J. Jiang, X. Gu and C. Tong, Microchim. Acta, 2017, 184, 2291–2298 CrossRef CAS.
- R. Liu, Y. Zhang, Y. Piao and L. Y. Meng, Carbon Lett., 2021, 31, 821–829 CrossRef.
- X. Fan, L. Jiang, Y. Liu, W. Sun, Y. Qin, L. Liao and A. Qin, Opt. Mater., 2023, 137, 113620 CrossRef CAS.
- F. Liu, S. Zhu, D. Li, G. Chen and S. H. Ho, iScience, 2020, 23, 101174 CrossRef CAS PubMed.
- C. Wang, J. Xu, H. Li and W. Zhao, Luminescence, 2020, 35, 1373–1383 CrossRef CAS PubMed.
- R. Kaur, J. Singh, D. Kathuria and A. S. Matharu, Sustainable Chem. Pharm., 2022, 29, 100813 CrossRef CAS.
- M. A. Bhakare, M. P. Bondarde, K. D. Lokhande, P. S. Dhumal and S. Some, Chem. Eng. Sci., 2023, 281, 119150 CrossRef CAS.
- K. Bhuvaneswari, S. Radha, B. S. Sreeja and P. Senthil Kumar, Environ. Res., 2023, 225, 115570 CrossRef CAS PubMed.
- A. H. Gore, D. B. Gunjal, M. R. Kokate, V. Sudarsan, P. V. Anbhule, S. R. Patil and G. B. Kolekar, ACS Appl. Mater. Interfaces, 2012, 4, 5217–5226 CrossRef CAS PubMed.
- E. Dhandapani, P. Maadeswaran, R. Mohan Raj, V. Raj, K. Kandiah and N. Duraisamy, Mater. Sci. Eng., B, 2023, 287, 116098 CrossRef CAS.
Footnote |
| † Electronic supplementary information (ESI) available. See DOI: https://doi.org/10.1039/d4ra00397g |
| This journal is © The Royal Society of Chemistry 2024 |

