 Open Access Article
Closed-shell d10–d10 mechanochromic [AuPh(CNPh)]n complex: quantum chemistry electronic and optical properties†
Fernando Mendizabal *a,
María Luisa Ceron*b,
Dina Laraa and
Sebastián Miranda-Rojas*cd
aDepartamento de Química, Facultad de Ciencias, Universidad de Chile, Casilla 653, Santiago, Chile. E-mail: hagua@uchile.cl
bFacultad de Ingeniería, Universidad Finis Terrae, Av. Pedro de Valdivia 1509, Providencia, Santiago, Chile. E-mail: lceron@uft.cl
cDepartamento de Ciencias Químicas, Facultad de Ciencias Exactas, Universidad Andrés Bello, Avenida República 275, Santiago, Chile. E-mail: sebastian.miranda@unab.cl
dUniversidad Andrés Bello, Centro de Química Teórica & Computacional (CQT&C), Facultad de Ciencias Exactas, Departamento de Ciencias Químicas, Avenida República 275, 8370146, Santiago de Chile, Chile
First published on 13th February 2024
Abstract
The electronic structure, spectroscopic properties, and solid state chemistry of monomer and dimers of [AuPh(CNPh)] complex were studied at post-Hartree–Fock (MP2, SCS-MP2, and CC2) and density functional theory levels. The absorption spectra of these complexes were calculated using single excitation time-dependent (TD) methods at DFT, CC2, and SCS-CC2 levels. The influences of the bulk are accounted for at the PBE-D3 level, incorporating dispersion effects. The calculated values agree with the experimental range, where absorption and emission energies reproduce experimental trends with large Stokes shifts. The aurophilic interaction is identified as a key factor influencing the spectroscopic and structural properties of these complexes. The intermetallic interactions were found as the main factor responsible for MMCT electronic transitions in the models studied.
1. Introduction
Complexity is a new concept in chemistry1,2 that attempts to explain how the chemistry of the system is organized at the molecular level. Since 1997, chemistry has started considering complexity3,4 at the molecular scale. Chemistry has evolved from individual molecules to the description and manipulation of systems of molecules, giving rise to some new fields, such as the materials chemistry, supramolecular chemistry, and nanochemistry.5,6 Theoretical and computational chemistry have helped us understand the behavior of chemical systems at the molecular scale. The systems chemistry approach indicates that the organization of the individual molecule will determine the new properties of the whole system. At the simplest level, noncovalent interactions between molecules can lead to the emergence of large structures in solid and liquid states.7 In the last forty years, it has been shown that gold(I) atoms can form stable self-assemblies and inorganic complexes.8–12 Inorganic molecular assemblies based on d10 configuration complex systems represent an essential class based on exotic geometries obtained from various noncovalent interactions.13–21 The self-assembly of molecules with gold atoms involves inter- and intramolecular interactions that lead to the formation of systems with high complexity.22–30This phenomenon is known as “aurophilic interaction”.31–41 These closed-shell interactions are estimated to be energetically similar to hydrogen bonds (7–20 kJ mol−1) in the case of gold(I).42–45 The aurophilic interaction has been experimentally determined via solid-state X-ray diffraction23–26 and NMR/absorption/emission/Raman spectroscopic measurements.27,28 From a theoretical point of view, gold interactions can be understood as the contribution of two terms to the equilibrium distance: dispersion and ionic interactions.31–41 The relativistic effects contribute around 20% to the energy of interaction at the MP2 level.32 However, in recent years, some researchers have proposed that the aurophilic interaction is driven by the balance between strong Pauli repulsion at close range46–48 and orbital interaction among metallic centers. These studies also demonstrated the relevance of the dispersion term in the attractive interaction obtained in the gold–gold equilibrium distance, which is recovered in the electronic correlation. It has been stated that all dispersion forces are due to electronic correlation effects but that the electronic correlation contribution is not necessarily dispersion forces.49 Additionally, it should be considered that same complexes have electrostatic interaction via a dipole–dipole term that dominates at the equilibrium Au–Au distance calculated from the sum of induction and dispersion terms.50,51 The experimental results in many studies are explained by theoretical models described at the post-Hartree–Fock (MP2, spin-component-scaled (SCS)-MP2, CCSD(T)) and density functional theory (DFT) levels with dispersion correction.52 In the case of more extensive systems, the DFT method is usually preferred because of its better performance, although sacrificing accuracy.53
The aurophilic interactions have been evidenced by absorption and emission behavior in several complexes where these interactions are present.16–20 The photophysical properties of gold complexes undergo significant changes when Au–Au interactions are established.21–26 Understanding these systems comes from calculating intermolecular interaction energies and determining how these lead to structures and patterns that result in specific optical properties. Thus, it is possible to rationalize the relationship between the structure and optical properties of gold complexes. In this context, the observation of absorption/luminescence has been tied to the presence of close Au–Au contacts in solid and solution.14–26 An interesting situation occurs with solid-state luminescence when the material is subject to external influences, such as light, thermal, mechanical, and chemical.54,55 The crystal can give rise to drastic differences in luminescence responses. One of these phenomena is known as mechanochromism. Ito and co-workers reported phenyl(phenylisocyanide)gold(I) ((C6H5)Au(CN–C6H5)) described as PhAuCNPh, which exhibits two polymorphic structures.56–58 Rapid recrystallization of the complex gave a triclinic structure (polymorph Ib) without Au–Au contacts. Meanwhile, slow evaporation of the complex gave a tetragonal polymorph (IIy) featuring Au–Au interactions of 318 pm. Mechanical stimulus resulted in a single-crystal-to-single-crystal (SCSC) phase transformation with changes in the photoluminescence, i.e., blue to yellow-green, due to aurophilic interactions and C–H/π in the tetragonal complex. The excitation and emission spectra for polymorph complexes IIy and Ib are very different. The excitation spectrum is observed at 432 nm (2.9 eV) in IIy and 315 (4.0 eV) in Ib. The emission spectrum is observed at 567 nm (2.2 eV) in IIy and 490 nm (2.5 eV) and 460 nm (2.7 eV) in Ib. See Scheme 1.
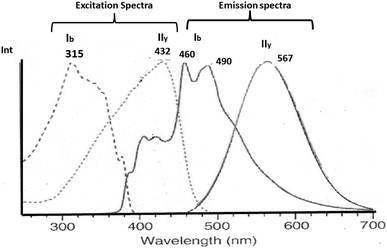 | ||
| Scheme 1 Experimental excitation and emission spectra of IIy and Ib complexes.56–58 | ||
Ito and co-workers59 performed time-dependent density functional theory (TDDFT) calculations based on B3LYP using models from the tetrameric experimental structures of Ib and IIy. The results for Ib showed an excitation with metal–ligand-to-ligand charge transfer (MLLCT) character, with singlet–singlet transitions at 326, 354, 356, and 387 nm. The calculated electronic spectrum was consistent with experimental excitation peaks from 320 nm to 380 nm with an edge of 400 nm. Conversely, calculations with IIy showed an electronic spectrum with a metal–metal to ligand charge transfer (MML) facilitated by the short Au–Au distance. The main electronic transition is found at 409 nm, corresponding to HOMO → LUMO and HOMO−1 →LUMO+1. This transition can be attributed to the antibonding sigma orbital σ* (gold dz2) to isocyanide π* transition. Moreover, Ito, Sakaki, and co-workers59 used the same tetrameric model with quantum mechanics (QM)/molecular mechanics (MM) calculations to study ground-state structures and absorption and emission spectra at the TD-DFT B3LYP-D3 level. They used (Ph)Au(CNPh) 1 with a gold(I) isocyanide complex that formed two different polymorphic crystals Ib and Iy, analogous to Ib and IIy described above. The QM/MM calculations showed that the polymorph Iy was more stable than Ib, which agrees with experimental findings. The results show that LLCT is the lowest-energy excitation state in absorption. The π–π* local state on the CNPh moiety is the lowest-energy triplet state in the emission by Ib models. In contrast, in Iy model, the MMLCT state is the lowest-energy excitation absorption and emission state. The differences in the optical behavior between two optimized structures arise from changes in the Au–Au distance, which is shorter in Iy than in Ib.
Gold complexes have provided the opportunity to understand excited states covering broad emission colors.56–59 Control of supramolecular chemistry systems of functional metal complexes is essential to determine the charge transport and optical properties.9 Herein, we focused on establishing the relationship between aurophilic interaction and experimental geometries using models of [PhAuCNPh]2 complexes. Moreover, our second aim was to study geometrical and optical properties at post-Hartree–Fock (CC2 and SCS-CC2) and density functional theory (PBE, TPSS, and B3LYP) levels on simplified models of the two types of complexes described above: Ib and IIy. The light-absorption processes in complexes were studied using time-dependent density functional theory (TDDFT) calculations and by performing ab initio correlated calculations at the approximate spin-component-scaled approximation second-order coupled cluster (SCS-CC2). Finally, we performed calculations based on solid-state chemistry using PBE functionals to evaluate the effect of bulk on aurophilic interactions.
2. Theoretical models and calculations
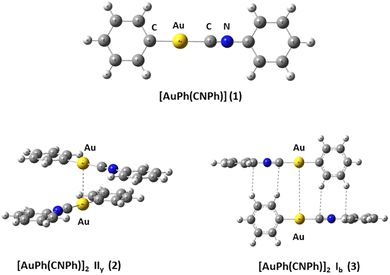
We used the [PhAuCNPh] model 1 (Ph![[double bond, length as m-dash]](https://www.rsc.org/images/entities/char_e001.gif) C6H5) to build dimers 2 and 3 of [PhAuCNPh]2 shown in Fig. 1. The dimers have orientation IIy (2) and Ib (3), simulating the experimental geometry.56 The geometries were fully optimized at scalar quasi-relativistic MP2, SCS-MP2, PBE (Perdew–Burke–Ernzerhof),60 B3LYP,61 and TPSS62 levels in the gas phase for each fragment in the models. Grimme's dispersion correction incorporates an accurate description of weak forces when using those functionals in what is known as the DFT-D3 level with the Becke–Johnson (BJ) damping function correction.63,64 The gold–gold interaction energy (ΔEint) and geometric equilibrium distances (Re) of complexes were obtained using the counterpoise correction for the basis-set superposition error (BSSE).65,66
C6H5) to build dimers 2 and 3 of [PhAuCNPh]2 shown in Fig. 1. The dimers have orientation IIy (2) and Ib (3), simulating the experimental geometry.56 The geometries were fully optimized at scalar quasi-relativistic MP2, SCS-MP2, PBE (Perdew–Burke–Ernzerhof),60 B3LYP,61 and TPSS62 levels in the gas phase for each fragment in the models. Grimme's dispersion correction incorporates an accurate description of weak forces when using those functionals in what is known as the DFT-D3 level with the Becke–Johnson (BJ) damping function correction.63,64 The gold–gold interaction energy (ΔEint) and geometric equilibrium distances (Re) of complexes were obtained using the counterpoise correction for the basis-set superposition error (BSSE).65,66
The calculations were carried out using Turbomole 7.0 (ref. 67) and Gaussian16 (ref. 68) program packages. We used the Turbomole program to obtain optical properties, while the Gaussian program was used to obtain equilibrium geometries and electronic properties. The 19 valence electrons (VE) of the Au quasi-relativistic (QR) pseudo-potential (PP) of Andrae69 were employed. We used 2f-type polarization and diffuse functions on gold (αf = 0.20, 1.19). Furthermore, C and N atoms were treated through PPs, using double-zeta basis sets with the addition of two d-type polarization functions.70 A double-zeta basis set plus two p-type polarization functions were used for the H atom.71
Single-point calculations of equilibrium geometries were used to study excitation spectra by PBE, TPSS, and B3LYP. The excitation energy was obtained using the time-dependent perturbation theory approach (TD),72 which is based on the random-phase approximation (RPA) method.73 The TD calculations do not evaluate the spin–orbit splitting, and values are averaged in metallic atoms described by pseudo-potentials. Moreover, excitation energies and oscillator strengths are calculated at the approximate second-order coupled cluster (CC2) and spin-component-scaled approximation (SCS-CC2)74,75 levels. We used the equilibrium distance (Re) estimated at MP2 and SCS-MP2 levels to calculate excitation spectra at CC2 and SCS-CC2. The SCS-MP2 methodology is an accurate and efficient tool for incorporating electronic correlation to study models at a low computational cost.76 This method involves the Laplace transformation (LT) algorithm and reduced-virtual-space (RVS) approximation. The RVS cutoff threshold was 60 eV.77
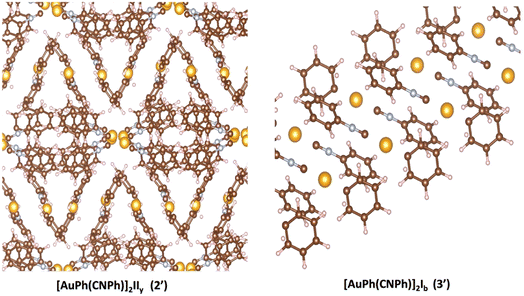
The optPBE functional78,79 was used for all calculations implemented in the VASP code.80–82 For gold, oxygen, carbon, and nitrogen atoms, electron configurations [Xe] 4f145d106s1, [He] 2s22p4, [He] 2s22p2, and [He] 2s22p3 were used, respectively, and their core electrons were kept frozen and replaced by PAW-generated pseudopotentials.83,84 The valence electrons were described with plane wave basis with a cutoff of 425 eV. The methodology was tested for the bulk of [AuPh(CNPh)]2 IIy (2′) and [AuPh(CNPh)]2 Ib (3′) structures using crystallographic data obtained from experimental X-ray data by Ito et al.56 To optimize both systems in this study, the primitive cell for system 2′ was considered. This cell was identified as rhombohedral and contains 200 atoms, with dimensions a = 15.68 Å, b = 15.68 Å, c = 15.68 Å, α = 129.4, β = 129.4, and γ = 74.4. Conversely, for system 3′, it was found to be triclinic, and the unit cell contains 50 atoms with dimensions a = 6.02 Å, b = 9.07 Å, c = 11.45 Å, α = 102.2, β = 101.5, and γ = 102.4. The band structure and density of states were obtained using the VASPKIT85 routine available in the VASP program. To generate LDOS plots, it was necessary to use the DOSCAR file, which is an output file that uses the keyword LORBIT = 11 in the input file (INCAR). Subsequently, through integration with the total number of electrons for each system, it is possible to identify the Fermi level, corresponding to the energy of the highest occupied level in a system.
3. Results and discussion
3.1 Aurophilic attractions
[AuPh(CNPh)]2 IIy (2) and Ib (3) dimers are used for modeling aurophilic and C–H/π interactions, respectively. Au–Au and C–H/π distances, together with interaction energies, are listed in Table 1 to compare and systemize the analysis of the weak intermolecular interaction. The results reported in this study using MP2, SCS-MP2, and DFT-D3(BJ) methods are at the same level as those reported in the literature for the interaction energy and geometry.86,87 It is known that the MP2 method tends to overestimate interaction energies and shorten Au–Au distances.13,14 In this context, the SCS-MP2 method provides an improved description of the system, with lower interaction energies and longer Au–Au distances than with MP2, a trend observed in all dimers according to the data from Table 1. The DFT-D3(BJ) calculations generated similar geometries, where incorporating dispersion corrections (D3) allowed interaction energies and Au–Au and C–H/π distances comparable to those obtained at the MP2 level. In the IIy model, interaction energies with B3LYP are overestimated, while those with PBE and TPSS are similar to MP2. Furthermore, it is highlighted that interaction energies are all similar to those calculated by DFT for model Ib. This is because its nature does not involve an aurophilic interaction. In all Ib models, C–H/π interactions are present.| Model | Method | Au–Au | C–H/π | ΔEInt |
|---|---|---|---|---|
| [AuPh(CNPh)]2 IIy | MP2 | 305.2 | 375.9 | −8.1 |
| SCS-MP2 | 325.6 | 392.7 | −4.6 | |
| B3LYP-D3(BJ) | 299.1 | 375.9 | −11.7 | |
| PBE-D3(BJ) | 300.6 | 375.9 | −7.2 | |
| TPSS-D3(BJ) | 298.9 | 375.9 | −9.2 | |
| [AuPh(CNPh)]2 Ib | MP2 | 514.2 | 299.4 | −5.9 |
| SCS-MP2 | 526.6 | 311.7 | −4.4 | |
| B3LYP-D3(BJ) | 511.8 | 299.4 | −6.9 | |
| PBE-D3(BJ) | 512.5 | 299.4 | −6.1 | |
| TPSS-D3(BJ) | 512.4 | 299.4 | −6.5 | |
| Model Iy59 | B3LYP-D3 | 317.7 | −11.4 | |
| Model Ib59 | B3LYP-D3 | 573.3 | −6.2 | |
| [AuPh(CNPh)]2 IIy | Exp.56 | 317.7 | ||
| [AuPh(CNPh)]2 Ib | Exp.56 | 573.3 |
Previous theoretical models,59 Ib, and Iy use experimental geometry and perform calculations at the B3LYP (MM/QC) level. The magnitudes of interaction energies are in the same range as the models proposed in this study. The only difference between results reported here and previous ones is that they optimized the geometries of proposed dimers, and a model with two units was sufficient to obtain comparable results to experimental ones.
3.2 Optical properties: absorption spectra
The UV-vis spectra were calculated at CC2 and SCS-CC2 levels. Additionally, the excitation energies of the models were calculated at the TDDFT level using B3LYP, PBE, and TPSS functionals to compare their performance concerning CC2 and SCS-CC2 results. We calculated the allowed spin-singlet transition for these systems based on the ground-state structures of monomer (1) and dimers (2 and 3). The objective is to evaluate the electronic structure of the excitation state. The allowed transitions are listed in Table 2 for [AuPh(CNPh)] (1), and [AuPh(CNPh)]2 IIy (2) and Ib (3).| System | Method | λcalc/nm | fa | Contributionb | Transition type |
|---|---|---|---|---|---|
| a Oscillator strength.b Values are |coeff.|2 × 100. | |||||
| [AuPh(CNPh)] | CC2 | 288 | 0.6829 | 43a → 44a (83) |  |
| SCS-CC2 | 245 | 0.7011 | 43a → 44a (82) |  |
|
| B3LYP | 273 | 0.3881 | 43a → 47a (70) |  |
|
| PBE | 274 | 0.3702 | 43a → 47a (70) |  |
|
| TPSS | 269 | 0.3828 | 43a → 47a (70) |  |
|
| [AuPh(CNPh)]2 IIy | CC2 | 378 | 0.1387 | 86a → 87a (44) |  |
| 84a → 87a (19) |  |
||||
| SCS-CC2 | 320 | 0.1655 | 86a → 87a (30) |  |
|
| 82a → 87a (26) |  |
||||
| B3LYP | 460 | 0.1066 | 84a → 88a (50) |  |
|
| 83a → 87a (26) |  |
||||
| PBE | 459 | 0.1015 | 84a → 88a (49) |  |
|
| 83a → 87a (32) |  |
||||
| TPSS | 445 | 0.1049 | 84a → 88a (50) |  |
|
| 83a → 87a (30) |  |
||||
| [AuPh(CNPh)]2 Ib | CC2 | 255 | 0.7984 | 85a → 90a (26) |  |
| 85a → 92a (25) |  |
||||
| 86a → 90a (17) |  |
||||
| SCS-CC2 | 244 | 0.7906 | 85a → 90a (27) |  |
|
| 85a → 92a (26) |  |
||||
| 86a → 90a (15) |  |
||||
| B3LYP | 329 | 0.2766 | 85a → 91a (32) |  |
|
| 85a → 92a (32) |  |
||||
| PBE | 329 | 0.2572 | 85a → 92a (34) |  |
|
| 85a → 91a (30) |  |
||||
| TPSS | 321 | 0.2304 | 85a → 92a (27) |  |
|
| 85a → 91a (23) |  |
||||
| Model Iy | B3LYP | 387/399 |  |
||
| Model Ib | B3LYP | 276/302/335 |  |
||
| [AuPh(CNPh)]2 IIy | Exp.56 | 432 | |||
| [AuPh(CNPh)]2 IIy | Exp.56 | 390 | |||
| Ground | |||||
| [AuPh(CNPh)]2 Ib | Exp.56 | 315 | |||
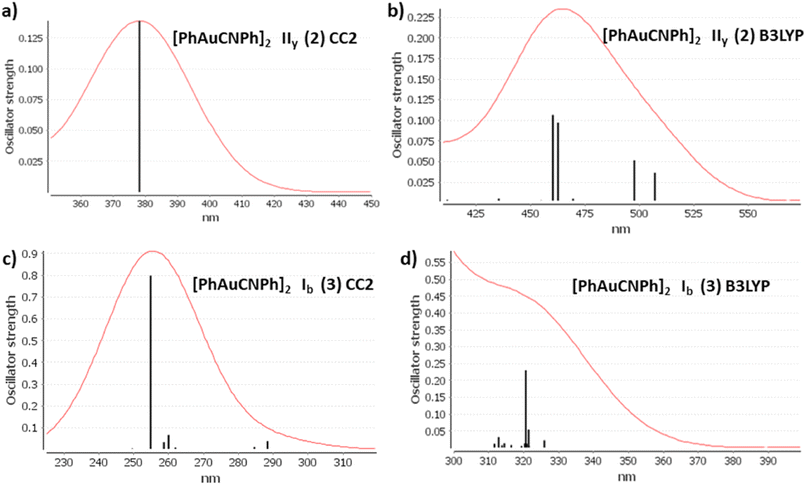
The discussion of the properties of excited states is focused on principal transitions obtained from theoretical calculations. The optical properties of monomer 1 are shown in the ESI.† Table 2 shows that the same main electronic transition MLML charge transfer is obtained between PhCN, Ph, and gold orbital ligands with an antibonding component for all calculation methods used. The magnitude of the electronic transition is between 288 nm and 245 nm. The optical properties change when we analyze dimeric models. An apparent intermolecular interaction effect changes the location and type of electronic transition. The simulated spectra of models IIy (2) and Ib (3) are shown in Fig. 3 at CC2 and B3LYP levels. The results obtained with other methods were very similar. The most important molecular orbitals necessary to describe the nature of electronic transitions are shown in Fig. 4 and 5.
The experimental spectra of solid-state gold complexes showed a characteristic band at 432 nm for IIy and at 315 nm for Ib. TDDFT calculations with dimer models provided absorption bands in the same range concerning the experimental spectrum. The details about electronic transitions and their respective orbital contributions are listed in Table 2. Each calculated spectrum showed a principal transition that depended on the model type. [AuPh(CNPh)]2 IIy (2) was close to the experimental value at DFT levels: B3LYP is 460 nm, PBE is 459 nm, and TPSS is 445 nm. However, for CC2 and SCS-CC2, their main bands are at 378 nm and 320 nm, respectively. The difference with DFT may be because, in CC2 and SCS-CC2 calculations, occupied and empty orbitals are more separated than in DFT. This is associated with higher energy electronic transitions. Iy model describes two main bands at 399 nm and 387 nm at B3LYP.59 This difference with the results of this work may be because model Iy only partially optimizes the geometry.
In contrast, this situation is repeated for the [AuPh(CNPh)]2 Ib (3) model. The principal band at B3LYP is 239 nm, PBE is 329 nm, and TPSS is 321 nm, very close to the experimental band at 315 nm. It is found that at CC2 and SCS-CC2 the main band is overestimated. Regarding the previously published theoretical model Ib, the values of its main band are at 302 nm and 335 nm at the B3LYP level. In this model, there is more coincidence between both studies.
Model IIy (2) has one principal transition at CC2 and B3LYP levels attributed to a metal ligand-to-metal–ligand charge transfer (MMCT), mainly centered among gold atoms, Ph, and CNPh from antibonding to bonding orbitals. The active molecular orbitals in the electronic transition are shown in Fig. 4. Conversely, model Ib (3) shows transitions generated between ligands with a low gold contribution. The active molecular orbitals in the electronic transition are shown in Fig. 5.
3.3 Emission energies
Aurophilic interactions are considered to be the main factor responsible for electronic spectroscopic features in most complexes, which have been proven to be highly dependent on the Au–Au distance.50,88 This was shown in the previous section. The obtained emission energies, the Au–Au distance in the ground state and excited states (S1 and T1) of IIy and Ib dimers are listed in Table 3. In both models, it is observed that the Au–Au distance decreases in the different DFT methods when going from the ground state to the excited one. For the case of model IIy, the decrease in the Au–Au distance is more relevant because of the increase of its covalent character in the excited state.| Model | Method | Au–Au (S0) | Au–Au (S1) | Au–Au (T1) | S1 → S0 eV (nm) | T1 → S0 eV (nm) |
|---|---|---|---|---|---|---|
| a [AuPh(CNPh)]n IIy emission band 2.19 eV (567 nm).56b [AuPh(CNPh)]n Ib emission bands 2.53 eV (490 nm), 2.72 eV (460 nm).56 | ||||||
| [AuPh(CNPh)]2 IIy | B3LYP-D3 | 300.6 | 273.1 | 279.3 | 1.86 (667) | 2.15 (576) |
| PBE-D3 | 300.6 | 275.6 | 280.6 | 1.83 (677) | 2.14 (579) | |
| TPSS-D3 | 298.9 | 271.7 | 278.3 | 1.89 (655) | 2.17 (572) | |
| Exp.a | ||||||
| [AuPh(CNPh)]2 Ib | B3LYP-D3 | 512.0 | 506.0 | 503.4 | 3.02 (407) | 3.03 (409) |
| PBE-D3 | 512.5 | 507.4 | 503.9 | 3.13 (396) | 3.03 (409) | |
| TPSS-D3 | 512.4 | 507.4 | 503.9 | 3.13 (396) | 3.12 (398) | |
| Exp.b | ||||||
For dimer IIy, S1 → S0 and T1 → S0 emission energies are very close among the three methods. The magnitude of the emission band T1 → S0 reproduces that of the experimental band at 2.19 eV (567 nm). This would confirm that the photophysical process involves a spin change. The same analysis for the Ib model is more difficult since the emission cannot be seen because magnitudes are very similar between T1 → S0 and S1 → S0. Both emission bands have magnitudes similar to that of the experimental emission band (2.53 eV and 2.72 eV). The results of the two models generate quantitatively better results than those proposed through the QC/MM of Ito and co-authors.59 For models Iy and Ib, they obtained transitions between 2.30 eV (539 nm) and 2.37 eV (523 nm) and 3.10 eV (399 nm) and 2.70 eV (459 nm), respectively.
3.4 Electronic solid state
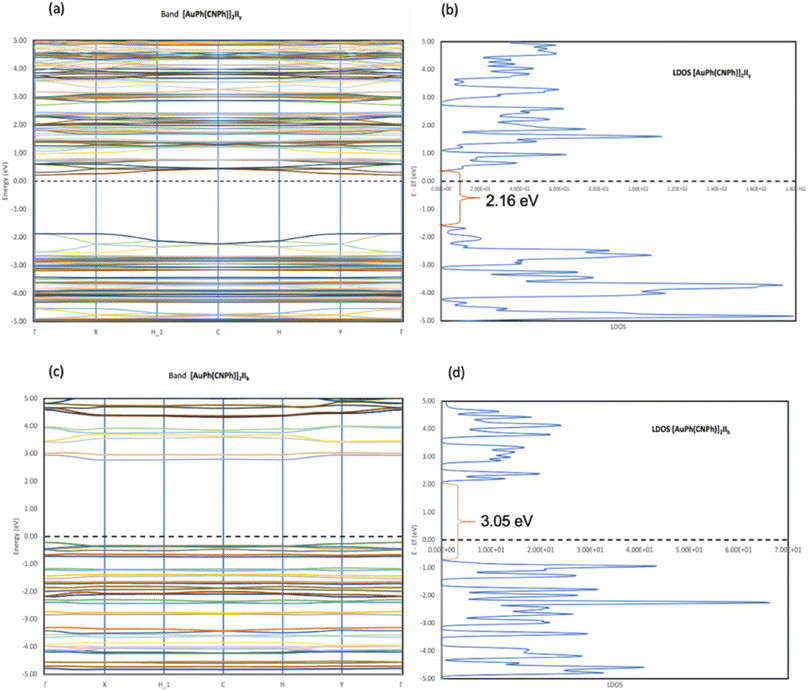
In Fig. 2, the crystalline structures of [AuPh(CNPh)]2 IIy and Ib (models 2′ and 3′) are depicted in their periodic forms. Crystal packing plays a crucial role in facilitating the movement of electrons in these systems. This is evident in model 2′, which has a rhombohedral structure with gold atoms closer at 3.199 Å, whereas in model 3′, with a triclinic structure, gold atoms are more distant, measuring 5.730 Å. Consequently, the proximity of gold atoms in the IIy system could facilitate the movement of electrons more efficiently than in the Ib system. This behavior of electrons agrees with results obtained for the band gap observed in Fig. 6, because the band gap value for model 2′ is 2.16 eV (574 nm). In contrast, for model 3′, it is 3.05 eV (407 nm), indicating that the movement of electrons requires less energy in model 2′ than in model 3′. These theoretical results agree with dimer systems IIy (2) and Ib (3) shown in Table 2, where the excitation energy is lower in IIy than in Ib, and the experimental data shows higher energy for system IIb than IIy. In consequence, the band gap is smaller in system IIy than in Ib, indicating that the proximity of gold atoms reduces the band gap, making IIy system more conductive. Conversely, in Fig. 6, band structures (Fig. 6a and c) and density of states (Fig. 6b and d) show the Fermi level closer to the conduction band in the IIy system, whereas in the Ib system, the Fermi level is closer to the valence band. Hence, the IIy system harbors a higher count of electrons in energy levels, enabling their unrestricted movement and engagement in electrical conduction, owing to the proximity of gold atoms. On the contrary, in the Ib system, fewer electrons are available to move and contribute to electrical conduction, leading to a more insulating behavior than IIy.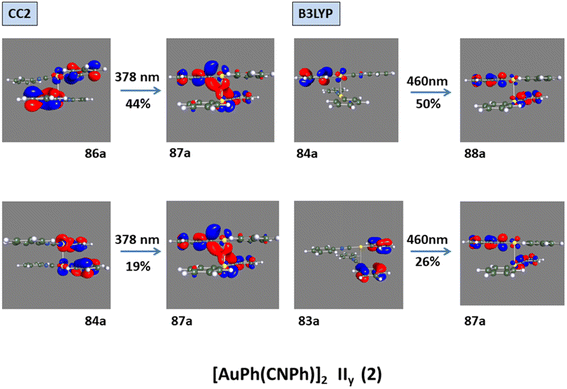 | ||
| Fig. 4 Most important active molecular orbitals in the electronic transition of [AuPh(CNPh)]2 IIy (2) at CC2 and B3LYP levels. | ||
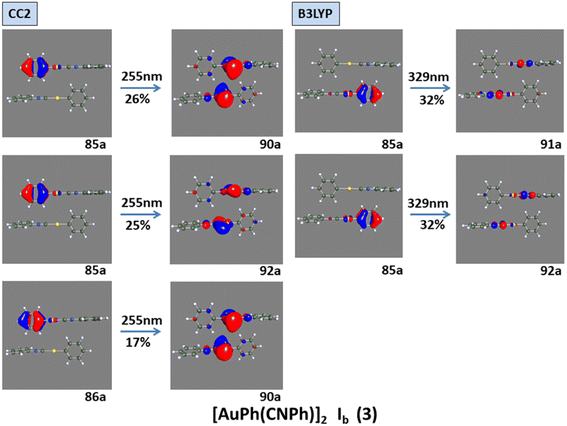 | ||
| Fig. 5 Most important active molecular orbitals in the electronic transition of [AuPh(CNPh)]2 Ib (3) at CC2 and B3LYP levels. | ||
4. Conclusion
The detailed study of [AuPh(CNPh)]2 gold complexes in their IIy (2 or 2′) and Ib (3 and 3′) forms reveals a series of significant findings. The aurophilic interaction is identified as a critical factor influencing the spectroscopic and structural properties of complexes. Theoretical simulations employing MP2, SCS-MP2, and DFT-D3(BJ) methods provide a detailed understanding of weak intermolecular interactions and excited states. The Au2Au distances are essential, and a decrease in these distances is observed in excited states, especially in the IIy system, indicating a more covalent nature in the excited state. The results of two dimeric structures agree with solid-state results. This directly impacts photophysical properties, such as emission and absorption energies, which closely align with experimental results.The analysis of optical and electronic properties, band gaps, and band structures offers a comprehensive insight into the relationship between aurophilic interaction and electronic behaviour of these systems. The solid states analysis confirms that the proximity of gold atoms in the IIy system facilitates electron movement, with a smaller band gap, thus this system exhibits a more conductive behaviour. Overall, these results confirm the significance of aurophilic interactions in the properties of gold complexes and demonstrate the utility of advanced theoretical approaches in understanding and predicting the properties of these systems. Previous theoretical models with MM/QM methodology complement the results presented in this work. Finally, the significant contributions of this manuscript are the understanding of the coordination chemistry and physics of excited states in gold complexes, opening new perspectives for the manipulation and application of these materials in nanotechnology and optoelectronics.
Conflicts of interest
The authors declare that they have no known competing financial interests or personal relationships that could have appeared to influence the work reported in this paper.Acknowledgements
Financial support of this work under Fondecyt projects 1220087 and 1221898 is gratefully appreciated. This research was partially supported by the supercomputing infrastructure of the NLHPC (ECM-02).References
- G. M. Whitesides and R. F. Ismagilov, Science, 1999, 284, 89–92 CrossRef CAS PubMed.
- R. F. Ludlow and S. Otto, Chem. Soc. Rev., 2008, 37, 101–108 RSC.
- Thinking in Complexity, ed. K. Mainzer, Spinger-Verlang, New York, 3rd edn, 1997 Search PubMed.
- E. Mattia and S. Otto, Nat. Nanotechnol., 2015, 10, 111–119 CrossRef CAS PubMed.
- B. Grzybowski, S. Otto and D. Philp, Chem. Commun., 2014, 50, 14924–14925 RSC.
- O. Miljanic, Chem, 2017, 2, 502–524 CAS.
- Non-covaleny Interactions in Quantum Chemistry and Physics, ed. A. Otero de la Roza and G. DiLabio, Elsevier, 2017 Search PubMed.
- V. W.-W. Yam, V. K.-M. Au and S. Y.-L. Leung, Chem. Rev., 2015, 115, 7589–7728 CrossRef CAS PubMed.
- E. R. T. Tiekink, Coord. Chem. Rev., 2017, 345, 209–228 CrossRef CAS.
- P. Pyykkö, Chem. Rev., 1997, 97, 597–636 CrossRef PubMed.
- P. Pyykkö, N. Runeberg and F. Mendizabal, Chem.– Eur. J., 1997, 3, 1451–1457 CrossRef.
- N. Runeberg, M. Schütz and H.-J. Werner, J. Chem. Phys., 1999, 110, 7210–7215 CrossRef CAS.
- P. Pyykkö, Angew. Chem., Int. Ed., 2004, 43, 4412–4456 CrossRef PubMed.
- E. ÓGrady and N. Kaltsoyannis, Phys. Chem. Chem. Phys., 2004, 6, 680–687 RSC.
- K. M.-C. Wong, V. K.-M. Au and V. W.-W. Yam, in Comprehensive Inorganic Chemistry II, ed. J. Reedijk, and K. Poeppelmeier, Elsevier, Oxford, UK, 2nd edn, 2013, pp. 59–130 Search PubMed.
- M.-C. Tang, A. K.-W. Chan, M.-Y. Chan and V. W.-W. Yam, Top. Curr. Chem. (Z), 2016, 46, 374–405 Search PubMed.
- J. M. López-de-Luzuriaga, M. Monge and M. E. Olmos, Dalton Trans., 2017, 46, 2046–2067 RSC.
- R. Donamaría, M. C. Gimeno, V. Lippolis, J. M. López-de-Luzuriaga, M. Monge and M. E. Olmos, Inorg. Chem., 2016, 55, 11299–11310 CrossRef PubMed.
- Modern Supramolecular Gold Chemistry, ed. A. Laguna, Wiley-VCH, Weinheim, 2008 Search PubMed.
- E. J. Fernández, J. M. López-de-Luzuriaga, M. Monge, M. Montiel, M. E. Olmos, J. Pérez, A. Laguna, F. Mendizabal, A. A. Mohamed and J. P. Fackler, Inorg. Chem., 2004, 43, 3573–3581 CrossRef PubMed.
- V. W.-W. Yam, A. K.-W. Chan and E. Y.-H. Hong, Nat. Rev. Chem., 2020, 10, 528–541 CrossRef.
- F. Caddeo, V. Fernaández-Moreira, M. Arca, A. Pintus, A. Laguna, V. Lippolis and M. C. Gimeno, Dalton Trans., 2021, 50, 9709–9718 RSC.
- Gold-Progress in Chemistry, Biochemistry and Technology, ed. H. Schmidbaur, John Wiley & Sons, New York, 1999 Search PubMed.
- H. Schmidbaur and A. Schier, Chem. Soc. Rev., 2008, 37, 1931–1951 RSC.
- J. P. Fackler, Inorg. Chim. Acta, 2015, 424, 83–90 CrossRef CAS.
- J. Gil-Rubio and J. Vicente, Chem.– Eur. J., 2018, 24, 32–46 CrossRef CAS PubMed.
- G. Tárkányi, P. Király, G. Pálinkás and A. Deák, Magn. Reson. Chem., 2007, 45, 917–924 CrossRef PubMed.
- A. Deák, T. Megyes, G. Tárkányi, P. Király, L. Biczók, G. Pálinkás and P. J. Stang, J. Am. Chem. Soc., 2006, 128, 12668–12670 CrossRef PubMed.
- A. Chu, F. K.-W. Hau, L.-Y. Yao and V. W.-W. Yam, J. Chin. Chem. Soc., 2019, 66, 1100–1104 CrossRef CAS.
- R. P. Herrera and M. C. Gimeno, Chem. Rev., 2021, 121, 8311–8363 CrossRef CAS PubMed.
- P. Pyykkö, J. Li and N. Runeberg, Chem. Phys. Lett., 1994, 218, 133–138 CrossRef.
- P. Pyykkö, Angew. Chem., Int. Ed., 2004, 43, 4412–4456 CrossRef PubMed.
- F. Mendizabal, S. Miranda-Rojas and L. Barrientos, Int. J. Quantum Chem., 2019, 119, e25675 CrossRef.
- P. Pyykkö and F. Mendizabal, Inorg. Chem., 1998, 37, 3018–3025 CrossRef.
- F. Mendizabal and P. Pyykkö, Phys. Chem. Chem. Phys., 2004, 4, 900–905 RSC.
- J. Muñiz, C. Wang and P. Pyykkö, Chem.– Eur. J., 2011, 17, 368–377 CrossRef PubMed.
- R.-F. Liu, C. A. Franzese, R. Malek, P. S. Zuchowski, J. G. Angyan, M. M. Szczesniak and G. Chalasinski, J. Chem. Theory Comput., 2011, 7, 2399–2407 CrossRef CAS PubMed.
- M. Andrejic and R. A. Mata, Phys. Chem. Chem. Phys., 2013, 15, 18115–18122 RSC.
- F. Mendizabal, S. Miranda-Rojas and L. Barrientos, Comput. Theor. Chem., 2015, 1057, 74–79 CrossRef CAS.
- E. Andris, P. C. Andrikopoulos, J. Schulz, J. Turek, A. Ruzicka, J. Roithova and L. Rulisek, J. Am. Chem. Soc., 2018, 140, 2316–2325 CrossRef CAS PubMed.
- F. Mendizabal, S. Miranda-Rojas and P. Castro-Latorre, Mol. Simul., 2020, 46, 521–529 CrossRef CAS.
- F. Mendizabal and S. miranda-Rojas, RSC Adv., 2020, 10, 33549–33557 RSC.
- P. Castro-Latorre, S. Miranda-Rojas and F. Mendizabal, RSC Adv., 2020, 10, 3895–3901 RSC.
- L. Magnko, M. Schweizer, G. Rauhut, M. Schütz, H. Stoll H and H.-J. Werner, Phys. Chem. Chem. Phys., 2002, 4, 1006–1013 RSC.
- P. Pyykkö, X.-G. Xiong and J. Li, Faraday Discuss., 2011, 152, 169–178 RSC.
- Q. Wan, J. Yang, W.-P. To and C.-M. Che, Proc. Natl. Acad. Sci. U.S.A., 2021, 118, e2019265118 CrossRef CAS PubMed.
- Q. Zheng, S. Borsley, G. S. Nichol, F. Duarte and S. L. Cockroft, Angew. Chem., Int. Ed., 2019, 131, 2–6 CrossRef.
- M. B. Brands, J. Nitsch and C. Fonseca-Guerra, Inorg. Chem., 2018, 57, 2603–2608 CrossRef CAS PubMed.
- P. Pyykkö, Chem. Soc. Rev., 2008, 37, 1967–1997 RSC.
- P. Pyykkö and F. Mendizabal, Chem.– Eur. J., 1997, 3, 1458–1465 CrossRef.
- F. Mendizabal, Organometallic, 2001, 20, 261–265 CrossRef CAS.
- S. Grimme, A. Hansen, J. G. Brandenburg and C. Bannwarth, Chem. Rev., 2016, 116, 5105–5154 CrossRef CAS PubMed.
- F. Mendizabal and S. Miranda-Rojas, RSC Adv., 2022, 12, 7516–7528 RSC.
- N. Mirzadeh, S. H. Privér, A. J. Blake, H. Schmidbaur and S. K. Bhargava, Chem. Rev., 2020, 120, 7551–7591 CrossRef CAS PubMed.
- T. P. Seifert, V. R. Naina, T. J. Feuersrein, N. D. Knöfel and P. W. Roesky, Nanoscale, 2020, 12, 20065–20088 RSC.
- H. Ito, M. Muromoto, S. Kurenuma, S. Ishizaka, N. Kitamura, H. Sato and T. Seki, Nat. Commun., 2013, 4, 2009 CrossRef PubMed.
- T. Seki, K. Sakurada and H. Ito, Angew. Chem., Int. Ed., 2013, 52, 12828–12832 CrossRef CAS PubMed.
- T. Seki, Y. Takamatsu and H. Ito, J. Am. Chem. Soc., 2016, 138, 6252–6260 CrossRef CAS PubMed.
- S. Aono, T. Seki, H. Ito and S. Sakaki, J. Phys. Chem. C, 2019, 123, 4773–4794 CrossRef CAS.
- J. Perdew, K. Burke and M. Ernzerhof, Phys. Rev. Lett., 1996, 77, 3865–3869 CrossRef CAS PubMed.
- A. D. Becke, Phys. Rev. A, 1988, 38, 3098–3100 CrossRef CAS PubMed.
- Y. Kanai, X. Wang and A. Selloni, J. Chem. Phys., 2006, 125, 234104–234110 CrossRef PubMed.
- S. Grimme, S. Ehrlich and H. Krieg, J. Chem. Phys., 2010, 132, 154104–154119 CrossRef PubMed.
- W. Hujo and S. Grimme, J. Chem. Theory Comput., 2011, 7, 3866–3871 CrossRef CAS PubMed.
- S. F. Boys and F. Bernardi, Mol. Phys., 1970, 19, 553–566 CrossRef CAS.
- P. Habza and R. Zahradnik, Chem. Rev., 1988, 88, 871–897 CrossRef.
- Turbomole: R. Ahlrichs, M. Bär, M. Häser, H. Horn and M. C. Kölmel, Chem. Phys. Lett., 1989, 162, 165–169 CrossRef CAS.
- M. J. Frisch, et al, Gaussian16, Pittsburgh, PA, 2003 Search PubMed.
- D. Andrae, M. Häusserman, H. Dolg, H. Stoll and H. Preuss, Theor. Chim. Acta, 1990, 77, 123–141 CrossRef CAS.
- A. Bergner, M. Dolg, M. W. Küchle, H. Stoll and H. Preuss, Mol. Phys., 1993, 80, 1431–1443 CrossRef CAS.
- T. Dunning and P. Hay, in Modern Theoretical Chemistry, ed. H. Schaefer, Plenum Press, 1997, vol. 3, pp. 1–28 Search PubMed.
- R. Bauernschmitt and R. Ahlrichs, Chem. Phys. Lett., 1996, 256, 454–464 CrossRef CAS.
- L. Olsen and P. Jörgensen, in Modern Electronic Structure Theory, ed. D. R. Yarkony, World Scientific, River Edge, NJ, 1995, vol. 2 Search PubMed.
- N. O. Winter and C. Hättig, J. Chem. Phys., 2011, 134, 184101–184115 CrossRef PubMed.
- M. Gerenkamp and S. Grimme, Chem. Phys. Lett., 2004, 392, 229–235 CrossRef CAS.
- N. O. Winter and C. Hättig, Chem. Phys., 2012, 401, 217–227 CrossRef CAS.
- H. Rabaa, M. A. Omary, S. Taubert and D. Sundholm, Inorg. Chem., 2018, 57, 718–730 CrossRef CAS PubMed.
- M. R. Dion, H. Schroder, E. Langreth and D. C. Lundqvist, Phys. Rev. B: Condens. Matter Mater. Phys., 2004, 92, 246401 CAS.
- J. Klimes, D. R. Bowler and A. Michaelides, J. Phys.: Condens.Matter, 2010, 22022201 Search PubMed.
- G. Kresse and J. Hafner, Phys. Rev. B: Condens. Matter Mater. Phys., 1993, 47, 558–561 CrossRef CAS PubMed.
- G. Kresse and J. Hafner, Phys. Rev. B: Condens. Matter Mater. Phys., 1994, 49, 14251–14269 CrossRef CAS PubMed.
- G. Kresse and J. Furthmuller, Phys. Rev. B: Condens. Matter Mater. Phys., 1996, 54, 11169–11186 CrossRef CAS PubMed.
- P. E. Blochl, Phys. Rev. B: Condens. Matter Mater. Phys., 1994, 50, 17953–17958 CrossRef PubMed.
- G. Kresse and D. Joubert, Phys. Rev. B: Condens. Matter Mater. Phys., 1999, 59, 1758–1775 CrossRef CAS.
- V. Wang, N. Xu, J. C. Liu, G. Tang and W. T. Geng, Comput. Phys. Commun., 2021, 267, 108033 CrossRef CAS.
- R. L. White-Morris, M. M. Olmstead, A. L. Balch, O. Elbjeirami and M. A. Omary, Inorg. Chem., 2003, 42, 6741–6748 CrossRef CAS PubMed.
- P. G. Jones, Z. Naturforsch., 1982, 37b, 823–824 CrossRef CAS.
- F. Mendizabal and S. Miranda-Rojas, RSC Adv., 2022, 12, 7516–7528 RSC.
Footnote |
| † Electronic supplementary information (ESI) available: Fig. S1 shows the electronic spectra at CC2 and B3LYP levels calculated for [PhAuCNPh] model 1. Fig. S2 shows the most important active molecular orbitals in the electronic transition of [AuPh(CNPh)] (1) at CC2 and B3LYP levels. See DOI: https://doi.org/10.1039/d3ra08935e |
| This journal is © The Royal Society of Chemistry 2024 |

