
 Open Access Article
 This Open Access Article is licensed under a Creative Commons Attribution-Non Commercial 3.0 Unported Licence
Silica-coated LiYF4:Yb3+, Tm3+ upconverting nanoparticles are non-toxic and activate minor stress responses in mammalian cells†
Kais Bietar a,
Siwei Chua,
Gabrielle Mandlb,
Emma Zhanga,
Naim Chabaytaha,
Renata Sabellia,
John A. Capobianco*b and
Ursula Stochaj*ac
a,
Siwei Chua,
Gabrielle Mandlb,
Emma Zhanga,
Naim Chabaytaha,
Renata Sabellia,
John A. Capobianco*b and
Ursula Stochaj*ac
aDepartment of Physiology, McGill University, Canada. E-mail: ursula.stochaj@mcgill.ca
bDepartment of Chemistry and Biochemistry, Centre for Nanoscience Research, Concordia University, Canada. E-mail: john.capobianco@concordia.ca
cQuantitative Life Sciences Program, McGill University, Montreal, Canada
First published on 14th March 2024
Abstract
Lanthanide-doped upconverting nanoparticles (UCNPs) are ideal candidates for use in biomedicine. The interaction of nanomaterials with biological systems determines whether they are suitable for use in living cells. In-depth knowledge of the nano–bio interactions is therefore a pre-requisite for the development of biomedical applications. The current study evaluates fundamental aspects of the NP–cell interface for square bipyramidal UCNPs containing a LiYF4:Yb3+, Tm3+ core and two different silica surface coatings. Given their importance for mammalian physiology, fibroblast and renal proximal tubule epithelial cells were selected as cellular model systems. We have assessed the toxicity of the UCNPs and measured their impact on the homeostasis of living non-malignant cells. Rigorous analyses were conducted to identify possible toxic and sub-lethal effects of the UCNPs. To this end, we examined biomarkers that reveal if UCNPs induce cell killing or stress. Quantitative measurements demonstrate that short-term exposure to the UCNPs had no profound effects on cell viability, cell size or morphology. Indicators of oxidative, endoplasmic reticulum, or nucleolar stress, and the production of molecular chaperones varied with the surface modification of the UCNPs and the cell type analyzed. These differences emphasize the importance of evaluating cells of diverse origin that are relevant to the intended use of the nanomaterials. Taken together, we established that short-term, our square bipyramidal UCNPs are not toxic to non-malignant fibroblast and proximal renal epithelial cells. Compared with established inducers of cellular stress, these UCNPs have minor effects on cellular homeostasis. Our results build the foundation to explore square bipyramidal UCNPs for future in vivo applications.
1. Introduction
Upconversion nanomaterials are important tools to advance the basic and applied sciences. They have become indispensable for nanomedicine, biophotonics, biosensing, and basic research.1,2 Among upconversion nanomaterials, lanthanide-doped upconversion nanoparticles (UCNPs) display unique excitation/emission properties.3,4 In particular, UCNPs do not photobleach or photoblink, have long luminescence lifetimes, as well as narrow excitation and emission bands.1,3–6 Due to their physical and chemical stability, fluoride-based UCNPs are ideal for biomedical applications.7By tailoring the size, morphology, emission/excitation spectrum, and functionalization of the particle surface, UCNPs are optimized for specific functions. For instance, non-spherical morphologies may increase the circulation time in biological systems when compared with spherical nanoparticles (NPs).8,9 Non-spherical NPs can also outperform their spherical counterparts with respect to cellular uptake and retention.10–12 LiYF4:Yb3+, Tm3+ UCNPs are well known for their square bipyramidal morphology and strong UV and blue upconversion luminescence upon 980 nm excitation.13 This shape arises because the lowest energy crystal plane of the tetragonal crystal phase of LiYF4 is the 011 plane, yielding 8 faces of equal surface energy.14 [This equal surface energy enables facile uniform coating of the NPs with a large number of different ligands or materials].15,16
The use of UCNPs is currently limited by the hurdles they encounter in biological systems. Some of these obstacles can be overcome by modifying their surface coating.17 In particular, the addition of silica shells provides distinct advantages.18,19 Silica coating increases colloidal and chemical stability, thus protecting against aggregation and dissolution in biological environments.18 Moreover, the coating with silica is reproducible, low cost, and ideally suited for the delivery of bioactive components.18 Silica shells that include functional groups on their surfaces can be used for the conjugation of ligands to the NP surface. NP surfaces that carry azides are especially attractive, as they are suitable for azide–alkyne click chemistry. However, the effects of these reactive groups on nano–bio interactions are largely unknown.
The first and often major barrier relevant to all in vivo applications of nanomaterials is cell toxicity. Furthermore, it is critically important that the sub-lethal effects elicited by UCNPs are well-defined and limited in scope. Nanomaterials can generate such sub-lethal effects by disrupting the homeostasis of healthy cells. Fibroblasts are main targets for nano–bio interactions. They are present throughout the mammalian body, where they are crucial for tissue, organ, and organismal homeostasis.20 Fibroblasts respond to a wide variety of endogenous and environmental signals, including tissue damage.21 Accordingly, they serve as a model system to study nanodelivery.22
Several cell types located in the kidney have emerged as targets for nanomedicine.23,24 Kidneys non-specifically accumulate NPs,25 which makes them especially vulnerable to the adverse effects of nanomaterials. Peritubular capillaries provide the route to kidney tubules. As a result, renal epithelia become vulnerable to deleterious nano–bio interactions (reviewed in ref. 25). Despite the importance of renal tubular cells for kidney function, their response to NPs remains understudied.26–29
Cultured cells are essential to assess critical aspects of nano–bio interactions in a rigorous fashion. This evaluation consists of two stages. First, initial experiments measure the acute toxicity of nanomaterials by scoring the loss of cell viability. Second, materials that pass this test are examined for their sub-lethal effects on cell physiology. To this end, appropriate biomarkers monitor the changes in cell shape and size, cytoskeletal organization, abundance or localization of relevant transcription factors, molecular chaperones (here called chaperones), and other biomolecules that are suitable to scrutinize cellular stress responses. Fig. 1 depicts the essential cellular pathways our study examined in UCNP-treated cells.
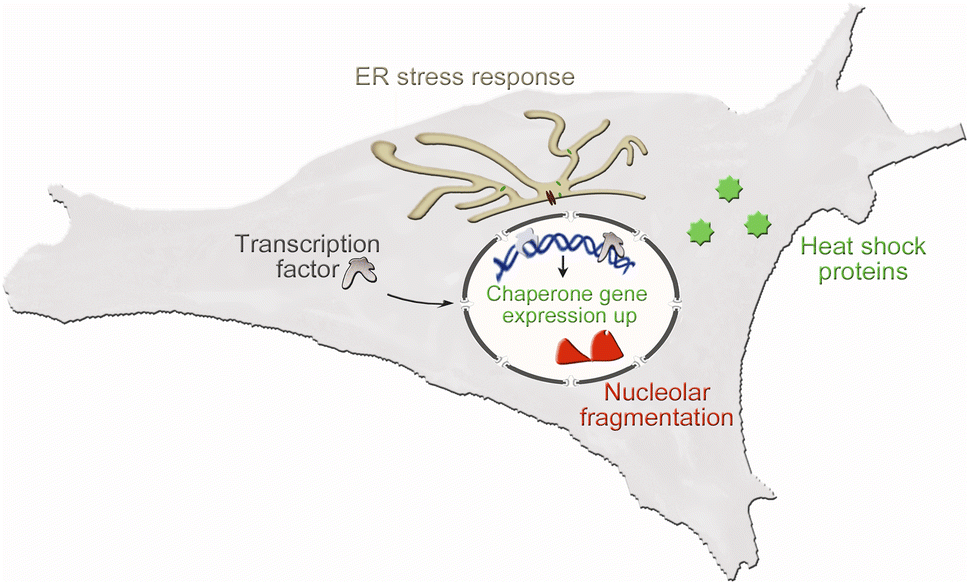 | ||
| Fig. 1 Stress pathways relevant to nano–bio interactions. Key stress responses were assessed in the current study. They include the translocation of transcription factors into the nucleus, fragmentation of the nucleolus, and the accumulation of heat shock proteins in the endoplasmic reticulum (ER) or cytoplasm. | ||
Stress responses are controlled by multi-component networks that include chaperones and additional cellular components. In particular, the transcription factors nuclear factor erythroid 2-related factor 2 (Nrf2) and nuclear factor kappa-B (NFκB) inform on oxidative stress induced by nanomaterials.28,30
Chaperones are necessary to adjust cell physiology to a wide variety of insults.31,32 For example, chaperone abundance may change when cells encounter UCNPs or other nanomaterials.28,30,33 The cellular uptake of UCNPs is generally mediated by membrane-delimited compartments.11 Therefore, chaperones relevant to membrane or vesicle trafficking, such as Grp78 and Grp94, are sensitive indicators of NP-induced stress. Under conditions of severe ER stress, the transcription factor C/EBP Homologous Protein (CHOP) increases in abundance and promotes apoptosis. Crosstalk between NFκB and CHOP fine-tunes the cellular responses to ER stress.34
NFκB also communicates with nucleoli, which are membrane-less compartments in the nucleus.35 Nucleoli assemble ribosomal subunits and function as stress sensors.36–39 Impairments in cellular homeostasis affect the overall nucleolar organization and individual nucleolar proteins.40,41 The transcription factor p53 is closely linked to nucleolar functions and a major indicator of stress.42 Additional proteins are suitable to report on nucleolar stress.28,43–46 In particular, nucleolin, fibrillarin and RPA194 are nucleolar proteins that respond to environmental and other insults.36
Aside from cell death, a possible consequence of stress exposure is the induction of cellular senescence.47 Senescent cells are viable and metabolically active. However, they can damage tissues, organs, and whole organisms through the secretion of a complex mixture of factors, known as the senescence-associated secretome. Hallmarks of cellular senescence include changes in cell and nuclear morphologies as well as a profound reorganization of the cytoskeleton and nuclear lamina.47–49 With the possible exception of cancer cells and wound healing, the induction of cellular senescence by nanomaterials will largely be an undesired outcome. Although NPs may trigger senescence in target cells, only few studies have explored this relationship.50
The physicochemical properties of nanomaterials are crucial for their impact on mammalian cells.51 Furthermore, the consequences of nano–bio interactions are also determined by the characteristics of the participating cells. Various biological processes determine the cell type-dependent effects of NPs. Specific examples are particle uptake, subcellular trafficking, intracellular distribution, and NP-induced toxicity. Differences in proliferation, plasma membrane composition, cytoskeletal organization, endocytosis, lysosomal and metabolic activities control cell fate upon exposure to NPs.52–54 In addition, the numerous cell types in the human body display profound variations in size and abundance.55 It can therefore be expected that NP-based applications can elicit a spectrum of responses that are shaped by the specific cells that interact with the NPs.
The present study was conducted to characterize the effects of square bipyramidal UCNPs on mammalian cells. We have focused on two types of silica-coated LiYF4:Yb3+, Tm3+ UCNPs, because no data are currently available on their nano–bio interactions. In particular, information on sub-lethal effects and cellular stress responses is missing. Our research aims to provide this knowledge and uncover potential UCNP-dependent changes in the physiology of fibroblasts and renal proximal tubule cells. Long-term, these data will facilitate the production of nanomaterials that are safe for the use in living organisms.
2. Materials and methods
2.1 Materials
All reagents were used without further purification. Lithium trifluoroacetate (97%, cat. AAL1680118) was purchased from Fisher Scientific (Oakville, ON). Yb2O3 (99.999%), Tm2O3 (99.999%) were purchased from Chemicals 101 Corp. (Toronto, ON). Oleic acid (90%, technical grade, no. 364525), 1-octadecene (90% technical grade, no. O806), tetraethylorthosilicate (TEOS, 98%, reagent grade, no. 131903), ammonium hydroxide (28–30% NH3 basis, ACS reagent, no. 221228), IGEPAL® CO-520 (Mn 441, no. 238643), trifluoroacetic acid (≥99.0%, no. 302031), were purchased from Millipore Sigma. 3-Azidopropyltriethoxysilane (AzPTES; 97%, no. SIA0777.0) was purchased from SelectLab Chemicals GmbH (Münster, Germany). 3 mm, 300 mesh copper grids coated with 10 nm thick Formvar film and stabilized with 1 nm thick evaporated carbon film were purchased from Electron Microscopy Sciences (Hatfield, PA).The source of primary antibodies and their dilutions for different applications are listed in Table 1. Affinity-purified secondary antibodies for immunolocalization were purchased from Jackson ImmunoResearch Laboratories, Inc. (USA). The dilution was 1![[thin space (1/6-em)]](https://www.rsc.org/images/entities/char_2009.gif) :400 for Alexa 488™ or Cy3-conjugated secondary antibodies. Affinity-purified HRP-conjugated secondary antibodies (Jackson ImmunoResearch Laboratories) were diluted 1:2000 for western blotting.
:400 for Alexa 488™ or Cy3-conjugated secondary antibodies. Affinity-purified HRP-conjugated secondary antibodies (Jackson ImmunoResearch Laboratories) were diluted 1:2000 for western blotting.
| Antibody targets | Supplier, catalog number | Dilution for IF | Dilution for WB |
|---|---|---|---|
| Actin | Chemicon, MAB1501 | NA | 1:100000 |
| CHOP | BioLegend; no. 948702 | NA | 1:1000 |
| eIF2α | Santa Cruz Biotechn., sc-30882 | NA | 1:500 |
| eIF2α | ABclonal, A0764 | NA | 1:500 |
| Phospho-eIF2α | Cell Signaling Techn.; #3597 | NA | 1:500 |
| Fibrillarin | Santa Cruz Biotechn., sc-25397 | 1:500 |
1:500 |
| GAPDH | Santa Cruz Biotechn., sc-32233 | NA | 1:2000 |
| Grp78 | Santa Cruz Biotechn., sc-13539 | NA | 1:1000 |
| Grp94 | Santa Cruz Biotechn., sc-393402 | NA | 1:1000 |
| Hsp70 | ENZO, ADI-SPA811 | NA | 1:2000 |
| Hsp90 | Santa Cruz Biotechn., sc-515081 | NA | 1:500 |
| Lamin A | Santa Cruz Biotechn., sc-20680 | 1:200 |
1:1000 |
| Lamin B | Santa Cruz Biotechn., sc-6216 | 1:400 |
1:1000 |
| NFκB | Santa Cruz Biotechn., sc-372 | 1:1000 |
1:500 |
| Nrf2 | Santa Cruz Biotechn., sc-365949 | 1:100 |
1:200 |
| Nucleolin | Santa Cruz Biotechn., sc-13057 | 1:400 |
1:500 |
| p53 | Cell Signaling Techn.; #2524 | NA | 1:1000 |
| PARP1 | ABclonal; A19596 | NA | 1:2000 |
| RPA194 | Santa Cruz Biotechn., sc-48385 | 1:400 |
1:500 |
| α-Tubulin | Santa Cruz Biotechn., sc-5286 | 1:200 |
1:1000 |
| VCP | BioLegend; no. 636802 | NA | 1:2000 |
| ZO-1 | Santa Cruz Biotechn., sc-33725 | 1:200 |
NA |
2.2 Synthesis of UCNPs
LiYF4:25 mol% Yb3+, 0.2 mol% Tm3+ UCNPs were synthesized using a one-pot thermal decomposition technique.56 The as-synthesized NPs were coated with unfunctionalized (Si-UCNP) and azide-functionalized (AzSi-UCNP) silica through a reverse microemulsion method.57 In a 20 mL scintillation vial, 25 mg of as-synthesized (oleate-capped) NPs were dispersed in 7 mL n-hexanes and sonicated for 15 min. 100 μL of IGEPAL® CO-520 was added to the dispersion, and the resulting mixture was sonicated for 5 min, followed by 10 min of stirring (1000 rpm, room temperature). 200 μL of IGEPAL® CO-520 was then added and the mixture was sonicated again for 5 min, followed by 10 min of stirring (1000 rpm, room temperature). After this, 200 μL of IGEPAL® CO-520 and 80 μL of ammonium hydroxide were added to the mixture, followed by sonication for 20 min. The mixture was then stirred (1000 rpm, room temperature) and the following steps were carried out depending on the type of coating desired. For the unfunctionalized silica coated UCNPs, 20 μL of TEOS was added in 5 μL aliquots every 30 min and stirred at room temperature for 48 hours. For the azide-functionalized silica coated UCNPs, 10 μL of TEOS was added in 5 μL aliquots every 30 min. After stirring for 24 hours, 10 μL AzPTES was added in 5 μL aliquots every 30 minutes. The mixture was then stirred for 24 hours. To purify the NPs (both coatings), the dispersions were each poured into a 15 mL centrifuge tube and 10 mL of acetone was added, followed by centrifugation at 10155×g for 15 min. The supernatant was discarded, and the resulting pellet was dispersed in 2 mL deionized water. 10 mL 99% ethanol were added to precipitate the NPs. The NPs were collected by centrifugation (10155×g, 15 min). This process was repeated three times to purify the silica coated NPs, which were stored as a pellet in ultrapure water at room temperature.
2.3 Characterization of UCNPs
Transmission electron microscopy (TEM) images were acquired with a Thermo Scientific Talos L120C electron microscope operating at an accelerating voltage of 100 kV.Zeta potential was measured at 25 °C using a 0.5 mg mL−1 dispersion of AzSi- or Si-UCNPs in distilled water (pH 7.4) or DMEM (pH 7.4) on a Malvern Zetasizer Nano ZSM using a DTS1070 disposable folded capillary cell. Zeta potential measurements were performed under identical conditions for both samples.
Attenuated total reflectance Fourier transform infrared spectroscopy (ATR-FTIR) was performed in the solid state using a Thermo Scientific Nicolet iS5 spectrometer equipped with the iD5 accessory with a laminate-diamond crystal window. Spectra were recorded with a resolution of 0.4 cm−1 and 64 scans were averaged per spectrum.
Powder X-ray diffraction was performed on a Bruker AXS D2 Phaser at a step size of 0.02° over a range of 10–65° 2θ. The spectrometer was equipped with a Cu-Kα source (λ = 1.54178 Å) operating at 30 kV and 10 mA for excitation and a Bruker LYNXEYE detector operating in θ/2θ scanning geometry.
Upconversion emission spectroscopy was performed on a 1 mg mL−1 dispersion of AzSi- or Si UCNPs (2 mg mL−1) in phenol red-free DMEM in a 1 cm path length quartz cuvette (Thorlabs). A handheld 976 nm diode laser (SkyLaser, 1 W, 0.450 W cm−2) was used to excite the NPs. The emissions were collected perpendicular to the excitation source with a 600 μm optical fiber (OceanOptics Inc.) and a 330–807 nm band pass filter (Newport Inc. 10-CLVR-3) before detection with a Princeton Instruments FERGIE BRX-VR UV-NIR spectrograph fitted with a 250 grooves per mm grating blazed at 550 nm with a 50 μm entrance slit.
2.4 Cell lines, cell culture and incubation with UCNPs
Cells were grown on poly-lysine coated coverslips or cell culture dishes as described.28,30 In brief, one day before the treatment, cells were seeded on coverslips or dishes and incubated under standard growth conditions (37 °C, 5% CO2). Immediately before use, aqueous UCNP stock suspensions were sonicated (3 minutes, room temperature; Dareflow bath sonicator, PS-10A), diluted in sterile water to 1 mg mL−1 and sonicated again (2 minutes, room temperature). UCNPs were then added to the growth medium to achieve the desired final concentration. Sterile water served as vehicle control. After incubation for 24 hours, the cultures reached 60–70% confluency and were processed for immunostaining or western blotting. Except for the viability assays, the final concentration of UCNPs was 100 μg mL−1 throughout the study.
For comparison with UCNP-induced stress responses, cells were treated for 1 hour with 1 mM dithiothreitol (DTT) or for 24 hours with 1 μg mL−1 tunicamycin. For heat stress, cells were kept at 43 °C for 3 hours, followed by a 1 hour recovery period at 37 °C.59
2.5 Viability assays
The procedure described in Section 2.4 was applied to grow cells in 96-well plates. Following incubation with vehicle or increasing concentrations of UCNPs, cell viability was determined with Alamar Blue (Acros), as published by us.28 In brief, following treatment with UCNPs, cells were incubated with 25 μg mL−1 resazurin (final concentration) under standard growth conditions. Absorbance was then measured at 570 and 600 nm with a Tecan Infinite M1000 plate reader. A minimum of three independent experiments were conducted for each UCNP concentration.2.6 Immunofluorescence
The methods applied for immunofluorescent staining have been published earlier.28 Cells grown on coverslips coated with poly-L-lysine were treated with UCNPs as described in Section 2.4. All subsequent steps were performed at room temperature. Cells were washed with PBS, fixed with 3.7% formaldehyde in PBS for 20 minutes and rinsed again with PBS. Cell membranes were permeabilized for 5 minutes (PBS, 0.1% Triton X-100, 2 mg mL−1 BSA, 1 mM NaN3), and samples were incubated for 1 hour with blocking buffer (PBS, 0.05% Tween 20, 5% bovine calf serum, 1 mM NaN3). Primary antibodies diluted in blocking buffer were added overnight. After washing with blocking buffer (three times, 5 minutes per wash), fluorescently labelled secondary antibodies were diluted in blocking buffer and added for 2 hours. Coverslips were washed again, and DNA was stained with 4′,6-diamidino-2-phenylindole (1 μg mL−1 in blocking buffer, 2 minutes). Coverslips were mounted on slides and sealed. Control samples were incubated under identical conditions, but in the absence of primary antibodies. For the visualization of microtubules in fibroblasts with antibodies against α-tubulin, cells were fixed with methanol, following published protocols.30 The source and dilutions of antibodies are depicted in Table 1.2.7 Microscopy and image analysis
The imaging protocols for UCNPs have been described earlier.28,46 A Zeiss LSM780 confocal microscope, equipped with an IR-OPO laser was used to image UCNPs after excitation at 976 nm. To evaluate biomarkers by immunostaining, imaging was performed with a Nikon Optiphot or Nikon Eclipse microscope equipped with a 40× objective. For individual data sets, all images were acquired with identical settings. Image analysis was conducted with ImageJ for at least 30 cells per condition and for each data set. In brief, following background correction, pixel intensities were measured for the regions of interest, and the pixel intensity/area was calculated. Bar graphs depict the results of at least three independent experiments; details are specified in the figure legends.2.8 Western blotting
The generation of crude cell extracts, western blotting, and enhanced chemiluminescence followed published protocols.28,50 Cells were grown in culture dishes and treated with UCNPs as described in Section 2.4. After incubation with or without UCNPs, dishes were washed twice with PBS. Dishes were stored at −70 °C. For the preparation of crude extracts, samples were suspended in 0.5-fold concentrated gel sample buffer, collected into Eppendorf tubes and incubated for 15 minutes at 95 °C. Following vortexing with 0.5 mm zirconia/silica beads (3 minutes, room temperature), samples were centrifuged for 5 minutes at 15871×g. Trichloroacetic acid was added to supernatants to a final concentration of 10% (w/v), and samples were kept for 20 minutes on ice. Sediments were collected by centrifugation (2 minutes, 15871×g) and resuspended in 2-fold concentrated gel sample buffer, pH 8, supplemented with protease and phosphatase inhibitors. Aliquots of the crude extracts were separated by SDS-PAGE on gradient polyacrylamide gels. Primary antibodies and their dilutions are listed in Table 1. Raw data files for western blots are provided in the ESI.†
2.9 Statistical evaluation
Bar graphs for western blotting and image analyses represent the averages of results obtained for at least three independent experiments ± standard error of the means (SEM). Statistical evaluation was performed with a two-tailed Student's t-test for the comparison of two groups. More than two groups were compared with one-way ANOVA combined with Bonferroni correction. All figures show pairwise comparisons between the vehicle control and the treated sample. Significant differences are indicated as follows: *, p < 0.05; **, p < 0.01, and ***, p < 0.001. Significant differences between Si-UCNPs and AzSi-UCNPs are marked with #, p < 0.05; ##, p < 0.01.3. Results and discussion
The current study was conducted to determine the physicochemical properties of Si-UCNPs and AzSi-UCNPs and measure their impact on mammalian cell physiology. The potential effects of the azide group on the NP surface is of particular interest, as it can be used to covalently attach therapeutic or other molecules to the NP surface.3.1 Physicochemical properties of UCNPs
Transmission electron microscopy shows the square bipyramidal morphology of UCNPs with an average core length of 98.3 ± 6.5 nm (Table 2, Fig. 2). Powder X-ray diffraction confirmed the expected tetragonal crystal phase of the UCNPs (Fig. S1a†). ATR-FTIR confirms the presence of the pendant azide groups on AzSi-UCNPs (2100 cm−1, N–N stretch) and the silica coating on both AzSi- and Si-UCNPs as evidenced by the bands centered at 1000 cm−1 (Si–O stretch; Fig. S1b†).| Parameter | Si-UCNP | AzSi-UCNP |
|---|---|---|
| Host matrix | LiYF4 | |
| Sensitizer | 25 mol% Yb3+ | |
| Activator | 0.2 mol% Tm3+ | |
| Morphology | Square bipyramidal | |
| Coating | Unfunctionalized silica | Azide-functionalized silica |
| Core size; length [nm] | 98.3 ± 6.5 | 98.3 ± 6.5 |
| Core size; width [nm] | 52.3 ± 4.3 | 52.3 ± 4.3 |
| Size + shell, length [nm] | 109.5 ± 7.0 | 111.2 ± 6.8 |
| Size + shell, width [nm] | 71.6 ± 4.8 | 73.0 ± 5.9 |
| Shell thickness at edge [nm] | 10.2 ± 1.1 | 10.4 ± 1.4 |
| Shell thickness at apex [nm] | 5.4 ± 1.0 | 5.5 ± 0.9 |
| Zeta potential in water, 0.5 mg mL−1 Ln-UCNP [mV] | −11.5 ± 2.3 | −16.3 ± 0.4 |
| Zeta potential in DMEM, 0.5 mg mL−1 [mV] | −4.1 ± 0.1 | −9.0 ± 0.5 |
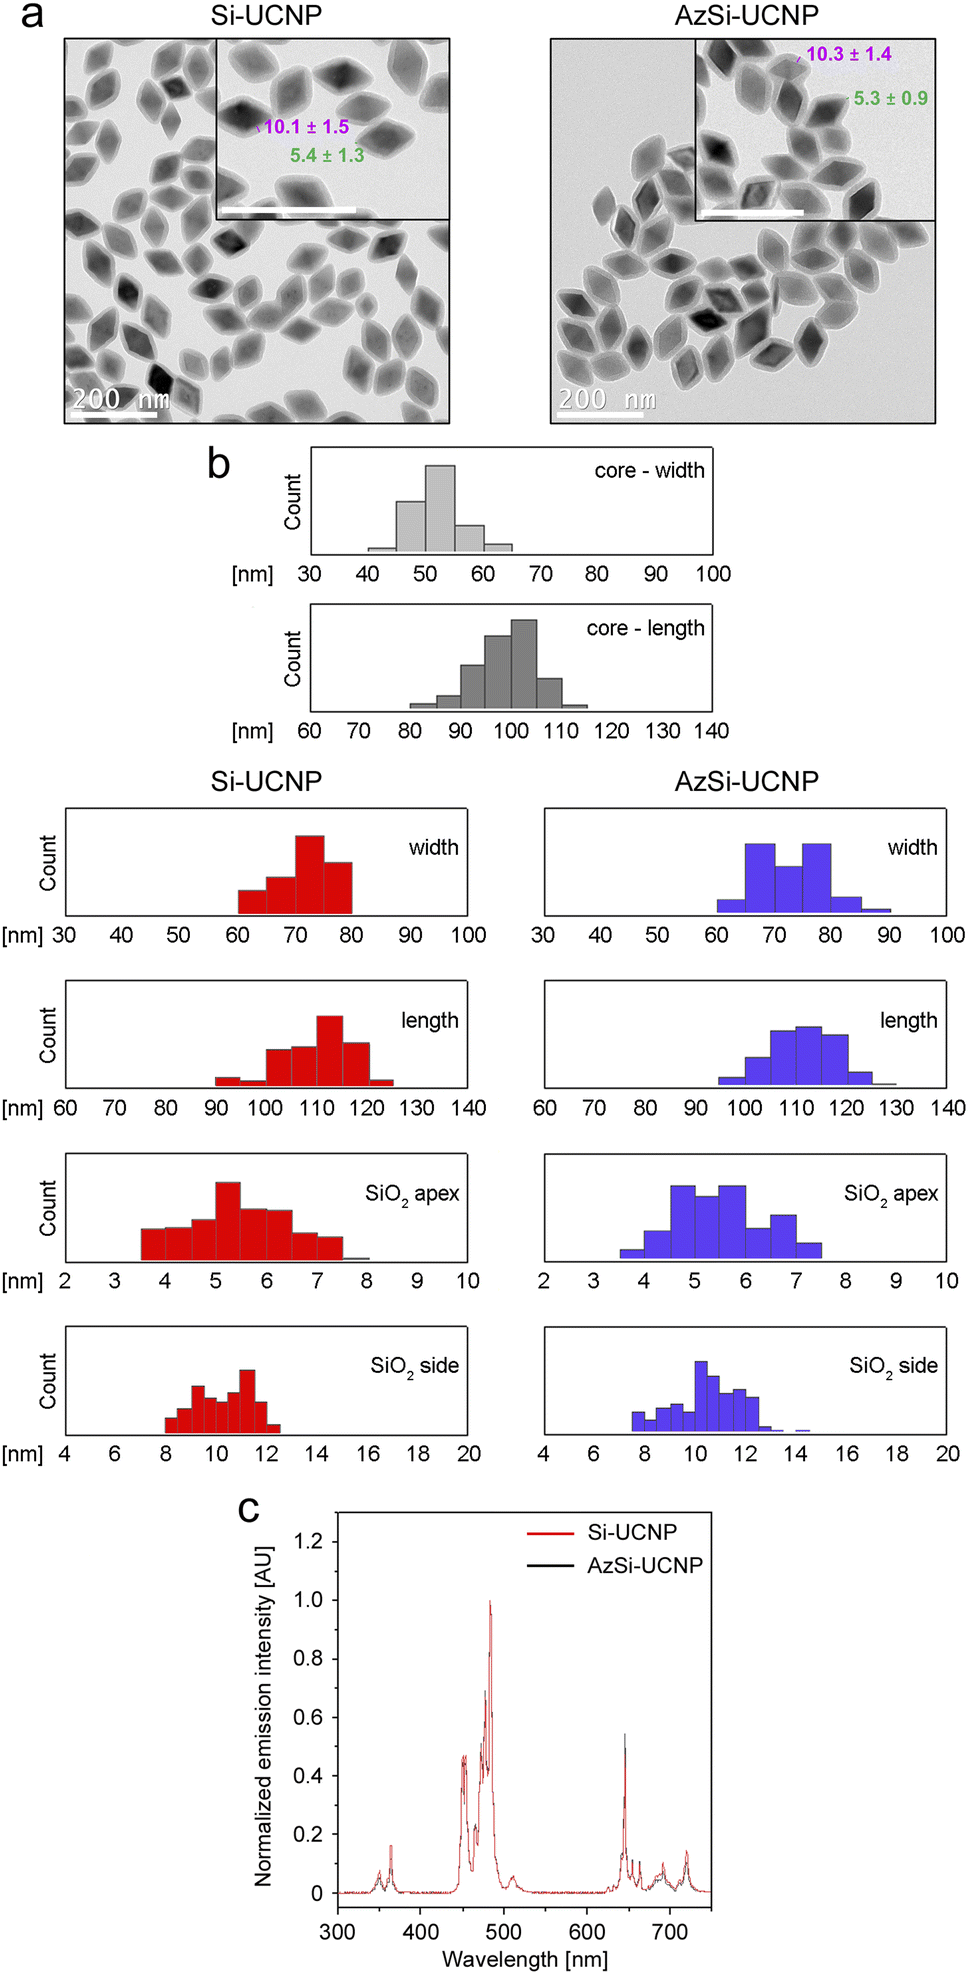 | ||
| Fig. 2 Characterization of Si-UCNP and AzSi-UCNP. (a) Representative transmission electron microscopy images of UCNPs used in this study. The average thickness of the shell at the edge (magenta) and apex (green) is depicted in nm. Scale bars are 200 nm. (b) Si-UCNP and AzSi-UCNP have comparable properties related to the particle width, length, and thickness of the silica shell at the apex and side. (c) Upconversion emission spectra (2 mg mL−1 UCNPs in phenol red-free DMEM) of Si-UCNPs (red trace) and AzSi-UCNPs (black trace) upon excitation at 976 nm. AU, arbitrary units. Additional details on particle properties are listed in Table 2. | ||
The zeta potentials of Si-UCNP and AzSi-UCNP in distilled water at physiological pH were −11.5 ± 2.3 mV and −16.3 ± 0.4 mV, respectively. This agrees with our previously reported values and the intrinsic negative charge of silica.60,61 Azide-functionalized silica produces a more negative surface charge due to the negative charge on the terminal nitrogen atoms in the azide groups.62 In cell culture medium (DMEM), the surface charges of both NPs were reduced to −4.1 ± 0.1 mV for Si-UCNPs and −9.0 ± 0.5 mV for AzSi-UCNPs. This can be attributed to the electrostatic coordination of cations present in DMEM to the surface of the NPs. Following illumination with infrared light at 976 nm, UCNPs emit light at different wavelengths (Fig. 2c). This property was used to visualize the uptake of UCNPs by mammalian cells (see below).
3.2 Effect of UCNPs on cell viability
For simplicity, we refer to Si-UCNP or AzSi-UCNP collectively as “UCNPs” throughout the text. If results differ for Si-UCNP or AzSi-UCNP, they are described separately. A first set of experiments determined whether UCNPs alter the viability of NIH3T3 or LLC-PK1 cells. To this end, chromogenic assays monitored the performance of mitochondria. After a 24 hour incubation period with a wide range of concentrations (final concentration 0 to 100 μg mL−1), no significant changes in cell viability were detected (Fig. 3). When the incubation period was extended to 3 or 5 days, the viability was significantly reduced with high UCNP concentrations for NIH3T3 fibroblasts, but not for LLC-PK1 cells (Fig. S2†).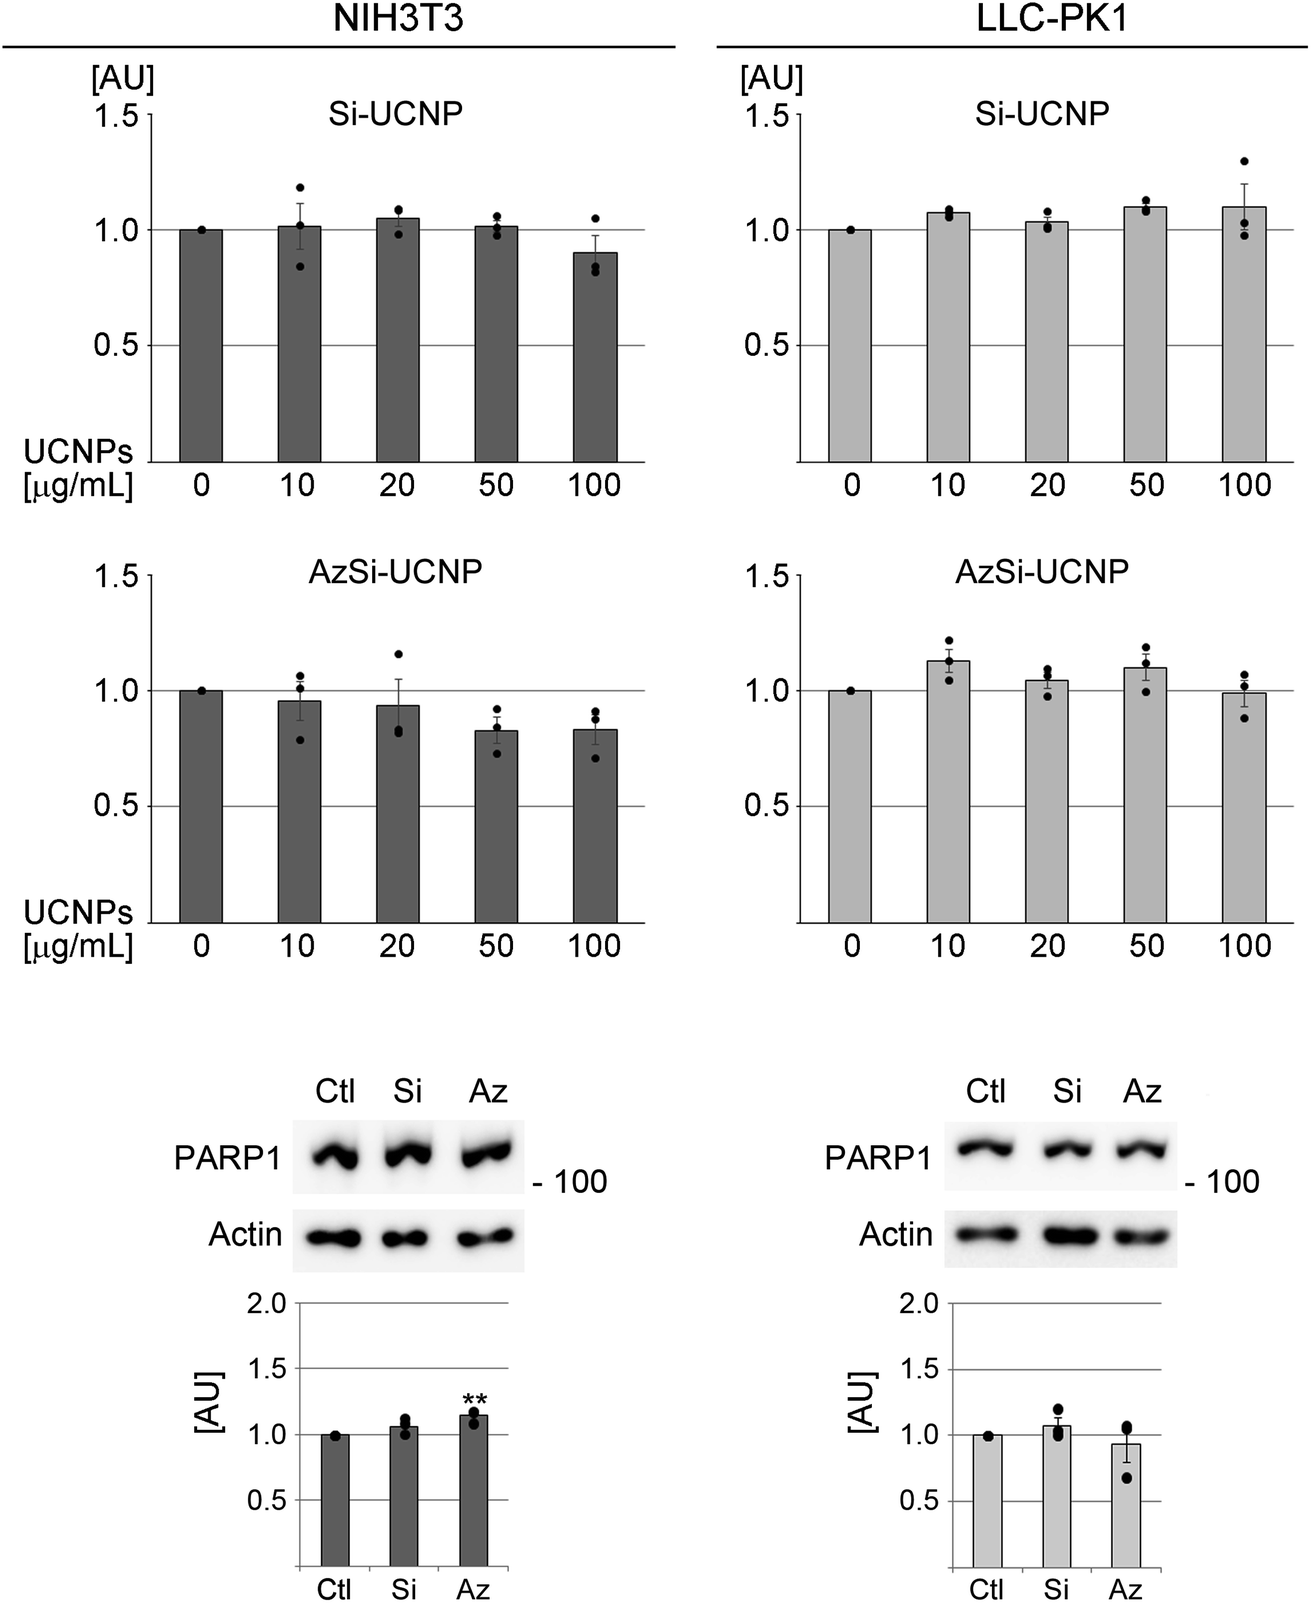 | ||
| Fig. 3 Effects of UCNPs on the viability of NIH3T3 fibroblasts and LLC-PK1 cells. Cells were incubated for 24 hours with increasing concentrations of UCNPs as specified in the figure. The left side depicts results for NIH3T3 fibroblasts; the right side shows data for LLC-PK1 cells. Western blots assessed the possible loss of PARP1 in UCNP-treated cells. The molecular mass of marker proteins is shown in kD at the right margin of the blots. Bar graphs represent averages ± SEM for at least three independent experiments. Results were normalized to control samples incubated with vehicle. Graphs show the ratio of PARP1/actin. (Black circles represent individual data points). Statistical evaluation was performed with one-way ANOVA and Bonferroni post hoc correction; **, p < 0.01. AU, arbitrary units. | ||
Independent evidence for the lack of cell death after 24 hour incubation with UCNPs was obtained by western blot analyses of PARP1. Apoptosis is associated with PARP1 cleavage,63 which leads to a loss of full-length PARP1. However, UCNPs did not profoundly alter PARP1 abundance in fibroblasts or renal proximal tubule cells (Fig. 3). On the other hand, PARP1 abundance was significantly reduced with other stressors (Fig. S3†).
Taken together, data in Fig. 3 demonstrate that 24 hour treatment with Si-UCNPs and AzSi-UCNPs has no or negligible toxicity in cell lines of different origins. As many NPs are rapidly cleared in living organisms,64 subsequent experiments were conducted for a 24 hour incubation period.
3.3 Cellular uptake of UCNPs
The lack of cellular toxicity of Si-UCNPs and AzSi-UCNPs may be explained by their failure to interact with cells. To address this point, we conducted imaging experiments that simultaneously detect UCNPs and the protein ZO-1. ZO-1 is a peripheral membrane protein that is concentrated at cell–cell junctions.65 In fibroblasts, a pool of ZO-1 is also present in intracellular locations.66 ZO-1 was used to delimit LLC-PK1 and NIH3T3 cells, because the selected antibody is suitable for immunostaining in different cell lines. While the staining patterns for ZO-1 may differ in epithelial and non-epithelial cells,67 the method clearly demarcated renal proximal epithelial cells and fibroblasts. The presence of ZO-1 in the nucleus is consistent with previous reports, which suggest a role for zonula occludens proteins, including ZO-1, in cell nuclei.68,69As shown in Fig. 4, Si-UCNPs and AzSi-UCNPs associated with NIH3T3 and LLC-PK1 cells. Notably, the Si-UCNPs and AzSi-UCNPs exhibit luminescence upon 976 nm excitation, enabling direct identification of UCNPs within the cells. The cyan signals observed in Fig. 4 are attributed to the 1G4 → 3H6 transition of Tm3+. A portion of the internalized UCNPs formed agglomerates that were composed of multiple UCNPs and thus are easily detectable by confocal microscopy. These agglomerates predominantly resided in the cytoplasm of cells. No signals were seen in the channel used to detect UCNPs when cells were incubated with medium only (Fig. S4†). Collectively, results in Fig. 4 demonstrate UCNP uptake by fibroblasts and renal proximal tubule cells. At the same time, the particles had only minimal effects on cell viability, emphasizing that UCNP internalization does not trigger rapid cell death (Fig. 3).
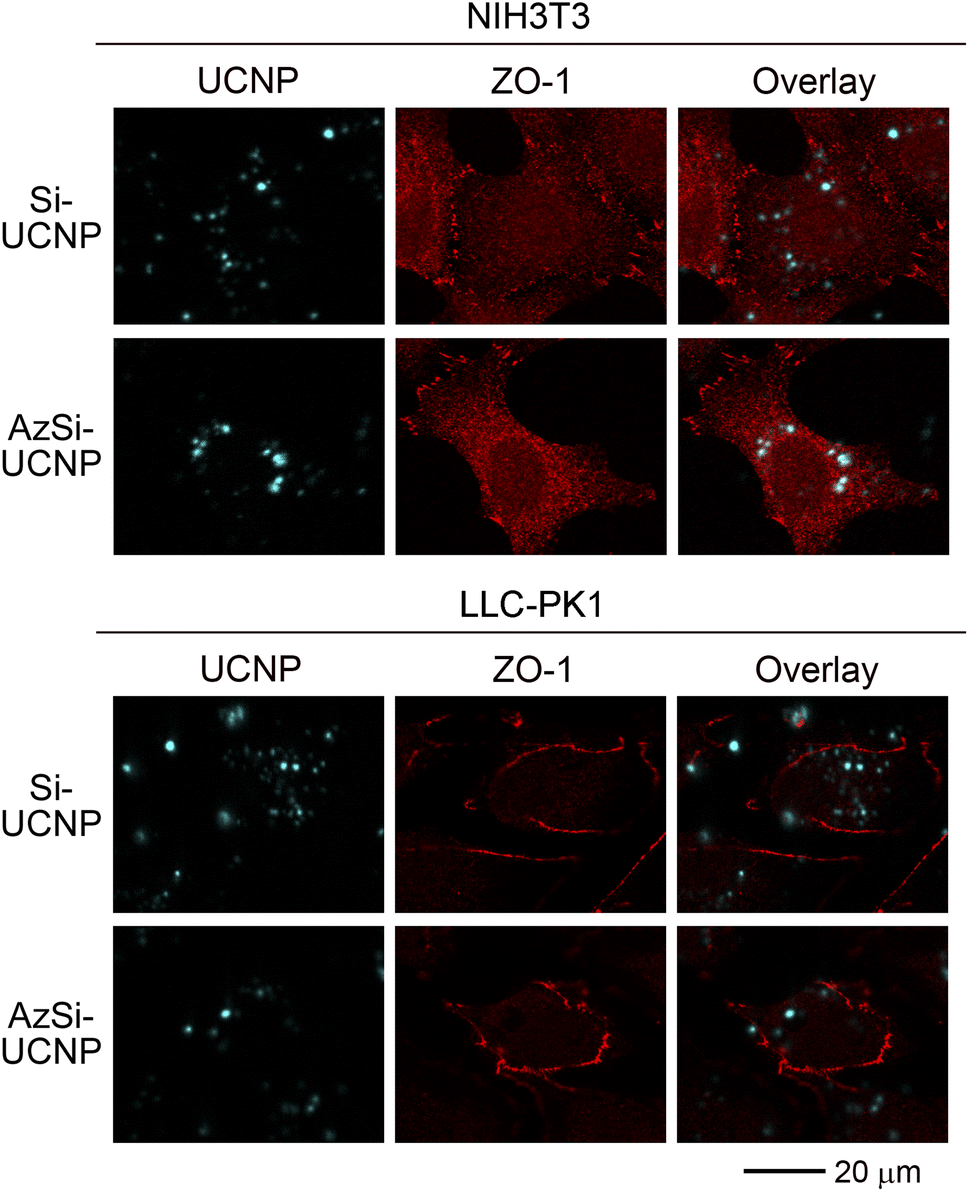 | ||
| Fig. 4 UCNP uptake by fibroblasts and renal proximal tubule cells. NIH3T3 fibroblasts and LLC-PK1 cells were incubated for 24 hours with 100 μg mL−1 Si-UCNPs or AzSi-UCNPs. After fixation, cell borders were demarcated with antibodies against ZO-1. Images were acquired as described earlier.46 Scale bar is 20 μm. | ||
3.4 Effects of UCNPs on nuclear lamins and cytoplasmic microtubules
The nuclear envelope maintains cellular homeostasis by separating the nucleoplasm from the cytoplasm. Proteins of the nuclear envelope, especially nuclear lamins, preserve the shape and integrity of the nucleus.70 Changes in the distribution and abundance of lamin A and B are linked to stress and senescence.71 The nuclear envelope is connected to filament systems in the cytoplasm. This connection supports the communication between the nucleoskeleton and cytoplasmic microtubules.70 Together, nuclear and cytoplasmic filament systems regulate cell shape and size. Relevant to the potential impact of nanomaterials, cell and nuclear size increase in senescent cells.48 By contrast, cell shrinkage and pyknotic nuclei are key features of apoptotic cells.72,73Common to both NIH3T3 and LLC-PK1 cells, UCNPs diminished the abundance of full-length lamin B, and this effect was more pronounced for AzSi-UCNPs (Fig. 5b). Interestingly, the immunolocalization studies did not fully recapitulate these differences. It is possible that proteolytic products of lamin B contributed to the pixel intensities measured in Fig. 5a.
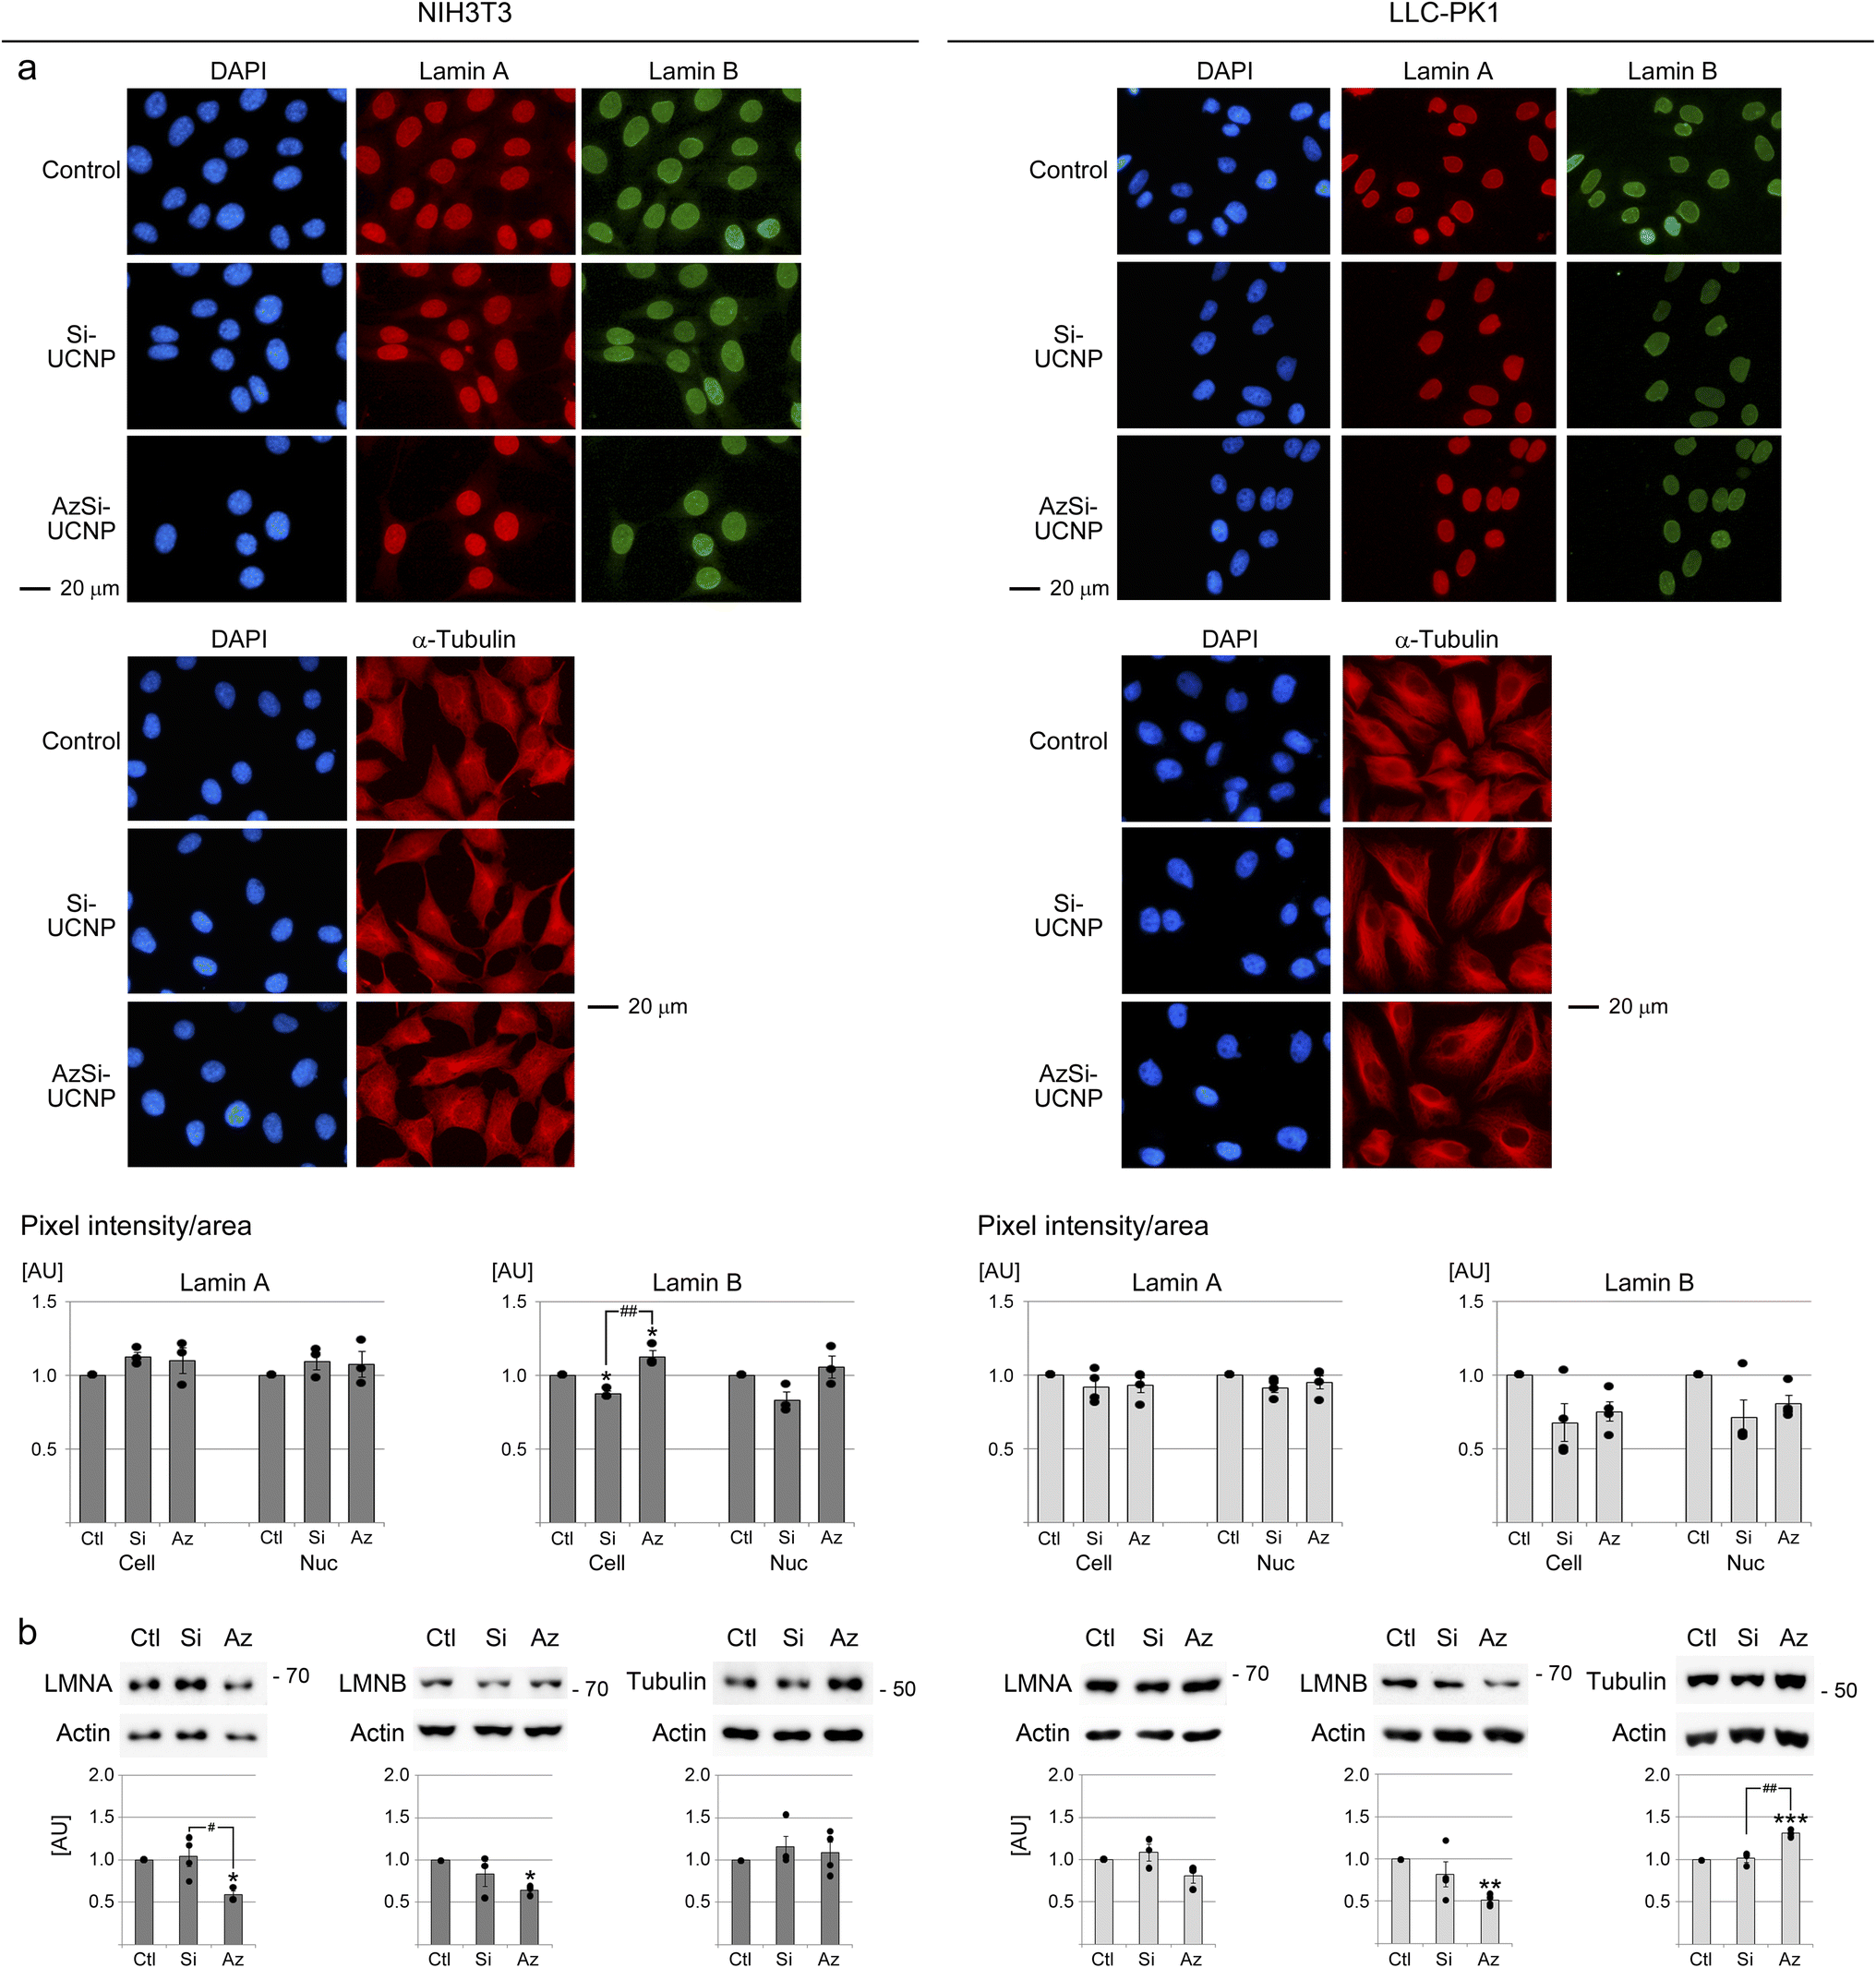 | ||
| Fig. 5 Effects of UCNPs on nuclear lamins and on α-tubulin. NIH3T3 or LLC-PK1 cells were incubated for 24 hours with vehicle, 100 μg mL−1 Si-UCNP or AzSi-UCNPs. (a) The distribution of lamin A, lamin B or α-tubulin was monitored by immunolocalization. Images were acquired and the pixel intensities in the whole cell and in the nucleus were quantified for three independent experiments (see Materials and methods for details). All scale bars are 20 μm. (b) The abundance of lamin A, lamin B and α-tubulin was measured for at least three independent experiments. Results were normalized to vehicle controls. Graphs depict the ratio of the protein of interest/actin. (a and b) One-way ANOVA combined with Bonferroni post hoc correction identified significant differences between the vehicle control and individual treatment groups; *, p < 0.05; **, p < 0.01; ***, p < 0.001. Significant differences between Si-UCNPs and AzSi-UNCPs are marked with #, p < 0.05; ##, p < 0.01. AU, arbitrary units. | ||
The UCNP-dependent loss of full-length lamin B may suggest that senescence was triggered in a subpopulation of cells. However, UCNPs did not affect the size or morphology of cells or nuclei (Fig. S5† and 5a). As well, there was no significant change in the ratio of nuclear area/cytoplasmic area (Fig. S5†). Furthermore, our experiments did not uncover cell shrinkage or the accumulation of cells with pyknotic nuclei. These results support the idea that a 24 hour UCNP treatment did not cause cellular senescence or apoptosis at detectable levels.
3.5 Impact of UCNPs on Nrf2 and NFκB; GAPDH, biomarkers of oxidative stress
Nrf2 and NFκB are among the first cellular responders to oxidant exposure.74,75 Both transcription factors accumulate in the nucleus when cells are stressed.76 As part of the cellular antioxidant defense reaction, Nrf2 also increases in abundance.77 GAPDH is a marker of oxidative stress;78 GAPDH levels diminish when cells enter senescence.48 On the other hand, pro-apoptotic conditions upregulate GAPDH, at least in cancer cells.79Fig. 6 evaluates the effects of UCNPs on Nrf2, NFκB and GAPDH in NIH3T3 and LLC-PK1 cells. Nrf2 was in the nucleus and cytoplasm of fibroblasts, but mostly nuclear in renal proximal tubule cells. Quantification of the fluorescence intensities in the whole cell, nucleus, and cytoplasm revealed that UCNPs did not induce significant changes in the nucleocytoplasmic distribution of Nrf2 or NFκB (Fig. 6a). Moreover, no significant differences were revealed for the abundance of Nrf2 or NFκB (Fig. 6b). Si-UCNPs reduced the levels of GAPDH in NIH3T3 cells, but had no impact on LLC-PK1 cells.
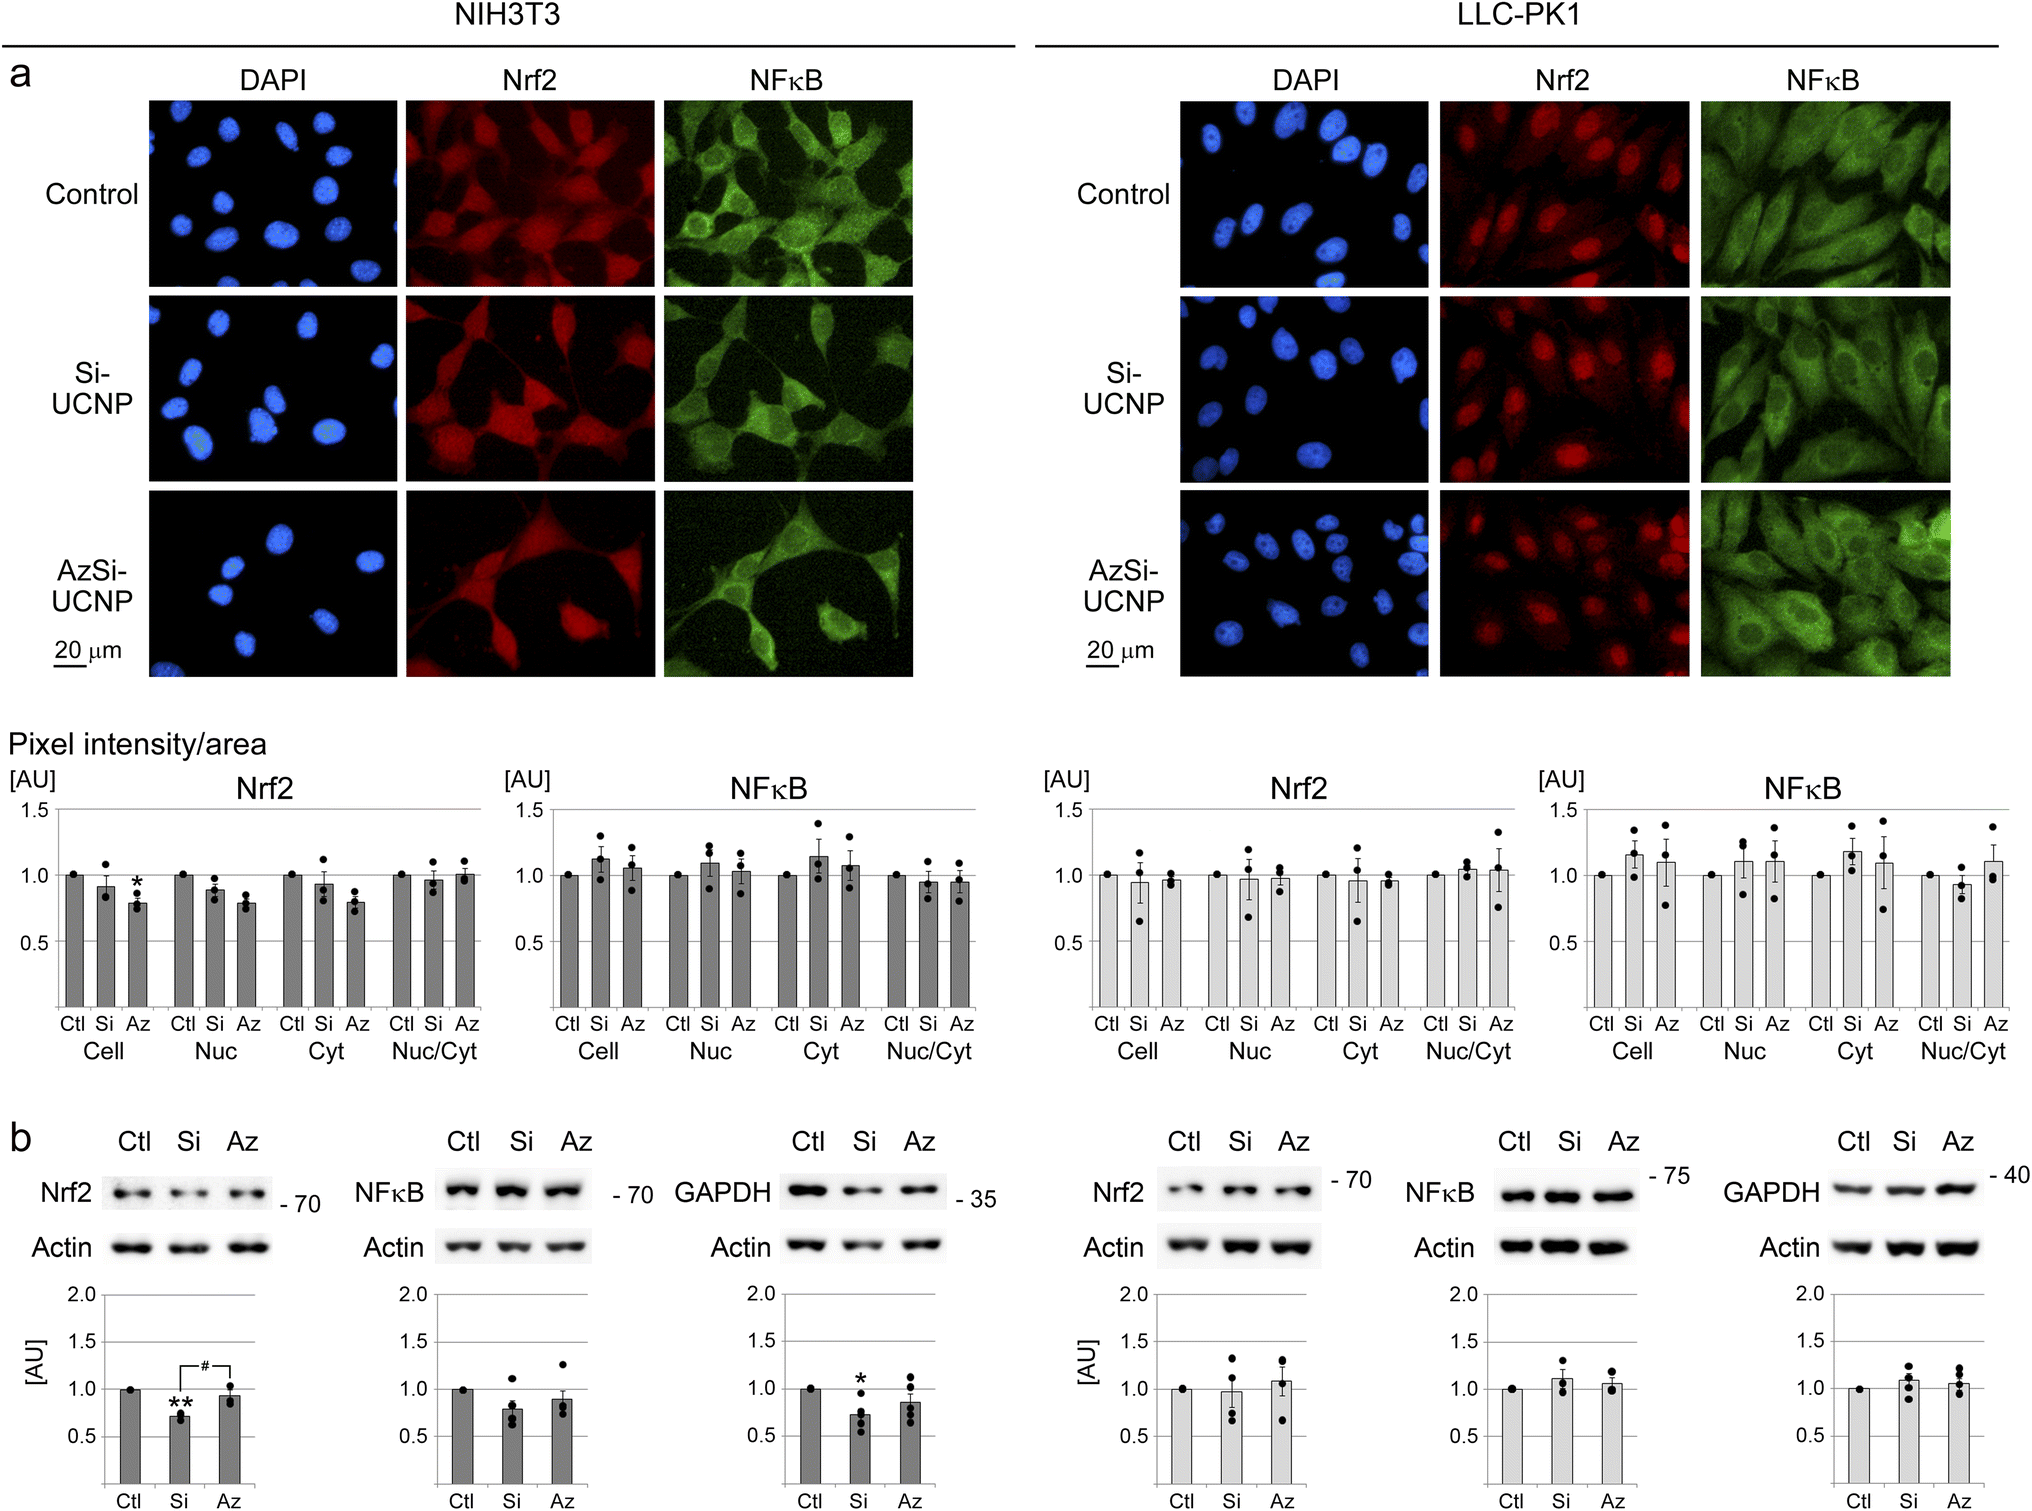 | ||
| Fig. 6 Impact of UCNPs on markers of oxidative stress and inflammation. Biomarker distribution and abundance were quantified for UCNP-treated cells as in Fig. 5. (a) Immunolocalization of Nrf2 and NFκB. Scale bar is 20 μm. (b) Western blot analyses for Nrf2, NFκB, and GAPDH. Graphs represent the ratio of the protein of interest/actin. (a and b) Statistical evaluation was conducted as described for Fig. 5; *, p < 0.05; **, p < 0.01. Significant differences between Si-UCNPs and AzSi-UNCPs are marked with #, p < 0.05. AU, arbitrary units. | ||
As reference for the responses triggered by UCNPs, we conducted control experiments with established stressors. As such, cells were exposed to heat, DTT or tunicamycin and the abundance of Nrf2 was quantified (Fig. S6†). Heat stress induces the production of heat shock proteins, especially members of the hsp70 family.80 DTT causes reductive stress, while tunicamycin interferes with protein glycosylation in the endoplasmic reticulum (ER). Both agents trigger an unfolded protein response (UPR) in the ER.81
Notably, several forms of stress elevated the levels of Nrf2 in fibroblasts and LLC-PK1 cells, and DTT induced the accumulation of NFκB in nuclei of renal proximal tubule cells (Fig. S7†). As well, tunicamycin significantly diminished GAPDH abundance in NIH3T3 cells; the tunicamycin-dependent loss exceeded the changes observed for Si-UCNPs (Fig. S6†). GAPDH levels in LLC-PK1 cells were not altered by the incubation with UCNPs or tunicamycin (Fig. 6 and S6†). These data highlight that cells of different origins vary in their responses to UCNPs.
Taken together, the results for key transcription factors and GAPDH support the idea that Si-UCNPs or AzSi-UCNPs elicited only minor stress or pro-inflammatory responses. By contrast, established stressors triggered marked changes in both fibroblasts and renal proximal tubule cells.
3.6 Evaluation of nucleolar stress in UCNP-treated cells
Nucleoli produce ribosomal subunits, serve as stress sensors, control apoptosis and cellular senescence. The transcription factor p53 is closely linked to nucleolar function and cellular senescence; p53 provides a stress marker that is stabilized when nucleolar functions derail.42,82Nucleolar activities are determined by the proper organization into nucleolar subcompartments.41 To examine this aspect of cellular homeostasis, we evaluated three biomarkers that report on the spatial organization of nucleoli, RPA194, nucleolin, and fibrillarin. RPA194 is a subunit of RNA polymerase I, which transcribes ribosomal RNA genes; nucleolin participates in rDNA transcription, rRNA maturation, and ribosome assembly; fibrillarin acts as rRNA 2′-O-methyltransferase.36,83
The subcellular localization of RPA194, nucleolin, and fibrillarin did not profoundly alter when cells were incubated with UCNPs (Fig. 7a). By contrast, other conditions, such as pharmacological agents, cause significant changes in the distribution of nucleolar proteins in NIH3T3 and LLC-PK1 cells.84,85
 | ||
| Fig. 7 Effect of UCNPs on nucleolar proteins and p53. Immunofluorescence, western blotting and statistical evaluation were conducted as described for Fig. 5. (a) Immunolocalization of RPA194, fibrillarin, and nucleolin. Scale bar is 20 μm. (b) Western blot analyses of p53, RPA194, fibrillarin, and nucleolin. Graphs show the ratio of the protein of interest/actin. Statistically significant differences are marked with *, p < 0.05; ***, p < 0.001. Significant differences between Si-UCNPs and AzSi-UNCPs are marked with #, p < 0.05. AU, arbitrary units. | ||
While UCNPs did not trigger a re-organization of nucleoli, they modified the abundance of nucleolin. Interestingly, UCNPs reduced nucleolin abundance in fibroblasts, but had the opposite effect in LLC-PK1 cells (Fig. 7b). By contrast, the levels of p53 did not significantly increase upon UCNP treatment. (The apparent molecular mass of “p53” detected in LLC-PK1 cells was >75kD. The same apparent molecular mass was observed for two different antibodies against p53, which were generated in different species). Collectively, our data support the hypothesis that UCNPs did not compromise the organization of nucleoli.
3.7 UCNPs modulate selected components of the stress and proteostasis network
Several signaling pathways and chaperones ensure that cells adjust to environmental and other insults, including the exposure to nanomaterials. Our earlier work demonstrated that certain NPs alter the abundance of the chaperone hsp70.46 Therefore, upregulation of heat shock proteins is a potential outcome of nano–bio interactions. Like heat shock proteins, the AAA+ ATPase valosin-containing protein (VCP) functions as a pillar of the proteostasis network. VCP dismantles protein aggregates and thereby maintains cell health under normal and stress conditions.86 Control experiments were conducted with DTT, tunicamycin or heat shock to compare the severity of changes elicited by UCNPs and established stressors (Fig. S6†).Consistent with a stress response, UCNPs stimulated the phosphorylation of eIF2α in fibroblasts (Fig. 8). Nevertheless, the changes were minor when compared to heat shock (Fig. S6†). UCNPs also increased the abundance of hsp70 in NIH3T3 cells, but to a lesser extent than heat stress.59 Notably, UCNPs had only marginal effects on the proteostasis network in renal proximal tubule cells. By contrast, conventional types of stress, such as tunicamycin, markedly increased the ER chaperones Grp78 and Grp94 (Fig. S6†). A striking difference between UCNPs and conventional forms of stress was also observed for the transcription factor CHOP (Fig. S6†). While CHOP levels were low in control and UCNP-treated samples, DTT markedly increased its abundance. As CHOP promotes apoptosis when ER stress is severe, the data confirm that cell viability was not compromised after 24 hours of UCNP incubation. Moreover, no significant changes were observed for the abundance of VCP. These results further emphasize the low toxicity of UCNPs detected by other assays (Fig. 3).
 | ||
| Fig. 8 UCNP-mediated changes to the proteostasis network. Key components of the proteostasis network were analyzed in NIH3T3 and LLC-PK1 cells. Western blotting and statistical evaluation were carried out as described for Fig. 5b. Except for p-/t-eIF2α, all graphs represent the ratio of the protein of interest/actin. Comparison with vehicle controls revealed significant differences for UCNP-treated samples; *, p < 0.05; ***, p < 0.001. Significant differences between Si-UCNPs and AzSi-UCNPs are marked with #, p < 0.05; ##, p < 0.01. AU, arbitrary units. The cartoon depicts essential elements of the proteostasis network. | ||
4. Conclusions
The current study was conducted to provide a better understanding of the biological effects elicited by Si-UCNPs and AzSi-UCNPs. These are mandatory steps to assess their safety in biological environments. To achieve this, we performed a rigorous evaluation of cell viability and a panel of stress biomarkers in fibroblasts and renal proximal tubule cells. Our insights are promising for the future development of UCNP-based applications. Neither Si-UCNPs nor AzSi-UCNPs caused immediate toxicity in cell types that are known targets of NPs. Under the experimental conditions examined, the overall impact of UCNPs on cellular homeostasis was mild (summarized in Table 3). These results are especially striking, as the azide surface modification of AzSi-UCNPs did not diminish cell viability after a 24 hour incubation period.| Protein abundance | ||||
|---|---|---|---|---|
| Protein | NIH3T3 cells | LLC-PK1 cells | ||
| Si-UCNPs | AzSi-UCNPs | Si-UCNPs | AzSi-UCNPs | |
| Lamin A | ↔ | ↓↓ | ↔ | ↔ |
| Lamin B | ↔ | ↓ | ↔ | ↓↓ |
| α-Tubulin | ↔ | ↔ | ↔ | ↑ |
| Nrf2 | ↓ | ↔ | ↔ | ↔ |
| NFκB | ↔ | ↔ | ↔ | ↔ |
| GAPDH | ↓ | ↔ | ↔ | ↔ |
| p53 | ↔ | ↔ | ↑ | ↔ |
| RPA194 | ↓ | ↔ | ↔ | ↔ |
| Fibrillarin | ↔ | ↔ | ↔ | ↔ |
| Nucleolin | ↓ | ↓ | ↑↑ | ↑ |
| p/t-eIF2α | ↑ | ↑↑ | ↔ | ↔ |
| Grp78 | ↔ | ↑ | ↔ | ↑ |
| Grp94 | ↑ | ↑ | ↔ | ↔ |
| CHOP | Not induced | Not induced | Not induced | Not induced |
| Hsp70 | ↑ | ↑↑ | ↔ | ↑ |
| Hsp90 | ↔ | ↔ | ↑↑ | ↑↑ |
| VCP | ↔ | ↔ | ↔ | ↔ |
Notably, we demonstrate that the response to UCNPs varies remarkably among non-malignant cells. Cell type-specific differences are the simplest explanation for these diverse responses. Such cell type-dependent reactions to nanomaterials are consistent with published observations.52–54 In our study, UCNPs elicited less pronounced changes to the proteostasis network in renal proximal tubule cells than in fibroblasts. The kidney is frequently exposed to stressful conditions, even in healthy organisms.87 This may limit the effects of exogenous stressors on kidney cells. Thus, the high abundance of molecular chaperones, such as Grp94,88 in renal proximal tubule cells may protect against UCNP-mediated stress in LLC-PK1 cells, but could require an upregulation in fibroblasts.
Our study generated additional support for the hypothesis that NPs cause cell type-specific changes in cell physiology. While we did not uncover a marked re-organization of the microtubule cytoskeleton, AzSi-UCNPs led to a significant increase in α-tubulin in renal proximal tubule cells, but not in fibroblasts. This outcome is consistent with the distinct NP-induced effects on the cytoskeleton of epithelial cells and fibroblasts.54
We also observed a striking difference for the UCNP-dependent changes in nucleolin levels. Nucleolin levels were reduced by UCNPs in fibroblasts, but increased in LLC-PK1 cells. Nucleolin is a multitasking protein that binds RNA, serves as histone chaperone, contributes to the processing of ribosomal RNA, and plays a role in chromatin remodeling.37 This nucleolar protein is highly abundant, both in human fibroblasts and renal proximal tubule cells.88 At present, it is unclear why UCNPs have opposite effects on nucleolin abundance in NIH3T3 and LLC-PK1 cells. Future experiments will have to address this topic.
Despite the differences described above, a partial loss of the nuclear envelope protein lamin B was a common denominator for the effects of Si-UCNPs and AzSi-UCNPs in fibroblasts and renal proximal tubule cells (Table 3). The molecular mechanisms underlying the diminished lamin B abundance are presently not known. B-type lamins are linked to DNA replication, DNA repair, chromatin organization, nuclear stiffness, and cellular senescence.89 Thus, lamin B should be included in future studies that investigate nano–bio interactions. Our results also emphasize the importance of testing cells of different origins to define the UCNP-dependent changes in cellular homeostasis that are directly pertinent to their biological applications.
Author contributions
Kais Bietar: conceptualization, methodology, formal analysis, investigation, writing – original draft and revisions; Siwei Chu: methodology, formal analysis, investigation, writing – original draft and revisions; Gabrielle Mandl: conceptualization, methodology, formal analysis, writing – original draft and revisions; Emma Zhang: formal analysis, investigation; Naim Chabaytah: formal analysis, investigation; Renata Sabelli: formal analysis, investigation; John A. Capobianco: conceptualization, writing – original draft and revisions, funding acquisition; Ursula Stochaj: conceptualization, methodology, formal analysis, investigation, writing – original draft and revisions, visualization, project administration, funding acquisition.Conflicts of interest
There are no conflicts to declare.Acknowledgements
We thank Dr Gregor Jansen (McGill University) for the generous gift of tunicamycin and Dr V. Blank (McGill University) for providing us with NIH3T3 cells. This study was supported by funds from Fonds de recherche du Québec – Nature et technologies (FRQNT) and Natural Sciences and Engineering Council of Canada (NSERC). JAC is a Concordia University Research Chair in Nanoscience and is grateful to Concordia University for financial support. KB, SC and GM were supported by fellowships from McGill University, Mitacs, Fonds de recherche du Québec – Santé (FRQS) or NSERC.References
- J. F.-C. Loo, Y.-H. Chien, F. Yin, S.-K. Kong, H.-P. Ho and K.-T. Yong, Coord. Chem. Rev., 2019, 400, 213042 CrossRef CAS.
- EUON, What kind of products contain nanomaterials, accessed, 2023, https://euon.echa.europa.eu/ Search PubMed.
- D. Xu, C. Li, W. Li, B. Lin and R. Lv, Front. Chem., 2023, 11, 1036715 CrossRef CAS PubMed.
- G. Tessitore, G. A. Mandl, M. G. Brik, W. Park and J. A. Capobianco, Nanoscale, 2019, 11, 12015–12029 RSC.
- A. Gnach, T. Lipinski, A. Bednarkiewicz, J. Rybka and J. A. Capobianco, Chem. Soc. Rev., 2015, 44, 1561–1584 RSC.
- G. Tessitore, G. A. Mandl, S. L. Maurizio, M. Kaur and J. A. Capobianco, RSC Adv., 2023, 13, 17787–17811 RSC.
- G. Jalani, V. Tam, F. Vetrone and M. Cerruti, J. Am. Chem. Soc., 2018, 140, 10923–10931 CrossRef CAS PubMed.
- B. Du, M. Yu and J. Zheng, Nat. Rev. Mater., 2018, 3, 358–374 CrossRef.
- A. Ruggiero, C. H. Villa, E. Bander, D. A. Rey, M. Bergkvist, C. A. Batt, K. Manova-Todorova, W. M. Deen, D. A. Scheinberg and M. R. McDevitt, Proc. Natl. Acad. Sci. U. S. A., 2010, 107, 12369–12374 CrossRef CAS PubMed.
- W. Wang, K. Gaus, R. D. Tilley and J. J. Gooding, Mater. Horiz., 2019, 6, 1538–1547 RSC.
- P. A. Rojas-Gutierrez, D. Bekah, J. Seuntjens, C. DeWolf and J. A. Capobianco, ACS Appl. Bio Mater., 2019, 2, 4527–4536 CrossRef CAS PubMed.
- E. Voronovic, A. Skripka, G. Jarockyte, M. Ger, D. Kuciauskas, A. Kaupinis, M. Valius, R. Rotomskis, F. Vetrone and V. Karabanovas, ACS Appl. Mater. Interfaces, 2021, 13, 39076–39087 CrossRef CAS PubMed.
- V. Mahalingam, F. Vetrone, R. Naccache, A. Speghini and J. A. Capobianco, Adv. Mater., 2009, 21, 4025–4028 CrossRef CAS.
- T. E. Littleford, R. A. Jackson and M. S. D. Read, Phys. Status Solidi C, 2013, 10, 156–159 CrossRef CAS.
- P. A. Rojas-Gutierrez, C. DeWolf and J. A. Capobianco, Part. Part. Syst. Charact., 2016, 33, 865–870 CrossRef CAS.
- H.-W. Chien, C.-H. Wu, C.-H. Yang and T.-L. Wang, J. Alloys Compd., 2019, 806, 272–282 CrossRef CAS.
- N. Sharma, K. Bietar and U. Stochaj, Biochim. Biophys. Acta, Rev. Cancer, 2022, 1877, 188703 CrossRef CAS PubMed.
- C. Hanske, M. N. Sanz-Ortiz and L. M. Liz-Marzán, Adv. Mater., 2018, 30, e1707003 CrossRef PubMed.
- E. Ureña-Horno, M. E. Kyriazi and A. G. Kanaras, Nanoscale Adv., 2021, 3, 3522–3529 RSC.
- M. V. Plikus, X. Wang, S. Sinha, E. Forte, S. M. Thompson, E. L. Herzog, R. R. Driskell, N. Rosenthal, J. Biernaskie and V. Horsley, Cell, 2021, 184, 3852–3872 CrossRef CAS PubMed.
- T. Kirk, A. Ahmed and E. Rognoni, Cells, 2021, 10, 2840 CrossRef CAS PubMed.
- A. F. Rodrigues, C. Rebelo, S. Simões, C. Paulo, S. Pinho, V. Francisco and L. Ferreira, Adv. Sci., 2023, 10, 2205475 CrossRef CAS PubMed.
- C. Liu, K. Wu, H. Gao, J. Li and X. Xu, Diabetes, Metab. Syndr. Obes.: Targets Ther., 2022, 15, 2653–2673 CrossRef CAS PubMed.
- N. Trac, A. Ashraf, J. Giblin, S. Prakash, S. Mitragotri and E. J. Chung, ACS Nano, 2023, 17, 6165–6177 CrossRef CAS PubMed.
- D. Fleischmann and A. Goepferich, Eur. J. Pharm. Biopharm., 2021, 166, 44–60 CrossRef CAS PubMed.
- M. Paramasivan, T. S. S. Kumar, H. Kanniyappan, V. Muthuvijayan and T. S. Chandra, Sci. Rep., 2023, 13, 4513 CrossRef CAS PubMed.
- G. Spiaggia, P. Taladriz-Blanco, S. Hengsberger, D. Septiadi, C. Geers, A. Lee, B. Rothen-Rutishauser and A. Petri-Fink, Biomedicines, 2023, 11, 30 CrossRef CAS PubMed.
- D. M. Samhadaneh, G. A. Mandl, Z. Han, M. Mahjoob, S. C. Weber, M. Tuznik, D. Rudko, J. A. Capobianco and U. Stochaj, ACS Appl. Bio Mater., 2020, 3, 4358–4369 CrossRef CAS PubMed.
- S. Matsuura, H. Katsumi, H. Suzuki, N. Hirai, H. Hayashi, K. Koshino, T. Higuchi, Y. Yagi, H. Kimura, T. Sakane and A. Yamamoto, Proc. Natl. Acad. Sci. U. S. A., 2018, 115, 10511–10516 CrossRef CAS PubMed.
- D. M. Samhadaneh, K. A. Alqarni, A. Smart, M. Kuang, O. Moujaber, D. Maysinger and U. Stochaj, Nanomed. Nanotechnol. Biol. Med., 2019, 22, 102083 CrossRef CAS PubMed.
- M. Costa-Mattioli and P. Walter, Science, 2020, 368, eaat5314 CrossRef CAS PubMed.
- B. J. Lang, M. E. Guerrero, T. L. Prince, Y. Okusha, C. Bonorino and S. K. Calderwood, Arch. Toxicol., 2021, 95, 1943–1970 CrossRef CAS PubMed.
- G. Caruso, E. M. Scalisi, R. Pecoraro, V. Cardaci, A. Privitera, E. Truglio, F. Capparucci, R. Jarosova, A. Salvaggio, F. Caraci and M. V. Brundo, Front. Vet. Sci., 2023, 10, 1148766 CrossRef PubMed.
- M. L. Schmitz, M. S. Shaban, B. V. Albert, A. Gökçen and M. Kracht, Biomedicines, 2018, 6, 58 CrossRef PubMed.
- J. Chen and L. A. Stark, Cells, 2018, 7, 157 CrossRef CAS PubMed.
- H. Su, M. Kodiha, S. Lee and U. Stochaj, PLoS One, 2013, 8, e80237 CrossRef CAS PubMed.
- P. Banski, M. Kodiha and U. Stochaj, Trends Biochem. Sci., 2010, 35, 361–367 CrossRef CAS PubMed.
- A. Corman, O. Sirozh, V. Lafarga and O. Fernandez-Capetillo, Trends Biochem. Sci., 2023, 48, 274–287 CrossRef CAS PubMed.
- S. Boulon, B. J. Westman, S. Hutten, F. M. Boisvert and A. I. Lamond, Mol. Cell, 2010, 40, 216–227 CrossRef CAS PubMed.
- D. Avitabile, B. Bailey, C. T. Cottage, B. Sundararaman, A. Joyo, M. McGregor, N. Gude, S. Truffa, A. Zarrabi, M. Konstandin, M. Khan, S. Mohsin, M. Völkers, H. Toko, M. Mason, Z. Cheng, S. Din, R. Alvarez, K. Fischer and M. A. Sussman, Proc. Natl. Acad. Sci. U. S. A., 2011, 108, 6145–6150 CrossRef CAS PubMed.
- K. Yang, J. Yang and J. Yi, Cell Stress, 2018, 2, 125–140 CrossRef PubMed.
- L. J. Hernández Borrero and W. S. El-Deiry, Biochim. Biophys. Acta, Rev. Cancer, 2021, 1876, 188556 CrossRef PubMed.
- A. Bermejo-Nogales, M. Fernández, M. L. Fernández-Cruz and J. M. Navas, Comp. Biochem. Physiol., Part C: Toxicol. Pharmacol., 2016, 190, 54–65 CAS.
- A. Scharf, K. H. Gührs and A. von Mikecz, Nanotoxicology, 2016, 10, 426–435 CrossRef CAS PubMed.
- M. Kodiha, H. Mahboubi, D. Maysinger and U. Stochaj, Nanobiomedicine, 2016, 3, 1 CrossRef PubMed.
- U. Stochaj, D. C. R. Burbano, D. R. Cooper, M. Kodiha and J. A. Capobianco, Nanoscale, 2018, 10, 14464–14471 RSC.
- J. Giroud, I. Bouriez, H. Paulus, A. Pourtier, F. Debacq-Chainiaux and O. Pluquet, Int. J. Mol. Sci., 2023, 24, 10788 CrossRef PubMed.
- O. Moujaber, F. Fishbein, N. Omran, Y. Liang, I. Colmegna, J. F. Presley and U. Stochaj, Cell. Mol. Life Sci., 2019, 76, 1169–1183 CrossRef CAS PubMed.
- S. Chu, O. Moujaber, S. Lemay and U. Stochaj, npj Aging, 2022, 8, 16 CrossRef CAS PubMed.
- G. A. Mandl, F. Vettier, G. Tessitore, S. L. Maurizio, K. Bietar, U. Stochaj and J. A. Capobianco, ACS Appl. Bio Mater., 2023, 6, 2370–2383 CrossRef CAS PubMed.
- M. Kodiha, Y. M. Wang, E. Hutter, D. Maysinger and U. Stochaj, Theranostics, 2015, 5, 357–370 CrossRef PubMed.
- A. B. Sengul and E. Asmatulu, Environ. Chem. Lett., 2020, 18, 1659–1683 CrossRef CAS.
- C. M. Beddoes, C. P. Case and W. H. Briscoe, Adv. Colloid Interface Sci., 2015, 218, 48–68 CrossRef CAS PubMed.
- O. Ispanixtlahuatl-Meráz, R. P. F. Schins and Y. I. Chirino, Environ. Sci.: Nano, 2018, 5, 228–245 RSC.
- I. A. Hatton, E. D. Galbraith, N. S. C. Merleau, T. P. Miettinen, B. M. Smith and J. A. Shander, Proc. Natl. Acad. Sci. U. S. A., 2023, 120, e2303077120 CrossRef CAS PubMed.
- S. L. Maurizio, G. Tessitore, G. A. Mandl and J. A. Capobianco, Nanoscale Adv., 2019, 1, 4492–4500 RSC.
- T. P. Hoar and J. H. Schulman, Nature, 1943, 152, 102–103 CrossRef CAS.
- O. Moujaber, H. Mahboubi, M. Kodiha, M. Bouttier, K. Bednarz, R. Bakshi, J. White, L. Larose, I. Colmegna and U. Stochaj, Biochim. Biophys. Acta, 2017, 1864, 475–480 CrossRef CAS PubMed.
- Š. Hardilová, M. Havrdová, A. Panáček, L. Kvítek and R. Zbořil, J. Phys.: Conf. Ser., 2015, 617, 012023 CrossRef.
- C. Liczner, G. A. Mandl, S. L. Maurizio, K. Duke, J. A. Capobianco and C. J. Wilds, Mater. Chem. Front., 2021, 5, 4690–4699 RSC.
- A. Sikora, D. Bartczak, D. Geißler, V. Kestens, G. Roebben, Y. Ramaye, Z. Varga, M. Palmai, A. G. Shard, H. Goenaga-Infante and C. Minelli, Anal. Methods, 2015, 7, 9835–9843 RSC.
- N. Al-Hajj, Y. Mousli, A. Miche, V. Humblot, J. Hunel, K. Heuzé, T. Buffeteau, E. Genin and L. Vellutini, Appl. Surf. Sci., 2020, 527, 146778 CrossRef CAS.
- M. Kumar, R. K. Jaiswal, P. K. Yadava and R. P. Singh, BioFactors, 2020, 46, 894–905 CrossRef CAS PubMed.
- M. J. Mitchell, M. M. Billingsley, R. M. Haley, M. E. Wechsler, N. A. Peppas and R. Langer, Nat. Rev. Drug Discovery, 2021, 20, 101–124 CrossRef CAS PubMed.
- F. Rouaud, S. Sluysmans, A. Flinois, J. Shah, E. Vasileva and S. Citi, Biochim. Biophys. Acta, Biomembr., 2020, 1862, 183399 CrossRef CAS PubMed.
- Y. Shi, R. Li, J. Yang and X. Li, Int. J. Physiol., Pathophysiol. Pharmacol., 2020, 12, 70–78 CAS.
- A. G. Howarth, M. R. Hughes and B. R. Stevenson, Am. J. Physiol., 1992, 262, C461–C469 CrossRef CAS PubMed.
- C. J. Gottardi, M. Arpin, A. S. Fanning and D. Louvard, Proc. Natl. Acad. Sci. U. S. A., 1996, 93, 10779–10784 CrossRef CAS PubMed.
- A. Haage and A. Dhasarathy, Front. Cell Dev. Biol., 2023, 11, 1163553 CrossRef PubMed.
- X. Wong, A. J. Melendez-Perez and K. L. Reddy, Cold Spring Harbor Perspect. Biol., 2022, 14, a040113 CrossRef CAS PubMed.
- J. Y. Shin and H. J. Worman, Annu. Rev. Pathol., 2022, 17, 159–180 CrossRef CAS PubMed.
- R. Núñez, S. M. Sancho-Martínez, J. M. L. Novoa and F. J. López-Hernández, Cell Death Differ., 2010, 17, 1665–1671 CrossRef PubMed.
- S. Elmore, Toxicol. Pathol., 2007, 35, 495–516 CrossRef CAS PubMed.
- M. Hammad, M. Raftari, R. Cesário, R. Salma, P. Godoy, S. N. Emami and S. Haghdoost, Antioxidants, 2023, 12, 1371 CrossRef CAS PubMed.
- K. Lingappan, Curr. Opin. Toxicol., 2018, 7, 81–86 CrossRef PubMed.
- V. G. Yerra, G. Negi, S. S. Sharma and A. Kumar, Redox Biol., 2013, 1, 394–397 CrossRef PubMed.
- T. Nguyen, P. Nioi and C. B. Pickett, J. Biol. Chem., 2009, 284, 13291–13295 CrossRef CAS PubMed.
- T. Hildebrandt, J. Knuesting, C. Berndt, B. Morgan and R. Scheibe, Biol. Chem., 2015, 396, 523–537 CAS.
- J. Y. Zhang, F. Zhang, C. Q. Hong, A. E. Giuliano, X. J. Cui, G. J. Zhou, G. J. Zhang and Y. K. Cui, Cancer Biol. Med., 2015, 12, 10–22 CAS.
- E. Papp, G. Nardai, C. Söti and P. Csermely, BioFactors, 2003, 17, 249–257 CrossRef CAS PubMed.
- D. C. da Silva, P. Valentão, P. B. Andrade and D. M. Pereira, Pharmacol. Res., 2020, 155, 104702 CrossRef PubMed.
- K. M. Hannan, P. Soo, M. S. Wong, J. K. Lee, N. Hein, P. Poh, K. D. Wysoke, T. D. Williams, C. Montellese, L. K. Smith, S. J. Al-Obaidi, L. Núñez-Villacís, M. Pavy, J. S. He, K. M. Parsons, K. E. Loring, T. Morrison, J. Diesch, G. Burgio, R. Ferreira, Z. P. Feng, C. M. Gould, P. B. Madhamshettiwar, J. Flygare, T. J. Gonda, K. J. Simpson, U. Kutay, R. B. Pearson, C. Engel, N. J. Watkins, R. D. Hannan and A. J. George, Cell Rep., 2022, 41, 111571 CrossRef CAS PubMed.
- M. Kodiha and U. Stochaj, in Proteins of the Nucleolus, Springer Netherlands, 2013, pp. 149–172, DOI:10.1007/978-94-007-5818-6_7.
- M. Kodiha, A. Salimi, Y. M. Wang and U. Stochaj, PLoS One, 2014, 9, e88087 CrossRef PubMed.
- B. Kar, B. Liu, Z. Zhou and Y. W. Lam, BMC Cell Biol., 2011, 12, 33 CrossRef CAS PubMed.
- S. Chu, X. Xie, C. Payan and U. Stochaj, Mol. Neurodegener., 2023, 18, 52 CrossRef CAS PubMed.
- S. C. Borkan and S. R. Gullans, Annu. Rev. Physiol., 2002, 64, 503–527 CrossRef CAS PubMed.
- C. P. Ponting, Dis. Models Mech., 2019, 12, dmm037622 CrossRef CAS PubMed.
- C. Evangelisti, I. Rusciano, S. Mongiorgi, G. Ramazzotti, G. Lattanzi, L. Manzoli, L. Cocco and S. Ratti, Cell. Mol. Life Sci., 2022, 79, 126 CrossRef CAS PubMed.
Footnote |
| † Electronic supplementary information (ESI) available. See DOI: https://doi.org/10.1039/d3ra08869c |
| This journal is © The Royal Society of Chemistry 2024 |