DOI:
10.1039/D3RA08702F
(Paper)
RSC Adv., 2024,
14, 5893-5906
Biosynthesis and characterization of Ocimum sanctum green silver nanoparticles and unravelling their enhanced anti-filarial activity through a HRAMS proteomics approach
Received
20th December 2023
, Accepted 4th February 2024
First published on 14th February 2024
Abstract
The available anti-filarial medications are largely ineffective against adult filarial worms. Also, these drugs have several drawbacks such as toxicity and development of resistance owing to long-term usage. Green nanomedicine may offer better solutions for Lymphatic Filariasis treatment due to its tiny size, biocompatibility, and better penetration at considerably lower costs with higher therapeutic efficacy. In the present study, Ocimum sanctum silver nanoparticles (OSAgNPs) were bio-synthesized and their anti-filarial efficacy was evaluated against adult filarial parasites. The green nanoparticles were characterized by UV-VIS spectroscopy, XRD, FTIR, SEM, and TEM analysis. The OSAgNPs significantly affected the motility and viability of adult Setaria cervi parasites after 4 h of incubation at concentrations higher than 0.5 μg ml−1. Proteomics analysis by high resolution accurate mass spectrometry revealed that 213 proteins were differentially expressed following OSAgNP treatment. Mostly these DEPs belonged to the many biochemical and molecular pathways of parasites such as muscle proteins, antioxidant proteins, heat shock proteins, signal recognition proteins, and energy metabolism-related proteins. Undoubtedly, this study will open new avenues for the development of novel anti-filarial drugs based on green nanoparticles.
1. Introduction
Lymphatic filariasis (LF) is a mosquito transmitted disease common in tropical and subtropical regions of the world. Around 882 million people in 44 countries are at risk of LF infection. People acquire LF infections usually in childhood and the symptoms like lymphodema, elephantiasis, and hydrocele start developing in later years.1 The World Health Organization launched a Global Program to Eliminate Lymphatic Filariasis (GPELF) in the year 2000 for the control and elimination of LF. Under this program, anti-filarial drugs ivermectin, diethylcarbamazine and albendazole (IDA) were administered to the populations residing in endemic countries. However, these drugs are only effective against the larval stages of filarial parasites and have almost no effect on adult parasites. Not only this, the drugs are commonly associated with several side effects, and complications in co-infections also their continuous use leads to drug resistance in the parasites.2 Therefore, there is an urgent requirement to develop new anti-filarial agents that have adulticidal activity and are effective in lower doses.
A significant subfield of nanoscience and nanotechnology is now bioinspired technology for nanoparticle (NP) production. In addition to their numerous uses in the synthesis of NPs, plant biomass is primarily targeted as a catalyst for chemical synthesis. According to recent studies, silver nanoparticles (AgNPs) have a variety of medical uses, including cancer diagnosis and treatment as well as anti-bacterial, anti-fungal, anti-diabetic, and anti-inflammatory properties.3 In terms of resource accessibility, security, reaction speed, and the viability of large-scale synthesis, using plant extracts to synthesize AgNPs is preferable. According to reports, the phytochemicals found in plant extracts can reduce metal ions to nanoparticles and eventually eliminate the need for harmful chemicals, high pressure, temperature, and energy.4 To create NPs of various sizes and shapes, a variety of plant materials, including leaf extracts, fruit, bark, fruit peels, roots, and calluses, have been investigated.5
The genus Ocimum has several medicinal properties such as anti-viral, anti-microbial, anti-fungal, anti-helminthic and is also used as a mosquito repellent.6 Some prior studies have shown the anthelminthic activities of Ocimum and its essential oils against different gastrointestinal nematodes.7,8 In a previous study, we investigated the anti-filarial activity of Ocimum sanctum (OS) and bioactive compounds against filarial parasites Setaria cervi under in vitro and ex vivo conditions.9 The findings from the study provided evidence for the multi-inhibitory potential of Ocimum sanctum against several filarial proteins/enzymes. The green synthesized silver nanoparticles of Ocimum sp. have been reported for their antibacterial and antimicrobial activities.10,11 However, no reports are available for the anti-parasitic or anti-filarial activity of green synthesized nanoparticles of Ocimum sanctum. Hence, the current work was undertaken to explore the anti-filarial activity of Ocimum sanctum silver nanoparticles (OSAgNPs). The study findings may offer fresh perspectives for developing environmentally responsible and long-lasting treatments for filarial infections as well as aid in addressing the issue of drug resistance in present therapies.
2. Experimental section
2.1. Preparation of Ocimum sanctum extract
Fresh healthy leaves of Ocimum sanctum Linn. (OS) were collected from the botanical gardens of Banaras Hindu University, U.P. India. The OS leaves were identified by a senior taxonomist Prof. Shashi Pandey, Department of Botany, Institute of Science, Banaras Hindu University. Leaves were first rinsed with distilled water to remove the dust and shade dried for a week on the tabletop.9 Fine powder of OS leaves was prepared with the help of a mixer grinder and stored at 4 °C for further use. The 5% aqueous leaf extract was prepared from a fine powder of OS leaves. 5 g of leaf powder was boiled in 100 ml sterile distilled water at 60 °C for 40 min. Further, the leaf extract was filtered using Whatman filter paper No. 1 and the light brown solution was stored at 4 °C for further use.12
2.2. Biosynthesis of Ocimum sanctum silver nanoparticles (OSAgNPs)
5 ml aqueous extract of OS was added to 100 ml of 2 mM AgNO3 solution. The mixture was left for stirring at 25 °C overnight. The color of the solution changed over from light brown to colloidal dark brown indicating the formation of silver nanoparticles. The OSAgNPs were separated by centrifugation at 12![[thin space (1/6-em)]](https://www.rsc.org/images/entities/char_2009.gif) 000 rpm for 30 min followed by three washings with Mili Q water. Then, the OSAgNPs were dried in a lyophilizer and stored at 4 °C for further studies.13
000 rpm for 30 min followed by three washings with Mili Q water. Then, the OSAgNPs were dried in a lyophilizer and stored at 4 °C for further studies.13
2.3. Characterization of OSAgNPs
2.3.1. UV-visible spectroscopy. OSAgNPs were inspected visually as the color changed in solution from light brown to dark colloidal brown i.e., an indication of OSAgNPs formation. Further, the absorption spectra of OSAgNPs solution were recorded from 300 to 700 nm over a period of 24 hours with a UV-Vis Spectrophotometer (Biotek synergy H1 microplate reader).
2.3.2. Fourier-transform infrared spectroscopy (FTIR). For chemical identification, Ocimum sanctum L. aqueous leaf extract and synthesized OSAgNPs were subjected to Fourier Transform Infrared Spectrophotometer (FTIR) (PerkinElmer Spectrum Version 10.4.3) by using the potassium bromide (KBr) pellet method. The Ocimum sanctum extract and OSAgNPs were first lyophilized, then 1 mg of either sample was mixed with 200 mg of potassium bromide powder and pulverized. The pulverized mixture was fixed in a pellet-forming die and a pressure of ∼8 tons was applied under a vacuum. Further, the characterization was done at a resolution of 4 cm−1 in the range of 4000–500 cm−1.
2.3.3. XRD and EDX studies. The XRD pattern of OSAgNPs was obtained at the central instrument facility, Department of Chemistry, BHU, Varanasi. The X-ray diffraction spectra were recorded in a D8 ECO ADVANCE (Bruker) with the range of 20° to 80° at 2θ angles for the identification of phase variety and grain size of synthesized OSAgNPs. The XRD analysis was done with CuKα radiation at a voltage of 40 kV and 15 mA with a scan rate of 0.083/s. Elemental identification of OSAgNPs was done by energy dispersive spectroscopy (EDAX, Zeiss Germany) at an accelerating voltage of 0–20 keV.
2.3.4. SEM and TEM imaging. The OSAgNPs samples for SEM imaging were mounted on an aluminum stub and sputter coated with colloidal gold and images were taken at 20 kV in a Scanning electron microscope Carl Zeiss EVO18 (Germany) at the Dept. of Geology, BHU, Varanasi, India.14 The fine powder of OSAgNPs was dispersed in Mili Q water by ultrasonication and coated on a carbon copper grid. Next, the HRTEM images were obtained in a high resolution transmission electron microscope, FEI-Tecnai G2 20 TWIN at the central instrument facility, IIT, BHU, Varanasi, India. An accelerating voltage of 200 kV was applied15 and the OSAgNPs were visualized with Resolve RT software. The images of nanoparticles were recorded at scale bar of 200 to 10 nm and the particle sizes were measured in Image J software.
2.4. Parasite collection and maintenance
Adult live female S. cervi worms were recovered from the peritoneal folds of Indian water buffaloes from local slaughterhouses. Worms were brought to the laboratory in commercially available Krebs's Ringer bicarbonate buffer (KRB) supplemented with streptomycin (100 μg ml−1), penicillin (100 I.U. per ml), glutamine (5 mM), and 0.5% glucose [KRB Maintenance Medium (KRBMM)]. Worms were washed with KRB and incubated in KRBMM at 37 °C in a CO2 incubator for an hour before subsequent treatments.9
2.5. Exposure of adult female S. cervi worms to OSAgNPs
Adult female S. cervi worms in equal numbers (n = 10) were incubated in 20 ml of KRB maintenance medium with different concentrations of OSAgNPs (0.1 μg ml−1, 0.5 μg ml−1, and 1 μg ml−1) for 4 h at 37 °C, 5% CO2 and 95% humidity in a CO2 incubator. S. cervi worms maintained in KRB maintenance media only served as the control group. After 4 h of incubation S. cervi worms were allowed to recover for 1 h in fresh KRB maintenance medium. Next, worms were thoroughly washed with PBS, homogenized, and stored at −20 °C for further use.16 The protein estimation was done by Bradford's method17 and Bovine Serum Albumin (BSA) was used as a standard.
2.6. Effect of OSAgNPs on parasite motility and viability
The motility of S. cervi parasites exposed to OSAgNPs was monitored by visual inspection at hourly intervals, by an investigator blinded to the experiment. The movement of worms was scored with either positive or negative signs (+/−).18 The recovery of filarial worms was checked at the end of the experiment by transferring the worms for 1 h into a fresh KRBMM (without OSAgNPs). The viability of control and treated S. cervi parasites was determined by MTT assay according to the method of Mosmann and Coffman.19 S. cervi worms were incubated in PBS medium containing 0.5 mg ml−1 MTT (3-(4,5-dimethylthiazol-2 yl)-2,5-diphenyl tetrazolium bromide) for 2 h at 37 °C in dark. The worms were then transferred into 200 μl dimethyl sulphoxide (DMSO) for solubilizing the formazan crystals. After 1 h of incubation, the OD of the solution was measured at 540 nm in a microplate reader (BioRad). All experiments were done in triplicates.
2.7. Estimation of total reactive oxygen species (ROS) production
Total ROS generation was performed on control and OSAgNPs treated S. cervi worms by the Nitro blue tetrazolium (NBT) method.20 Firstly, worms were incubated for 1 h in 2% NBT solution at room temperature followed by numerous washings with PBS followed by methanol. Then worms were incubated in 2 M KOH to disrupt the cell membrane and then in DMSO to dissolve the formazan crystals and finally the absorbance was recorded at 620 nm.
2.8. High resolution accurate mass spectrometry (HRAMS) analysis
2.8.1. Sample preparation. 100 μg of protein sample was precipitated in ice-chilled acetone and incubated at −20 °C for overnight. Next, the precipitated protein sample was centrifuged at 10000 rpm for 10 min at 4 °C. The pellet was dissolved in freshly prepared buffer (40 mM Tris–HCl, pH-7.5, 7 M Urea, 2 M Thiourea, 15 mM DTT) at room temperature, and the dissolved sample was digested with trypsin (Sequencing grade, Promega) at 37 °C for overnight. The extracted peptides were lyophilized and desalted using C18 cartridges. Finally, the peptides were stored at −80 °C for further proteomics analysis.21
2.8.2. HRAMS analysis. The sample was subjected to proteomic analysis using high-resolution accurate mass spectrometer facility at Central Discovery Centre, Banaras Hindu University. An Orbitrap Eclipse Tribrid Mass Spectrometer with nano LC and UHPLC was used for peptide analysis. The samples were analyzed using a 120 min linear gradient of buffer B (80% Acetonitrile and 0.1% Formic acid) at a flow rate of 0.300 μl min−1. Full MS scans were done in the range of 200–1600 m/z and Thermo Scientific™ Proteome Discoverer™ software was used for peptide identification. For LC-MS/MS analysis control and OSAgNPs treated S. cervi protein samples were run in triplicates. The ratio of the mean relative quantitative values for each protein in subsequent samples was used to compute the abundance ratio. The significance of the variation between the samples from the comparison group and the samples from the control group was assessed using T-tests. The significance index was calculated using the related P value, with P < 0.05 being used as the default.
2.9. Gene ontology (GO) annotation and protein–protein interaction (PPI) network analysis
The Gene Ontology (GO) annotation proteome analysis in the UniProt database (https://www.uniprot.org/) was done. The accession no. of the respective proteins were searched, in the UniProt database and, the corresponding UniProt IDs were retrieved. Major proteins were characterized into groups by GO annotation, based on molecular function (MF), cellular components (CC), and biological processes (BP). For the classification and visualization of MF, CC, and BP of proteins, histograms were prepared. Further PPI networks for all the differentially expressed proteins using STRING database version 11.5 were constructed.22
2.10. Statistical analysis
All in vitro experiments were performed in triplicates and repeated thrice. The data are expressed as mean ± SD which was calculated using Graph Pad Prism 8.1 software. The statistical significance between control and OSAgNPs treated S. cervi worms was calculated with Student's t-test. *P < 0.05 were considered as significant in comparison to control (*P < 0.05, **P < 0.01, ***P < 0.001 and ****P < 0.0001).
3. Results and discussion
3.1. Physiochemical characterization of OSAgNPs
The physicochemical characteristics of biosynthesized OSAgNPs were evaluated by using techniques like UV-visible spectroscopy, XRD, FTIR, SEM, and TEM.
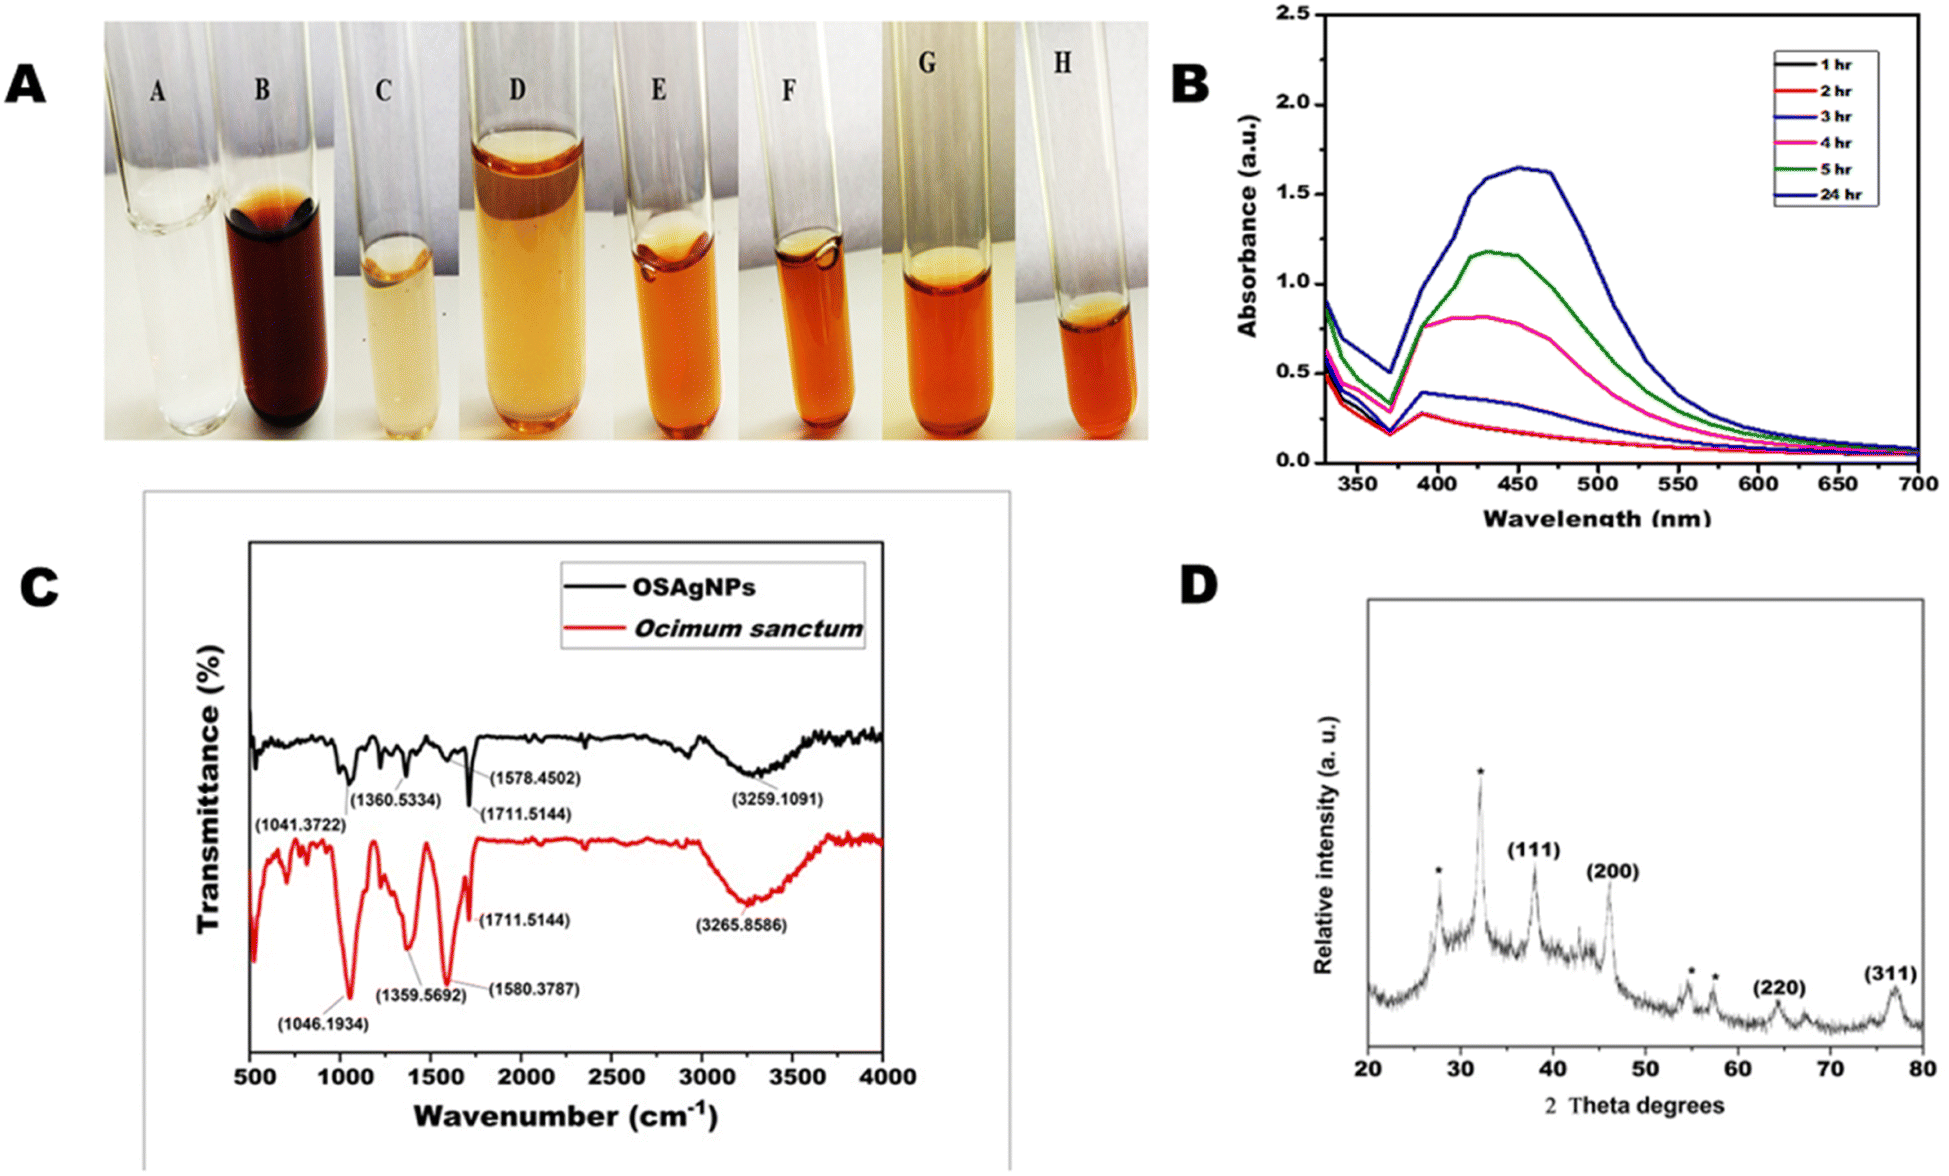
3.1.1. Ultraviolet-visible spectroscopy. The reduction of silver ions into nanoparticles with plant extract can be easily monitored by visual inspection of color change due to the surface plasmon resonance (SPR). The color of the OSAgNPs solution changed from light brown or pale yellow to dark colloidal brown within 30 minutes due to the surface plasmon resonance phenomenon. The color change is an indication of the reduction of silver ions into silver particles (Fig. 1A). The formation of silver nanoparticles was further confirmed by UV-VIS spectra recorded as a function of time for 24 h in the range of 300–700 nm. The absorbance maxima of OSAgNPs was observed at 430 nm (Fig. 1B). It was seen that the intensity of the brown color increased with time because of the continuous formation of OSAgNPs in the solution. The excitation of longitudinal plasmon vibrations of silver nanoparticles in the solution phase led to the characteristic absorbance maxima of 430 nm observed in the Ocimum sanctum silver nanoparticles (OSAgNPs) solution. The observed absorbance maxima was consistent with previous researches on biogenic silver nanoparticles.13,23 Also, the SPR bands were constant at 430 nm for 24 h indicating the absence of aggregation of nanoparticles.
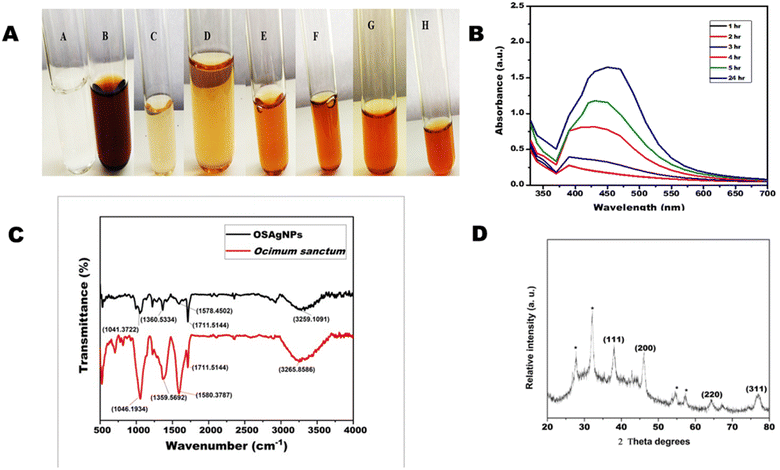 |
| | Fig. 1 (A) Change in the color of AgNO3 solution with time after mixing with Ocimum sanctum extract. (A) AgNO3 solution; (B) Ocimum extract; (C) mixture of AgNO3 solution and Ocimum sanctum extract at 0 h; (D) after 1 h (E) after 2 h (F) after 3 h (G) after 5 h; (H) after 24 h. (B) The UV-visible absorption spectrum of silver nanoparticle solution produced from aqueous extract of Ocimum sanctum after different time intervals. (C) Fourier-transform infrared absorptive spectra of Ocimum sanctum extract (red) and biosynthesized silver nanoparticles (OSAgNPs) (Black). (D) X-ray diffraction (XRD) pattern of green synthesized silver nanoparticles of Ocimum sanctum (OSAgNPs). | |
3.1.2. Fourier transform infrared spectroscopy. FTIR analysis was performed to study the possible interactions between the functional groups of biomolecules present in Ocimum sanctum leaf extract and silver ions. For FTIR measurements different methods can be employed such as KBr pellet method, Nujol method and diffuse reflection method. In the Nujol method liquid paraffin is used, however to confirm sample absorbance in regions overlapping with liquid paraffin sample, measurements should be repeated with another solvent hexachlorobutadiene. Similarly in the diffuse reflection method some low absorbance bands are also emphasized more than the transmission spectrum, hence we opted for the KBr pellet method. The band values 3285, 2923, 2356, 1710, 1589, 1361, 1212, 1049 cm−1 and 3257, 2895, 2348, 1709, 1580, 1368, 1212, 1051 cm−1 were obtained for OSAgNPs and OS leaf extract, respectively (Fig. 1C). The FTIR spectra of OSAgNPs and Ocimum sanctum leaf extract had several overlapping peaks in the range of 2348 cm−1 to 1049 cm−1, confirming the presence of OS extract in the OSAgNPs. The peaks at 3248 cm−1 and 1368 cm−1 correspond to O–H stretching whereas the 2348 cm−1 peak corresponds to O![[double bond, length as m-dash]](https://www.rsc.org/images/entities/char_e001.gif) CO stretching. The FTIR peaks at 170 cm−1 and 1051 cm−1 correspond to CO stretching and the major peak at 1580 cm−1 denotes the N–N bending of amines. The peak at 700 cm−1 in OS leave extract was absent in OSAgNPs indicating that amine components were oxidized in the process of silver ion reduction. The peak at 3257 cm−1 of OS leaf extract shifted to 3285 cm−1 in OSAgNPs FTIR spectra and was less intense as the amine groups of proteins may be functioning as reductants for silver ions in nanoparticles. These findings are similar to other earlier studies on biogenic silver nanoparticles synthesized from C. annum and A. paniculata respectively.13,23
CO stretching. The FTIR peaks at 170 cm−1 and 1051 cm−1 correspond to CO stretching and the major peak at 1580 cm−1 denotes the N–N bending of amines. The peak at 700 cm−1 in OS leave extract was absent in OSAgNPs indicating that amine components were oxidized in the process of silver ion reduction. The peak at 3257 cm−1 of OS leaf extract shifted to 3285 cm−1 in OSAgNPs FTIR spectra and was less intense as the amine groups of proteins may be functioning as reductants for silver ions in nanoparticles. These findings are similar to other earlier studies on biogenic silver nanoparticles synthesized from C. annum and A. paniculata respectively.13,23
3.1.3. X-ray diffraction. The XRD technique can determine the chemical composition and crystalline structure of nanoparticles. Fig. 1D shows the XRD pattern of green OSAgNPs and the diffraction peaks were obtained at 38°, 45°, 64°, and 77° which represent (111), (200), (220), and (311), respectively. The peaks correlate with the standard miller indices values for powdered diffraction of silver of the Joint Committee on Powered Diffraction Standards (JCPDS) (File No. 04-0783).24 The broad peaks at 38°, 45°, 64°, and 77° corresponded to face centered cubic lattice arrangement and crystalline structure of silver nanoparticles.15 In conjunction, some unassigned peaks were also observed in the XRD spectra which could be due to the formation of a bio-organic phase on the top surface of the nanoparticles.25 For determining the size of nanoparticles, the Debye–Scherrer's equation interrelating the average crystalline domain size (D) perpendicular to the reflecting planes, λ the X-ray wavelength, and β the FWHM of diffraction peak and θ which is the diffraction angle as
| D = 0.9λ/βcosθ |
was used. The size of the OSAgNPs was calculated from the full width at half maximum (FWHM) of the peak in radians (111) and was found to be ∼16.98 nm.
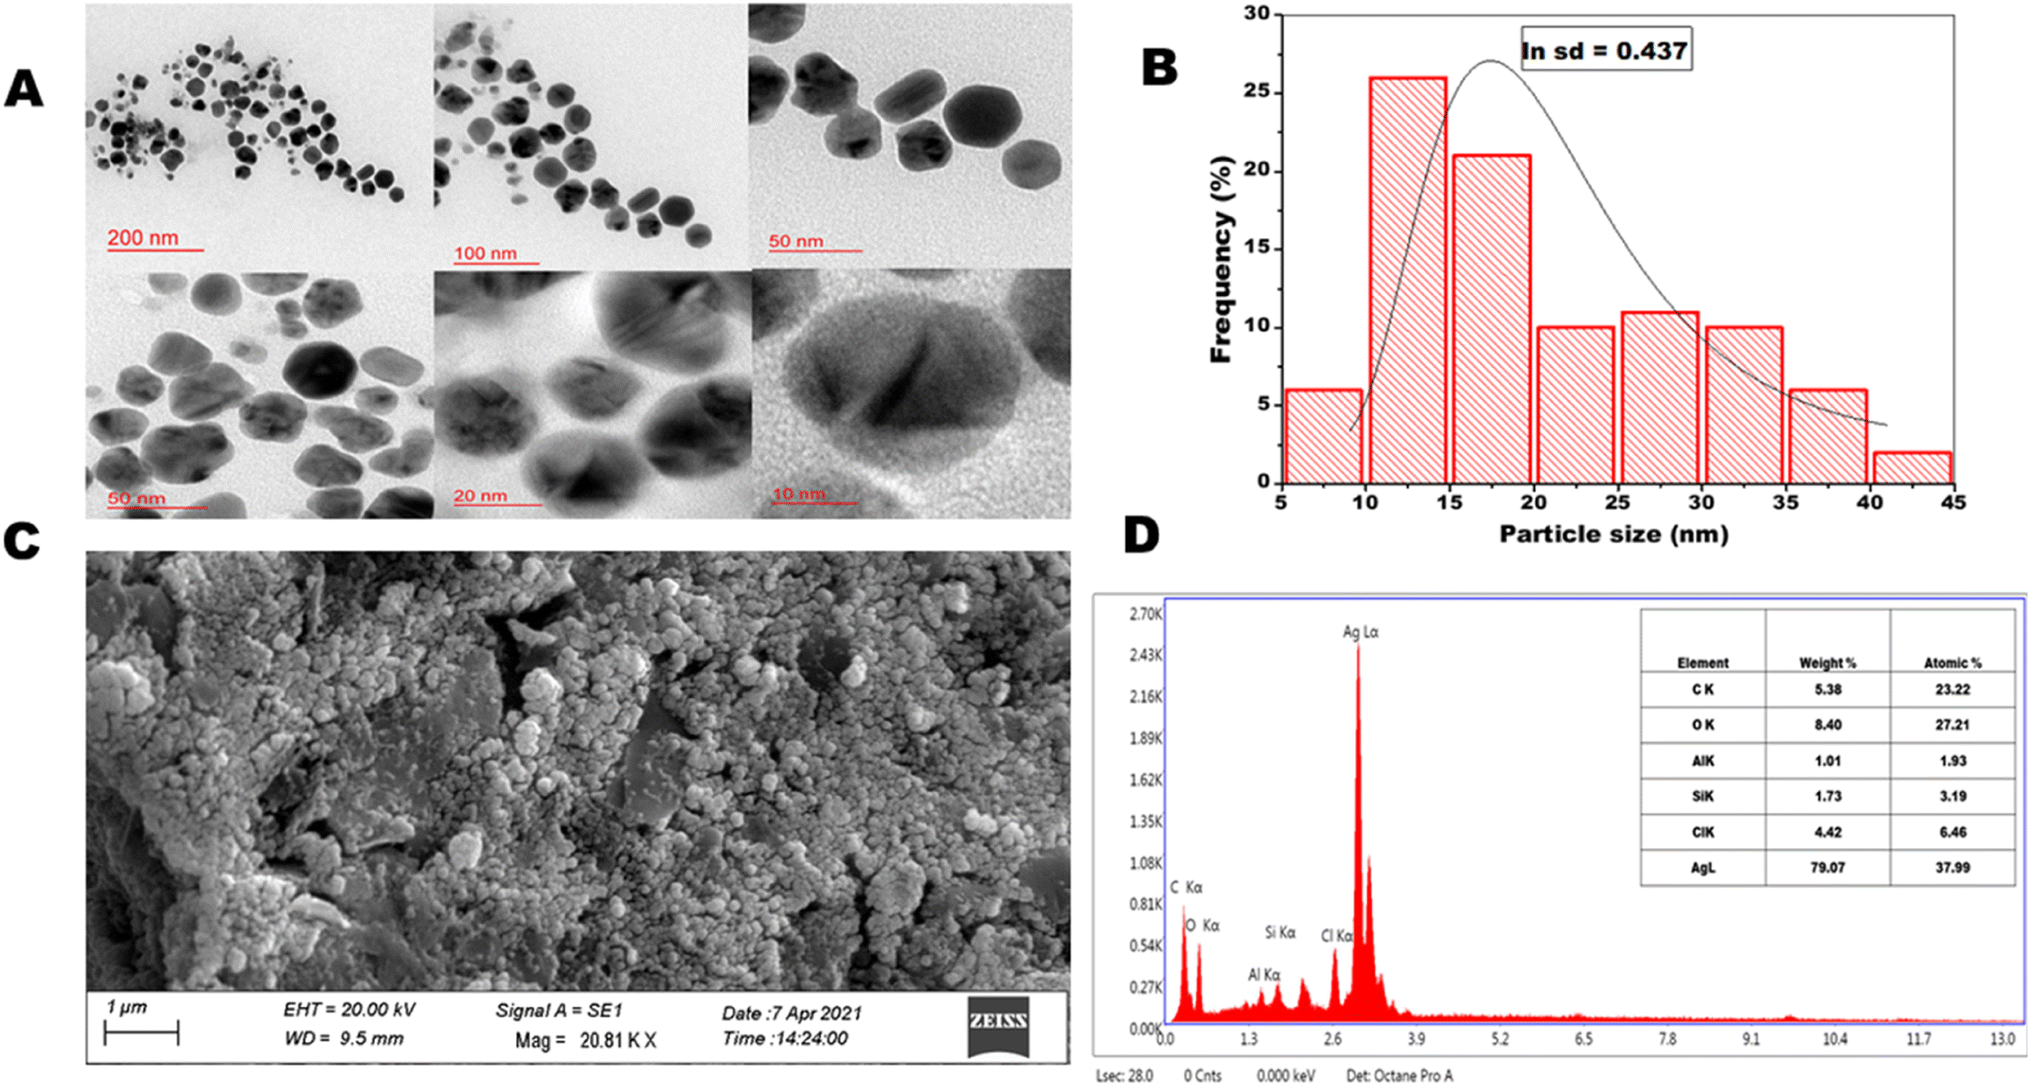
3.1.4. High resolution transmission electron microscopy and scanning electron microscopy. The high resolution transmission electron microscopic images of OSAgNPs are presented in Fig. 2A. The HRTEM analyses showed the particle size to be between 5 to 45 nm (Fig. 2B) which was estimated by constructing a histogram to deduce the mean particle size. The HRTEM images clearly showed prepared OSAgNPs were nearly spherical but varied in size and the mean particle size of OSAgNPs was 17 nm at pH 7.0., which is very close to the size of the OSAgNPs as estimated with the XRD analysis. It was also observed that the edges of the particles were lighter than the centers, indicating that biomolecules from Ocimum sanctum extract would be involved in capping the silver nanoparticles. The surface morphology of synthesized OSAgNPs was checked by scanning electron microscope imaging using a Zeiss SEM system (Fig. 2C). The shape of the nanoparticles can vastly affect their electronic and optical properties and the SEM images clearly showed that the synthesized OSAgNPs were uniform, and smooth in surface morphology.
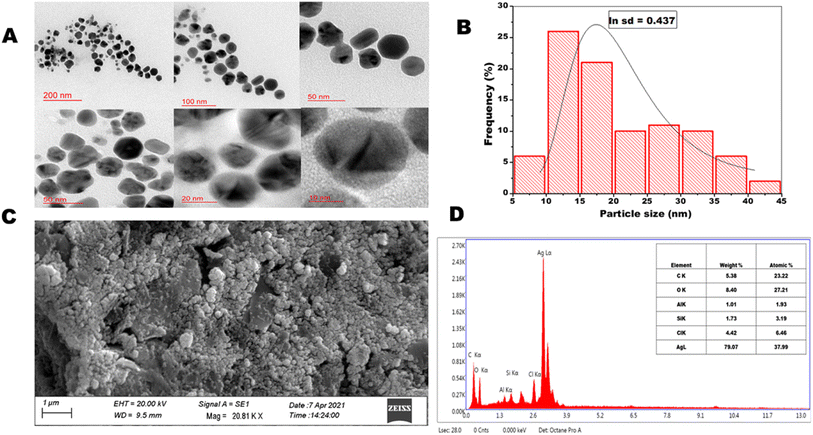 |
| | Fig. 2 (A) HRTEM images at scale bar 200, 100, 50, 20, and 10 nm, spherical silver nanoparticles of OSAgNPs. (B) Size distribution histogram of OSAgNPs. (C) SEM image of green synthesized OSAgNPs. (D) Energy dispersive X-ray spectrum and chemical composition of OSAgNPs. | |
3.1.5. Energy-dispersive X-ray analysis. The energy dispersive X-ray (EDAX) analysis of OSAgNPs was performed at an accelerating voltage of 20 kV and take-off angle of 74.9°. EDAX results showed a strong signal in the Ag (silver) region and weak signals in the O, C, and Cl regions (Fig. 2D). The quantitative results of EDAX spectra of OSAgNPs confirmed silver (Ag) as the major constituent element (79.07.12%) of the green synthesized OSAgNPs. The other elements present in OSAgNPs were carbon (5.38%), oxygen (8.40%), and chlorine (4.42%). The minor components carbon and oxygen are the main constituents of the OS leaf extract. The capping effect of organic compounds found in the plant extracts often leads to an increase in the stability of the nanoparticles.26
3.2. Effect of OSAgNPs on the motility and viability of S. cervi
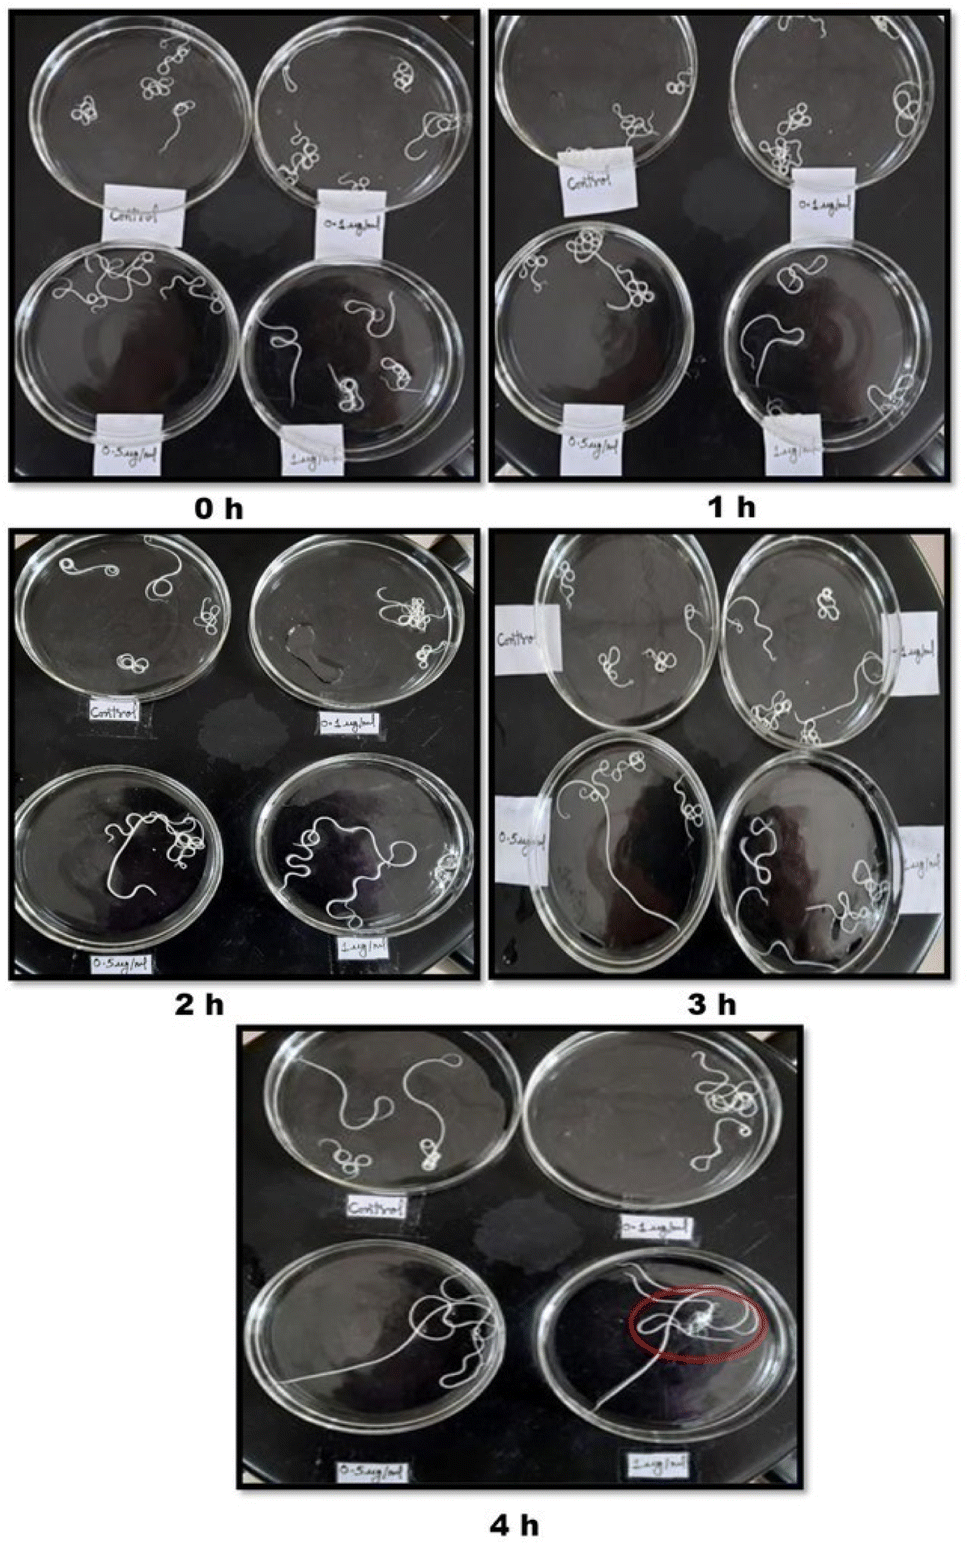
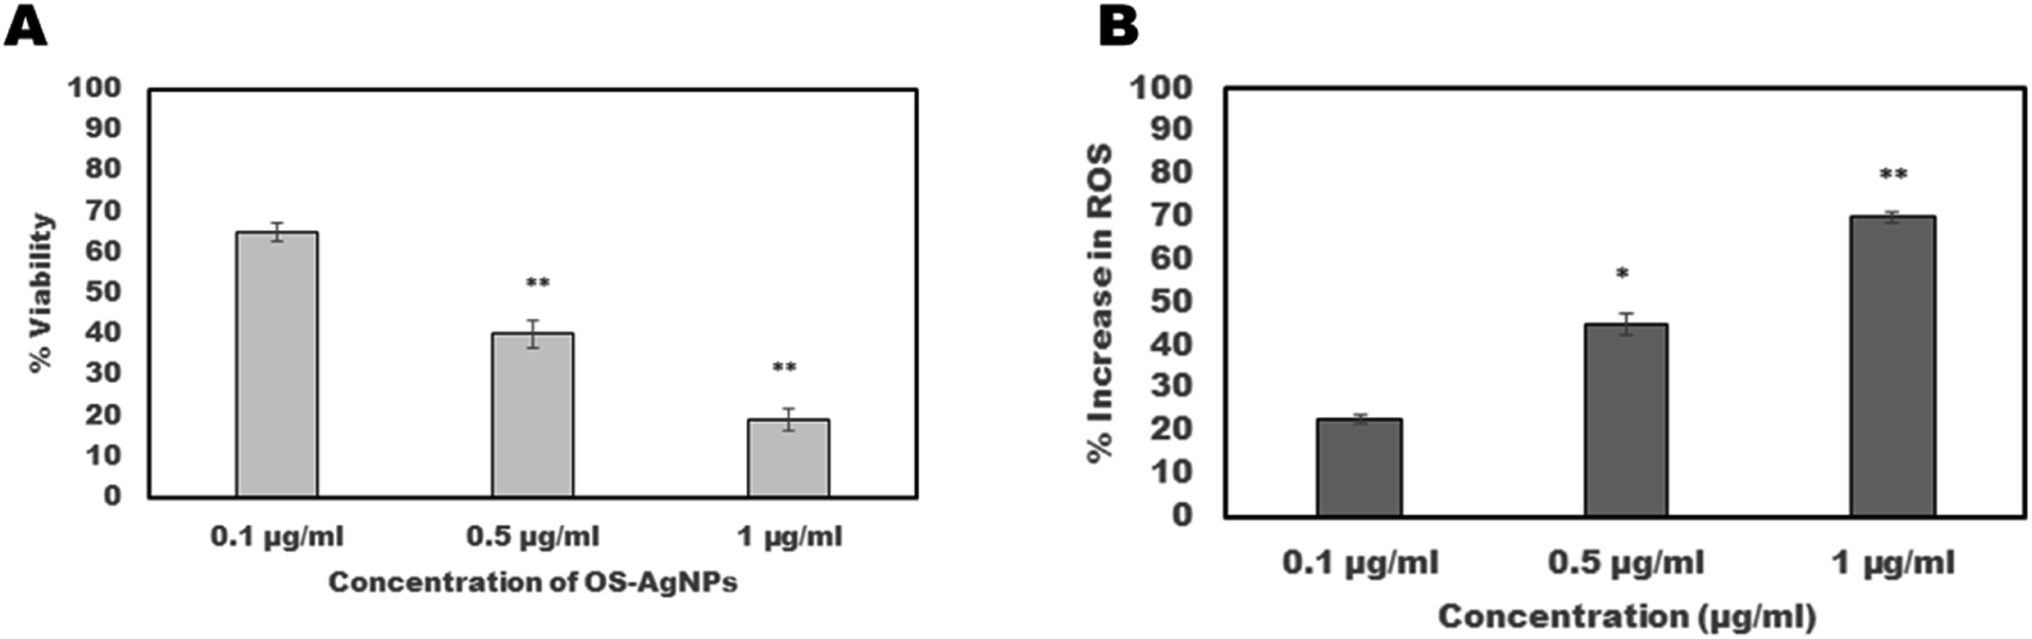
The motility of S. cervi exposed to OSAgNPs reduced in a time and concentration-dependent manner (Fig. 3). The exposure of S. cervi to OSAgNPs at 1 μg ml−1 concentration resulted in the death of parasites after 3 h of incubation which was confirmed by transferring them to a flask of fresh KRB maintenance medium. These parasites did not show any sign of recovery even after incubation for an hour in the maintenance medium (Table 1). On the other hand, AgNO3 solution was much less effective in reducing the motility of S. cervi at 1 μg ml−1 concentration, the parasites easily recovered and became motile after they were transferred to fresh KRBMM.13 The viability of adult female S. cervi after treatment with OSAgNPs was estimated by MTT assay. A positive correlation between viability and motility was observed in OSAgNPs treated female S. cervi worms. The viability after exposure to 0.1 μg ml−1, 0.5 μg ml−1 and 1 μg ml−1 nanoparticles was reduced to 65%, 40% (P value ≤ 0.001) and 19% (P value ≤ 0.001), after 4 h of incubation, when compared with the control parasites (100% viability) (Fig. 4A). The LC50 value of OSAgNPs treatment was observed at a concentration of 0.36 μg ml−1. In earlier studies, the LC50 value of Andrographis paniculata silver nanoparticles and Acacia auriculiformis silver nanoparticles were reported to be 11.6 μg ml−1 and 5.61 μg ml−1, respectively.13,27 The LC50 value of OSAgNPs is much lower in comparison to other plant based silver nanoparticles. Previously, the effect of Ocimum sanctum leaf extract was also tested on the motility of S. cervi parasites.9 The OS leaf extract at the concentration of 250 μg ml−1 and above could significantly inhibit S. cervi motility after 5 h of incubation, while, OSAgNPs treated adult parasites failed to revive after 4 h of incubation. The LC50 value of OS leaf extract was 197.24 μg ml−1 which reveals that the anti-filarial efficacy of OSAgNPs has increased by 547.88 folds. The motility and viability studies noticeably demonstrated that OSAgNPs are potent anti-filarial adulticidals even at very low concentrations.
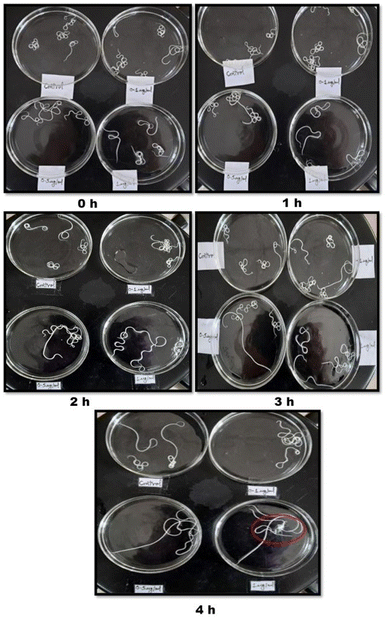 |
| | Fig. 3 Adult worms (n = 10) of equal size were exposed at 0.1 μg ml−1, 0.5 μg ml−1 and 1 μg ml−1 of OSAgNPs in 20 ml of KRBMM at 37 °C. Images of control and OSAgNPs treated female S. cervi worms, after 0, 1, 2, 3 and 4 h of treatment. | |
Table 1 Effect of OSAgNPs on the motility of adult female Setaria cervi at different time intervals
| Experimental sample (concentration) |
Motility of adult S. cervi at different time intervals |
Recoverya |
| 0 h |
1 h |
2 h |
3 h |
4 h |
| Motility was checked by visual observation at different time intervals. Adult female S. cervi (N = 5) of equal size were treated with different concentrations of OSAgNPs. Incubation was done for 4 h in a 20 ml maintenance medium. Motility scored was denoted as ‘−’ no movement; ‘+’ least active; ‘++’ less active; ‘+++’, moderate active; ‘+++++’ highly active. Worms of each flask were transferred into a fresh medium free of OSAgNPs and compared with the control group to observe recovery. |
| Control |
+++++ |
+++++ |
+++++ |
+++++ |
++++ |
+++++ |
| OSAgNPs (0.1 μg ml−1) |
+++++ |
+++++ |
+++++ |
+++++ |
++++ |
+++++ |
| OSAgNPs (0.5 μg ml−1) |
+++++ |
+++++ |
++++ |
++ |
+ |
++ |
| OSAgNPs (1 μg ml−1) |
+++++ |
++++ |
++ |
− |
− |
− |
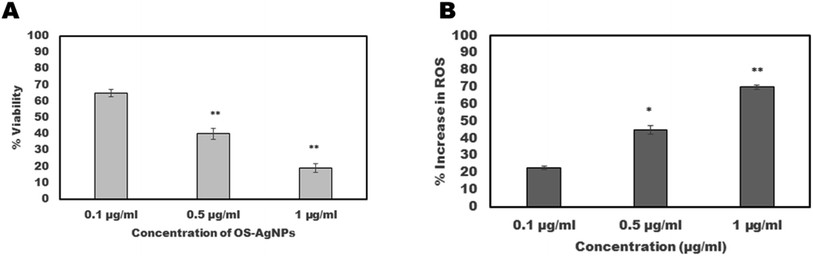 |
| | Fig. 4 Adult worms of equal size were exposed at 0.1 μg ml−1, 0.5 μg ml−1 and 1 μg ml−1 of OSAgNPs in 20 ml of KRB maintenance medium at 37 °C. (A) The viability of parasites was determined by MTT assay after 4 h of incubation, percent reduction in viability was calculated with respect to the control group of S. cervi worms. (B) Total reactive oxygen species production assessed in percentage after exposure of adult female S. cervi worms to OSAgNPs. The data expressed are mean ± SD of three independent experiments. **P ≤ 0.001, *P ≤ 0.05. Values with P ≤ 0.05 were considered significant. | |
3.3. Effect of OSAgNPs on reactive oxygen species production in S. cervi
A colorimetric assay employing nitro-blue tetrazolium (NBT) substrate was used for estimating reactive oxygen species production following exposure of parasites to OSAgNPs. The increase in ROS production by female S. cervi was directly proportional to the concentration of OSAgNPs (Fig. 4B). The increase in reactive oxygen species was significantly higher in parasites treated with 0.5 μg ml−1 (P value ≤ 0.05) and 1 μg ml−1 (P value ≤ 0.001) of OSAgNPs. The generation of reactive oxygen species (ROS) due to cellular metabolic activities is a regular phenomenon in S. cervi parasites. However, an increase in ROS levels, can cause oxidative stress which may lead to apoptosis and ultimately culminate in death. It was observed that the exposure of filarial parasites to much lower concentrations of OSAgNPs resulted in significantly higher ROS production, in comparison to other biogenic silver nanoparticles.13
3.4. Effect of OSAgNPs on the S. cervi proteome by high resolution accurate mass spectrometry
The application of proteomic profiling analysis through HRAMS was applied to investigate differentially expressed proteins in OSAgNPs treated filarial parasites The proteome profiling, data was analyzed through Thermo Scientific™ Proteome Discoverer™ software and the comparison of control worms with OSAgNPs treated S. cervi was done. The alteration in the protein expression was analyzed based on the abundance ratio. An abundance ratio value of ≤0.67 was set for downregulated proteins and for upregulated proteins the cut-off value was set to ≥1.5. It was found that 213 proteins were differentially expressed (DEPs) after exposure of filarial parasites to OSAgNPs (Tables 2 and 3), out of which 144 proteins were significantly downregulated whereas 69 were significantly upregulated. Heat shock proteins HSP-70, small heat shock protein, p27 and signaling proteins such as Signal Recognition protein (SRP)-14, SRP-54, and SRP- receptor were highly downregulated after the treatment. The energy metabolism proteins/enzymes such as Guanylate kinase which catalyzes ATP-dependent phosphorylation of GMP into GDP, mannose-6 phosphate isomerase catalyzing conversion of mannose-6 phosphate to fructose-6 phosphate and, NADH-ubiquinone oxidoreductase 24 kDa subunit (complex-I) of electron transport chain were also found to be downregulated. The crucial enzymes Guanylate kinase and Adenylate kinase, play a role in salvaging nucleotides GMP and AMP, were significantly downregulated thus showing the profound effect of OSAgNPs on nucleotide phosphorylation and energy metabolism. The signal recognition particle (SRP) 14 kDa, SRP-54 kDa, and SRP receptor α subunit were downregulated to an abundance ratio of 0.01 which shows that the targeting of secretory proteins becomes highly compromised after treatment with OSAgNPs. The heat shock protein 70, a stress-responsive molecular chaperone, protects the cell and is implicated as a dominant antigen in parasitic helminths such as Schistosoma mansoni, Onchocerca volvulus, Brugia malayi and Wuchereria bancrofti28 was also under-expressed in OSAgNPs treated parasites. The highly antigenic filarial protein BMA-RAL which has been tested as a lymphatic filarial vaccine candidate was significantly downregulated too.29 Moreover, cAMP-dependent protein kinase, an essential enzyme that controls multiple cellular processes by regulating the rate of phosphorylation of serine–threonine in the target proteins was much reduced too. These findings establish that the signal transduction cascades in the filarial worms are severely affected after OSAgNPs treatment.
Table 2 List of upregulated proteins in control vs. OSAgNPs treated group
| Accession |
Description |
Abundance ratio: (treated)/(control) |
Abundance ratio P-value: (treated)/(control) |
Score sequest HT |
| A0A4E9FJB5 |
Myosin heavy chain B (MHC B), putative |
2.876 |
2.58089 × 10⁻⁷ |
428.86 |
| A0A4E9EPZ8 |
Troponin family protein |
2.067 |
0.000279915 |
162.66 |
| A0A3P7GKE0 |
Protein-serine/threonine phosphatase |
2.464 |
8.99351 × 10⁻⁶ |
4.08 |
| J9EZR8 |
T-complex protein 1 subunit gamma |
2.962 |
1.24132 × 10⁻⁷ |
174.99 |
| J9FCK5 |
Peptide-methionine (S)-S-oxide reductase |
3.486 |
1.5685 × 10⁻⁹ |
28.57 |
| A0A0H5SFI5 |
Cystathionine gamma-lyase |
2.066 |
0.00028413 |
3.42 |
| J9F677 |
Proteasome subunit beta |
1.498 |
0.03145365 |
44.44 |
| A8Q167 |
Fibronectin type III domain containing protein |
1.53 |
0.024579067 |
27.11 |
| J9DVN6 |
Ig-like domain-containing protein |
1.782 |
0.003176492 |
2.28 |
| A0A4E9EW72 |
Hypothetical 24.1 kDa protein C01C10.2 in chromosome X, putative |
1.744 |
0.004360374 |
0 |
| A0A1I8EA17 |
Translation machinery-associated protein 7 homolog |
2.012 |
0.000452006 |
18.63 |
| A0A1I8EQR7 |
Uncharacterized protein |
2.12 |
0.000177617 |
6.31 |
| J9EZA7 |
RRM domain-containing protein |
1.708 |
0.00587942 |
18.04 |
| A0A4E9F572 |
Uncharacterized protein |
1.909 |
0.001093537 |
17.55 |
| A0A1I8EDU1 |
Uncharacterized protein |
1.614 |
0.012592256 |
46.54 |
| A0A0K0IZG5 |
V-type proton ATPase subunit G |
10.228 |
1 × 10⁻¹⁷ |
2.55 |
| A0A4E9FEI0 |
Eukaryotic translation initiation factor 3 subunit L |
1.945 |
0.00080233 |
38.28 |
| A0A4E9FAN7 |
Troponin T, putative |
2.33 |
2.88402 × 10⁻⁵ |
100.89 |
| J9B7U2 |
Uncharacterized protein (Fragment) |
1.856 |
0.001701183 |
245.07 |
| J9FGC0 |
RNA recognition domain-containing protein |
1.797 |
0.002817386 |
12.1 |
| A0A1I8EZZ0 |
Uncharacterized protein |
2.767 |
6.52958 × 10⁻⁷ |
565.66 |
| A0A5S6PD06 |
Uncharacterized protein |
2.856 |
3.0594 × 10⁻⁷ |
7.75 |
| A0A4E9F302 |
Uncharacterized protein |
3.566 |
8.16814E-10 |
1.94 |
| Q04010 |
Major body wall myosin |
1.596 |
0.014566794 |
376.23 |
| A0A3P7GK84 |
Myosin motor domain-containing protein |
6.101 |
1 × 10⁻¹⁷ |
141.91 |
| A0A1P6BIP7 |
BMA-MYO-3 |
1.904 |
0.001131896 |
1079.53 |
| A0A0K0J5T8 |
DNA-directed RNA polymerase subunit beta |
1.54 |
0.022774414 |
5.47 |
| A0A4E9F0V9 |
Succinate--CoA ligase [ADP-forming] subunit beta, mitochondrial |
2.732 |
8.84871 × 10⁻⁷ |
115.1 |
| A0A0J9XRM8 |
Bm14768 |
1.57 |
0.017937114 |
19.38 |
| J9EI41 |
Cystathionine gamma-lyase |
2.066 |
0.00028413 |
46.78 |
| A0A3P7DV80 |
Superoxide dismutase [Cu–Zn] |
1.563 |
0.01891622 |
35.86 |
| A0A0J9XPV1 |
NADH dehydrogenase [ubiquinone] 1 alpha subcomplex subunit 12 |
2.593 |
2.9264 × 10⁻⁶ |
2.08 |
| A0A1I8ENX1 |
PITH domain-containing protein |
2.57 |
3.58715 × 10⁻⁶ |
4.32 |
| A0A0I9N6H9 |
BMA-MLC-3 |
2.003 |
0.000487386 |
365.3 |
| A0A1I8EDQ8 |
Myosin tail family protein |
2.289 |
4.116 × 10⁻⁵ |
1162.25 |
| A0A4E9FKG6 |
Tropomyosin family protein |
1.809 |
0.002544887 |
172.22 |
| E3UV59 |
Glutathione S-transferase |
1.729 |
0.004939501 |
5.48 |
| A0A4E9F8C5 |
Ribokinase |
3.63 |
4.87338E-10 |
10.3 |
| A0A1I8EJF9 |
Phosphoglycerate mutase (2,3-diphosphoglycerate-independent) |
19.675 |
1 × 10⁻¹⁷ |
267.39 |
| A0A1I8EW76 |
60S ribosomal protein L18 |
1.669 |
0.008113791 |
4.47 |
| J9F341 |
Ubiquitin carboxyl-terminal hydrolase |
1.509 |
0.028919869 |
15.5 |
| A0A1I8EA31 |
ANK_REP_REGION domain-containing protein |
1.764 |
0.003696815 |
0 |
| A0A0K0J4J0 |
NADH dehydrogenase [ubiquinone] flavoprotein 1, mitochondrial |
1.607 |
0.013372543 |
11.74 |
| J9EMX1 |
Eukaryotic translation initiation factor 3 subunit K |
1.817 |
0.002374081 |
9.89 |
| A0A3P7DI98 |
Uncharacterized protein |
1.502 |
0.030415891 |
2.16 |
| A0A4E9FDF7 |
NADAR domain-containing protein |
1.643 |
0.009969112 |
1.61 |
| J9EFL6 |
Uncharacterized protein (Fragment) |
2.515 |
5.76792 × 10⁻⁶ |
82.5 |
| A0A3P7DJC8 |
Uncharacterized protein |
2.247 |
5.88975 × 10⁻⁵ |
50.08 |
| A0A1P6CFB8 |
60S ribosomal protein L7a |
2.172 |
0.000113527 |
52.15 |
| A0A7I4NMH9 |
Uncharacterized protein |
1.935 |
0.000869051 |
330.94 |
| A0A0K0JJA5 |
Non-specific serine/threonine protein kinase |
3.057 |
5.53284 × 10⁻⁸ |
1.93 |
| J9EM29 |
Uncharacterized protein (Fragment) |
2.247 |
5.88587 × 10⁻⁵ |
7.03 |
| J9E9B2 |
Uncharacterized protein |
1.533 |
0.023965505 |
35.65 |
| A0A0J9XP99 |
BMA-PRPF-4, isoform b |
1.896 |
0.001220539 |
2.32 |
| A0A4E9F8S5 |
WD-repeat protein WDC146, putative |
1.757 |
0.003911261 |
12.73 |
| A0A1I8ERN7 |
Uncharacterized protein |
1.572 |
0.017604686 |
28.99 |
| A0A0K0J064 |
BMA-TIN-10 |
2.074 |
0.00026445 |
6.43 |
| J9EZX6 |
Uncharacterized protein |
1.984 |
0.000573261 |
2.04 |
| J9EYI1 |
Phosphatidylinositol-4,5-bisphosphate 4-phosphatase |
1.685 |
0.007090721 |
1.77 |
| A0A4E9EX33 |
Rasputin, putative |
1.632 |
0.010902888 |
5.34 |
| P90689 |
Actin |
2.138 |
0.000152517 |
6421.99 |
| A0A0J9XXG2 |
Bm4971, isoform c |
2.515 |
5.77475 × 10⁻⁶ |
916.83 |
| A0A0K0JXX0 |
Bm9047 |
1.749 |
0.004203347 |
7.77 |
| A0A1I8EG76 |
Sorting nexin |
1.604 |
0.013650175 |
4.77 |
| A0A1I8ESS3 |
Apple domain-containing protein |
1.677 |
0.007605868 |
5.17 |
| J9EF28 |
Uncharacterized protein (Fragment) |
1.915 |
0.001035958 |
132.21 |
| A0A4E9FQW3 |
Protein-tyrosine-phosphatase |
1.814 |
0.002432581 |
4.07 |
| A0A4E9FQE3 |
Importin-beta N-terminal domain containing protein |
2.184 |
0.000102445 |
17.52 |
| J9B374 |
Sorting nexin-12 |
1.596 |
0.014622216 |
46.04 |
Table 3 List of downregulated proteins in control vs. OSAgNPs treated group
| Accession |
Description |
Abundance ratio: (treated)/(control) |
Abundance ratio P-value: (treated)/(control) |
Score sequest HT |
| A0A4E9F713 |
Collagen IV NC1 domain-containing protein |
0.39 |
5.31376 × 10⁻⁵ |
116.96 |
| J9EH11 |
CULLIN_2 domain-containing protein |
0.01 |
1 × 10⁻¹⁷ |
0 |
| A0A4E9EXI3 |
Uncharacterized protein |
0.568 |
0.020732457 |
22.32 |
| A0A4E9ERK7 |
p27, putative |
0.668 |
0.117288598 |
217.31 |
| A0A0K0JST2 |
Bm7534 |
0.556 |
0.01613457 |
1.65 |
| A0A0J9XSV8 |
Calreticulin |
0.01 |
1 × 10⁻¹⁷ |
161.07 |
| A0A0J9Y695 |
Eukaryotic translation initiation factor 3 subunit H |
0.498 |
0.003584272 |
28.44 |
| A0A4E9FD64 |
GOLGA2L5 domain-containing protein |
0.01 |
1 × 10⁻¹⁷ |
11.44 |
| A0A3P7EM85 |
RRM domain-containing protein (Fragment) |
0.469 |
0.001388476 |
12.59 |
| A0A4E9F3S9 |
Mitochondrial glycoprotein |
0.511 |
0.005198066 |
15.25 |
| A0A3P7EGS9 |
PDZ domain-containing protein |
0.01 |
1 × 10⁻¹⁷ |
2.23 |
| A0A0I9R2V8 |
Bm3963, isoform a |
0.76 |
0.331949126 |
22.57 |
| A0A4E9F9W9 |
Uncharacterized protein |
0.01 |
1 × 10⁻¹⁷ |
2.18 |
| A0A1I8EN40 |
Guanylate kinase |
0.01 |
1 × 10⁻¹⁷ |
9.09 |
| J9EUV2 |
DNA/pantothenate metabolism flavoprotein |
0.652 |
0.093188782 |
7.86 |
| J9BCB6 |
Uncharacterized protein |
0.438 |
0.000452327 |
72.54 |
| A0A4E9ETN8 |
Tryparedoxin, putative |
0.633 |
0.069411568 |
15.31 |
| A0A1I8ERA9 |
Sulfhydryl oxidase |
0.642 |
0.081051968 |
8.66 |
| J9F6A2 |
SH3 domain-containing protein |
0.366 |
1.49581 × 10⁻⁵ |
2.53 |
| A0A3P7G2R2 |
H15 domain-containing protein |
0.616 |
0.052815285 |
15.77 |
| A0A4E9FDH4 |
Uncharacterized protein |
0.568 |
0.020720135 |
9.37 |
| A0A4E9EU80 |
Uncharacterized protein |
0.473 |
0.001627636 |
0 |
| A0A4E9EXG9 |
RWD domain-containing protein |
0.01 |
1 × 10⁻¹⁷ |
12.11 |
| A0A1I8EQ15 |
Serine/threonine-protein phosphatase |
0.642 |
0.080969648 |
32.49 |
| A0A0K0IZH4 |
U6 snRNA-associated Sm-like protein LSm1 |
0.269 |
9.05566 × 10⁻⁹ |
7.59 |
| A0A4E9ERH0 |
MHD domain-containing protein |
0.01 |
1 × 10⁻¹⁷ |
0 |
| A0A183XC56 |
Uncharacterized protein |
0.66 |
0.104647575 |
20.31 |
| A0A1I8ESY8 |
Uncharacterized protein |
0.292 |
8.06802 × 10⁻⁸ |
9.87 |
| A0A0K0JCT4 |
Bm4012, isoform c |
0.604 |
0.042325562 |
128.7 |
| A0A1I9GCQ7 |
BMA-CBN-1 |
0.571 |
0.02201965 |
2.6 |
| A0A7I4KFL2 |
Histone H2B |
0.479 |
0.001972824 |
76.96 |
| A0A3P7DEX3 |
Eukaryotic translation initiation factor 3 subunit C |
0.649 |
0.089448353 |
30.51 |
| A0A1I8EDE4 |
Uncharacterized protein |
0.662 |
0.108420961 |
101.17 |
| A0A1I8EVX5 |
Mannose-6-phosphate isomerase |
0.01 |
1 × 10⁻¹⁷ |
13.31 |
| A0A4E9EZZ3 |
Uncharacterized protein |
0.497 |
0.003400259 |
5.59 |
| A0A0I9N5X2 |
BMA-HINT-3 |
0.01 |
1 × 10⁻¹⁷ |
10.98 |
| A8Q043 |
cAMP-dependent protein kinase regulatory chain, putative |
0.01 |
1 × 10⁻¹⁷ |
10.84 |
| J9FG14 |
Heat shock 70 protein (Fragment) |
0.458 |
0.000947605 |
1581.93 |
| J9B0S3 |
Peptide-methionine (R)-S-oxide reductase |
0.613 |
0.050003528 |
12.97 |
| A0A4E9F7P5 |
Intermediate filament protein Ov71, putative |
0.498 |
0.003551624 |
148.68 |
| A0A4E9EQU4 |
Uncharacterized protein |
0.654 |
0.096035911 |
43.53 |
| A0A0I9N461 |
ADP/ATP translocase |
0.664 |
0.111721821 |
100.19 |
| A0A5S6PI69 |
SPARC, putative |
0.584 |
0.028931832 |
28.78 |
| A0A4E9FJK0 |
Thioredoxin domain-containing protein |
0.666 |
0.114569485 |
646.62 |
| A0A3P7FL15 |
Oxidored_FMN domain-containing protein |
0.541 |
0.011170915 |
64.16 |
| J9BGY5 |
Uncharacterized protein |
0.01 |
1 × 10⁻¹⁷ |
5.07 |
| A0A4E9FPI2 |
Protein-L-isoaspartate O-methyltransferase |
0.523 |
0.007061644 |
19.29 |
| A0A0K0IYI4 |
Proteasome subunit beta |
0.384 |
3.90786 × 10⁻⁵ |
12.38 |
| A0A1I8ENA1 |
ATP-dependent RNA helicase DDX1 |
0.415 |
0.000169853 |
84.71 |
| A0A4E9FGF9 |
Multifunctional methyltransferase subunit TRM112-like protein |
0.01 |
1 × 10⁻¹⁷ |
4.78 |
| J9F2G5 |
Signal recognition particle 14 kDa protein |
0.01 |
1 × 10⁻¹⁷ |
2.35 |
| J9EP49 |
Papain family cysteine protease containing protein (Fragment) |
0.574 |
0.023624401 |
4.97 |
| J9F1F7 |
Splicing factor 45 |
0.01 |
1 × 10⁻¹⁷ |
0 |
| A0A4E9FRB2 |
Serine/threonine-protein phosphatase 2A activator |
0.319 |
6.85623 × 10⁻⁷ |
36.1 |
| A0A3P7GMD3 |
Uncharacterized protein |
0.548 |
0.0132847 |
194.96 |
| A0A0H5S5D4 |
Bm2017 |
0.654 |
0.096546488 |
0 |
| J9ELW9 |
Chaperonin GroL |
0.432 |
0.000356664 |
651.97 |
| A0A3P7E0J8 |
Uncharacterized protein |
0.611 |
0.048638726 |
18.78 |
| A0A183XS33 |
PPM-type phosphatase domain-containing protein |
0.659 |
0.104228142 |
7.46 |
| J9ELM0 |
Protein disulfide-isomerase |
0.665 |
0.112101409 |
157.49 |
| A0A1P6C045 |
Histone H4 |
0.322 |
8.78598 × 10⁻⁷ |
82.76 |
| A0A4E9FES7 |
UNC-52/perlecan, putative |
0.564 |
0.019072398 |
103.28 |
| A0A0H5S4P3 |
Adenylate kinase isoenzyme 1 |
0.606 |
0.0440707 |
376.45 |
| A0A1I8E9A9 |
Uncharacterized protein |
0.635 |
0.071944787 |
104.72 |
| A0A1I8EIH1 |
Splicing factor 3A subunit 3 |
0.653 |
0.095344137 |
14.46 |
| A0A4E9F8W1 |
UBC core domain-containing protein |
0.643 |
0.081190023 |
120.48 |
| J9EZX2 |
Uncharacterized protein |
0.593 |
0.034436113 |
15.15 |
| A0A1I8EM83 |
Leucine--tRNA ligase |
0.01 |
1 × 10⁻¹⁷ |
12.29 |
| A0A7I4KM80 |
Proteasome activator pa28 beta subunit family protein |
0.405 |
0.000107715 |
19.71 |
| A0A3P7FGQ8 |
Tyrosine--tRNA ligase |
0.629 |
0.066026078 |
9 |
| J9FBW7 |
Small heat shock protein |
0.54 |
0.011032497 |
15.88 |
| A0A0H5S2P4 |
60S ribosomal protein L29 |
0.46 |
0.001015711 |
6.39 |
| J9F0A4 |
TBC domain-containing protein |
0.454 |
0.000821992 |
4.52 |
| A0A1I8EIF1 |
UAS domain-containing protein |
0.411 |
0.000146767 |
11.4 |
| A0A0K0JCV4 |
Bm4025 |
0.654 |
0.095908276 |
11.41 |
| A0A4E9EUK8 |
Uncharacterized protein |
0.392 |
5.82324 × 10⁻⁵ |
5.94 |
| A0A3P7G9V9 |
Dolichol-phosphate mannosyltransferase subunit 1 |
0.01 |
1 × 10⁻¹⁷ |
0 |
| J9F457 |
26S proteasome non-ATPase regulatory subunit Nin1/mts3 family protein |
0.64 |
0.078214319 |
4.73 |
| A0A3P7EFR0 |
Uncharacterized protein |
0.551 |
0.014245454 |
11.33 |
| A0A3P7DS02 |
Uncharacterized protein |
0.558 |
0.016577961 |
4.82 |
| A0A0K0JKQ9 |
Bm5876 |
0.01 |
1 × 10⁻¹⁷ |
12.57 |
| A8QH13 |
Transforming growth factor b homolog, putative |
0.667 |
0.116229835 |
13.78 |
| A0A7I4KGB0 |
NADH-ubiquinone oxidoreductase 24 kDa subunit, mitochondrial, putative |
0.01 |
1 × 10⁻¹⁷ |
5.19 |
| A0A3P7EDP1 |
Striatin domain-containing protein |
0.587 |
0.030641171 |
2.92 |
| A0A4E9FC72 |
Histone H3, putative |
0.635 |
0.071845133 |
82.83 |
| P90699 |
Putative RNA binding protein |
0.575 |
0.024181177 |
15.49 |
| A0A7I4KHH8 |
BMA-ZYX-1 |
0.408 |
0.00012468 |
2.47 |
| A0A4E9FZZ7 |
RRM domain-containing protein |
0.478 |
0.00192784 |
85.38 |
| J9BDI3 |
60S ribosomal protein L32 |
0.485 |
0.002361855 |
62.91 |
| A0A0K0JD86 |
BMA-CUL-4 |
0.01 |
1 × 10⁻¹⁷ |
4.53 |
| A0A0H5S845 |
Coatomer subunit zeta |
0.461 |
0.001082192 |
15.05 |
| A0A0H5S6P0 |
Bm4536 |
0.282 |
3.24203 × 10⁻⁸ |
32.26 |
| A0A3P7DW72 |
Uncharacterized protein (Fragment) |
0.67 |
0.121165365 |
12.46 |
| A0A4E9EYB0 |
Cleavage stimulation factor, putative |
0.01 |
1 × 10⁻¹⁷ |
0 |
| J9EYL6 |
Uncharacterized protein |
0.592 |
0.034162971 |
11.31 |
| A0A1I9GCK8 |
Bm15494 |
0.01 |
1 × 10⁻¹⁷ |
2.16 |
| A0A4E9FT71 |
Signal recognition particle 54 kDa protein |
0.01 |
1 × 10⁻¹⁷ |
4.94 |
| A0A4E9EYE7 |
RRM domain-containing protein |
0.01 |
1 × 10⁻¹⁷ |
4.58 |
| A0A3P7F7C6 |
C2H2-type domain-containing protein |
0.01 |
1 × 10⁻¹⁷ |
2.27 |
| A0A1I8EI32 |
ATP-binding cassette |
0.639 |
0.076728778 |
7.42 |
| A0A1I8EZH2 |
Phosphorylase b kinase regulatory subunit |
0.501 |
0.003888383 |
4.1 |
| A0A1I8EC76 |
T6PP_N domain-containing protein |
0.618 |
0.05412924 |
6.13 |
| J9F6W8 |
Uncharacterized protein (Fragment) |
0.61 |
0.047472365 |
6.33 |
| A0A0K0JR82 |
BMA-UBC-14 |
0.01 |
1 × 10⁻¹⁷ |
2.05 |
| A0A1I9G4M2 |
Bm7621, isoform c |
0.41 |
0.000138793 |
2.39 |
| A0A1I9G3L0 |
BMA-MTCH-1, isoform d |
0.01 |
1 × 10⁻¹⁷ |
12.43 |
| A0A1I8EMJ6 |
Fatty acid oxidation complex |
0.639 |
0.076995583 |
10.78 |
| A0A3P7EML4 |
26S proteasome non-ATPase regulatory subunit 6 |
0.673 |
0.126627232 |
35.64 |
| A0A1I9G7E2 |
BMA-ACIN-1, isoform a |
0.541 |
0.011148325 |
7.98 |
| A0A1I9G795 |
BMA-ATX-2, isoform j |
0.01 |
1 × 10⁻¹⁷ |
10.65 |
| A0A1I8EHC6 |
WD_REPEATS_REGION domain-containing protein |
0.01 |
1 × 10⁻¹⁷ |
7.77 |
| J9DX04 |
RRM domain-containing protein (Fragment) |
0.525 |
0.007567659 |
2.29 |
| A0A1P6CD63 |
Histone H2A |
0.596 |
0.036774833 |
95.88 |
| J9BHL4 |
Uncharacterized protein |
0.65 |
0.090764387 |
6.45 |
| A0A1I8EHZ9 |
Glutamate--tRNA ligase |
0.508 |
0.004665651 |
21.48 |
| A0A4E9FA17 |
Uncharacterized protein |
0.655 |
0.097713949 |
26.48 |
| A0A3P7DJ83 |
Transmembrane protein 258 |
0.42 |
0.000213686 |
6.25 |
| J9B6T8 |
U4/U6 small nuclear ribonucleoprotein Prp31 |
0.516 |
0.005939834 |
3.51 |
| A0A0I9NAH1 |
Bm12984 |
0.01 |
1 × 10⁻¹⁷ |
0 |
| A0A0J9Y4U4 |
BMA-EGL-30 |
0.569 |
0.021392617 |
2.43 |
| A0A1I8EQI0 |
Uncharacterized protein |
0.342 |
3.48676 × 10⁻⁶ |
17.46 |
| J9E5G9 |
Myosin_tail_1 domain-containing protein (Fragment) |
0.56 |
0.017638063 |
58.44 |
| J9FF86 |
ATP-dependent Clp protease proteolytic subunit |
0.01 |
1 × 10⁻¹⁷ |
11.74 |
| A0A4E9FJB8 |
Phosphoglycerate mutase family protein |
0.327 |
1.18996 × 10⁻⁶ |
25.98 |
| A0A0H5S5U2 |
BMA-CUL-3 |
0.01 |
1 × 10⁻¹⁷ |
6.22 |
| A0A1I8EF89 |
Phenylalanine--tRNA ligase |
0.561 |
0.01791942 |
7.23 |
| J9EZY7 |
Alanine--tRNA ligase |
0.538 |
0.010388903 |
11.52 |
| A0A0J9Y3N8 |
RNA helicase |
0.01 |
1 × 10⁻¹⁷ |
3.2 |
| A0A0J9Y0Q8 |
BMA-HIP-1 |
0.607 |
0.045063353 |
73.05 |
| A0A1I8ESJ2 |
PHB domain-containing protein |
0.449 |
0.000683132 |
36.93 |
| A0A1I8EPC5 |
Ge1_WD40 domain-containing protein |
0.598 |
0.03795328 |
11.08 |
| A0A4E9FGA6 |
Signal recognition particle receptor alpha subunit, putative |
0.01 |
1 × 10⁻¹⁷ |
2.03 |
| A0A1I8EHS3 |
Uncharacterized protein |
0.01 |
1 × 10⁻¹⁷ |
7.6 |
| A0A183XKF1 |
PIPK domain-containing protein |
0.01 |
1 × 10⁻¹⁷ |
2.11 |
| A0A5S6PNY5 |
Spectrin beta chain |
0.564 |
0.018973378 |
23.71 |
| A0A4E9F4P0 |
Vacuolar ATP synthase subunit D, putative |
0.674 |
0.128267858 |
2.06 |
| A0A0H5S1U2 |
NADH dehydrogenase [ubiquinone] 1 beta subcomplex subunit 10 |
0.539 |
0.010693356 |
7.81 |
| A0A1I9G4A9 |
BMA-ALH-11, isoform b (Fragment) |
0.519 |
0.006464945 |
42 |
| A0A0I9NA30 |
BMA-LSM-6 |
0.604 |
0.042599403 |
35.12 |
| A0A4E9FA01 |
Glyceraldehyde-3-phosphate dehydrogenase |
0.635 |
0.072353055 |
2650.13 |
| A0A7I4NJV0 |
ATP-dependent (S)-NAD(P)H-hydrate dehydratase |
0.651 |
0.092093112 |
15 |
| A0A1I9GB23 |
Bm12220 (Fragment) |
0.01 |
1 × 10⁻¹⁷ |
6.67 |
| A0A4E9F6R1 |
SHSP domain-containing protein |
0.66 |
0.105509104 |
20.58 |
| A0A7I4KLU1 |
BMA-RAL-1, isoform b |
0.01 |
1 × 10⁻¹⁷ |
6.77 |
The major detoxifying enzymes Glutathione S-transferase (GST), Superoxide dismutase (SOD) and Methionine sulfoxide reductase (MSR) that help in scavenging oxidants and act as parasites' first line of defence were upregulated after treatment with OSAgNPs. The enzyme GST and SOD are also involved in xenobiotics metabolism and their upregulation signifies an increased need for detoxification following treatment with nanoparticles. The enzyme Methionine Sulfoxide Reductase (MSR) protects against oxidative damage by reversing methionine sulphoxides to methionine. Similarly, the PITH (C-terminal proteasome interacting domain of Thioredoxin-like) domain containing protein which is involved in transcription, signal transduction and chromatin organization was also upregulated. PITH is present in exosomes/vesicles and, tends to coregulate with mitochondrial protein components. The homologs of the protein are being studied in Alzheimer, Parkinson and certain type of cancer,30,31 however, its role in filarial parasites and LF progression is not well characterized to date.
The major structural elements actin, myosin, and Troponin T were upregulated in the OSAgNPs treated filarial worms. Myosin and actin form the molecular machines for the contraction of sarcomeres and convert chemical energy to mechanical energy. It is quite possible that treatment with OSAgNPs resulted in extensive muscular contractions, ultimately leading to the rupture of the body wall of the parasites (Fig. 3) which could be visually seen after 4 h of treatment. The enzyme ribokinase catalyzing the conversion of ATP to ADP was upregulated, corroborating well with the downregulation of the Guanylate kinase and Adenylate kinase. The TCA cycle enzyme succinate-CoA ligase (ADP forming) was highly expressed too, confirming an increase in the production of ATP following OSAgNPs treatment. Furthermore, the glycolytic enzyme Phosphoglycerate mutase was also highly upregulated. The 2,3-diphosphoglycerate independent (iPGM) form of the enzyme has already been well studied in O. volvulus, B. malayi and W. bancrofti and implicated as a potential drug target.32
3.5. Gene ontology and functional classification of DEPs
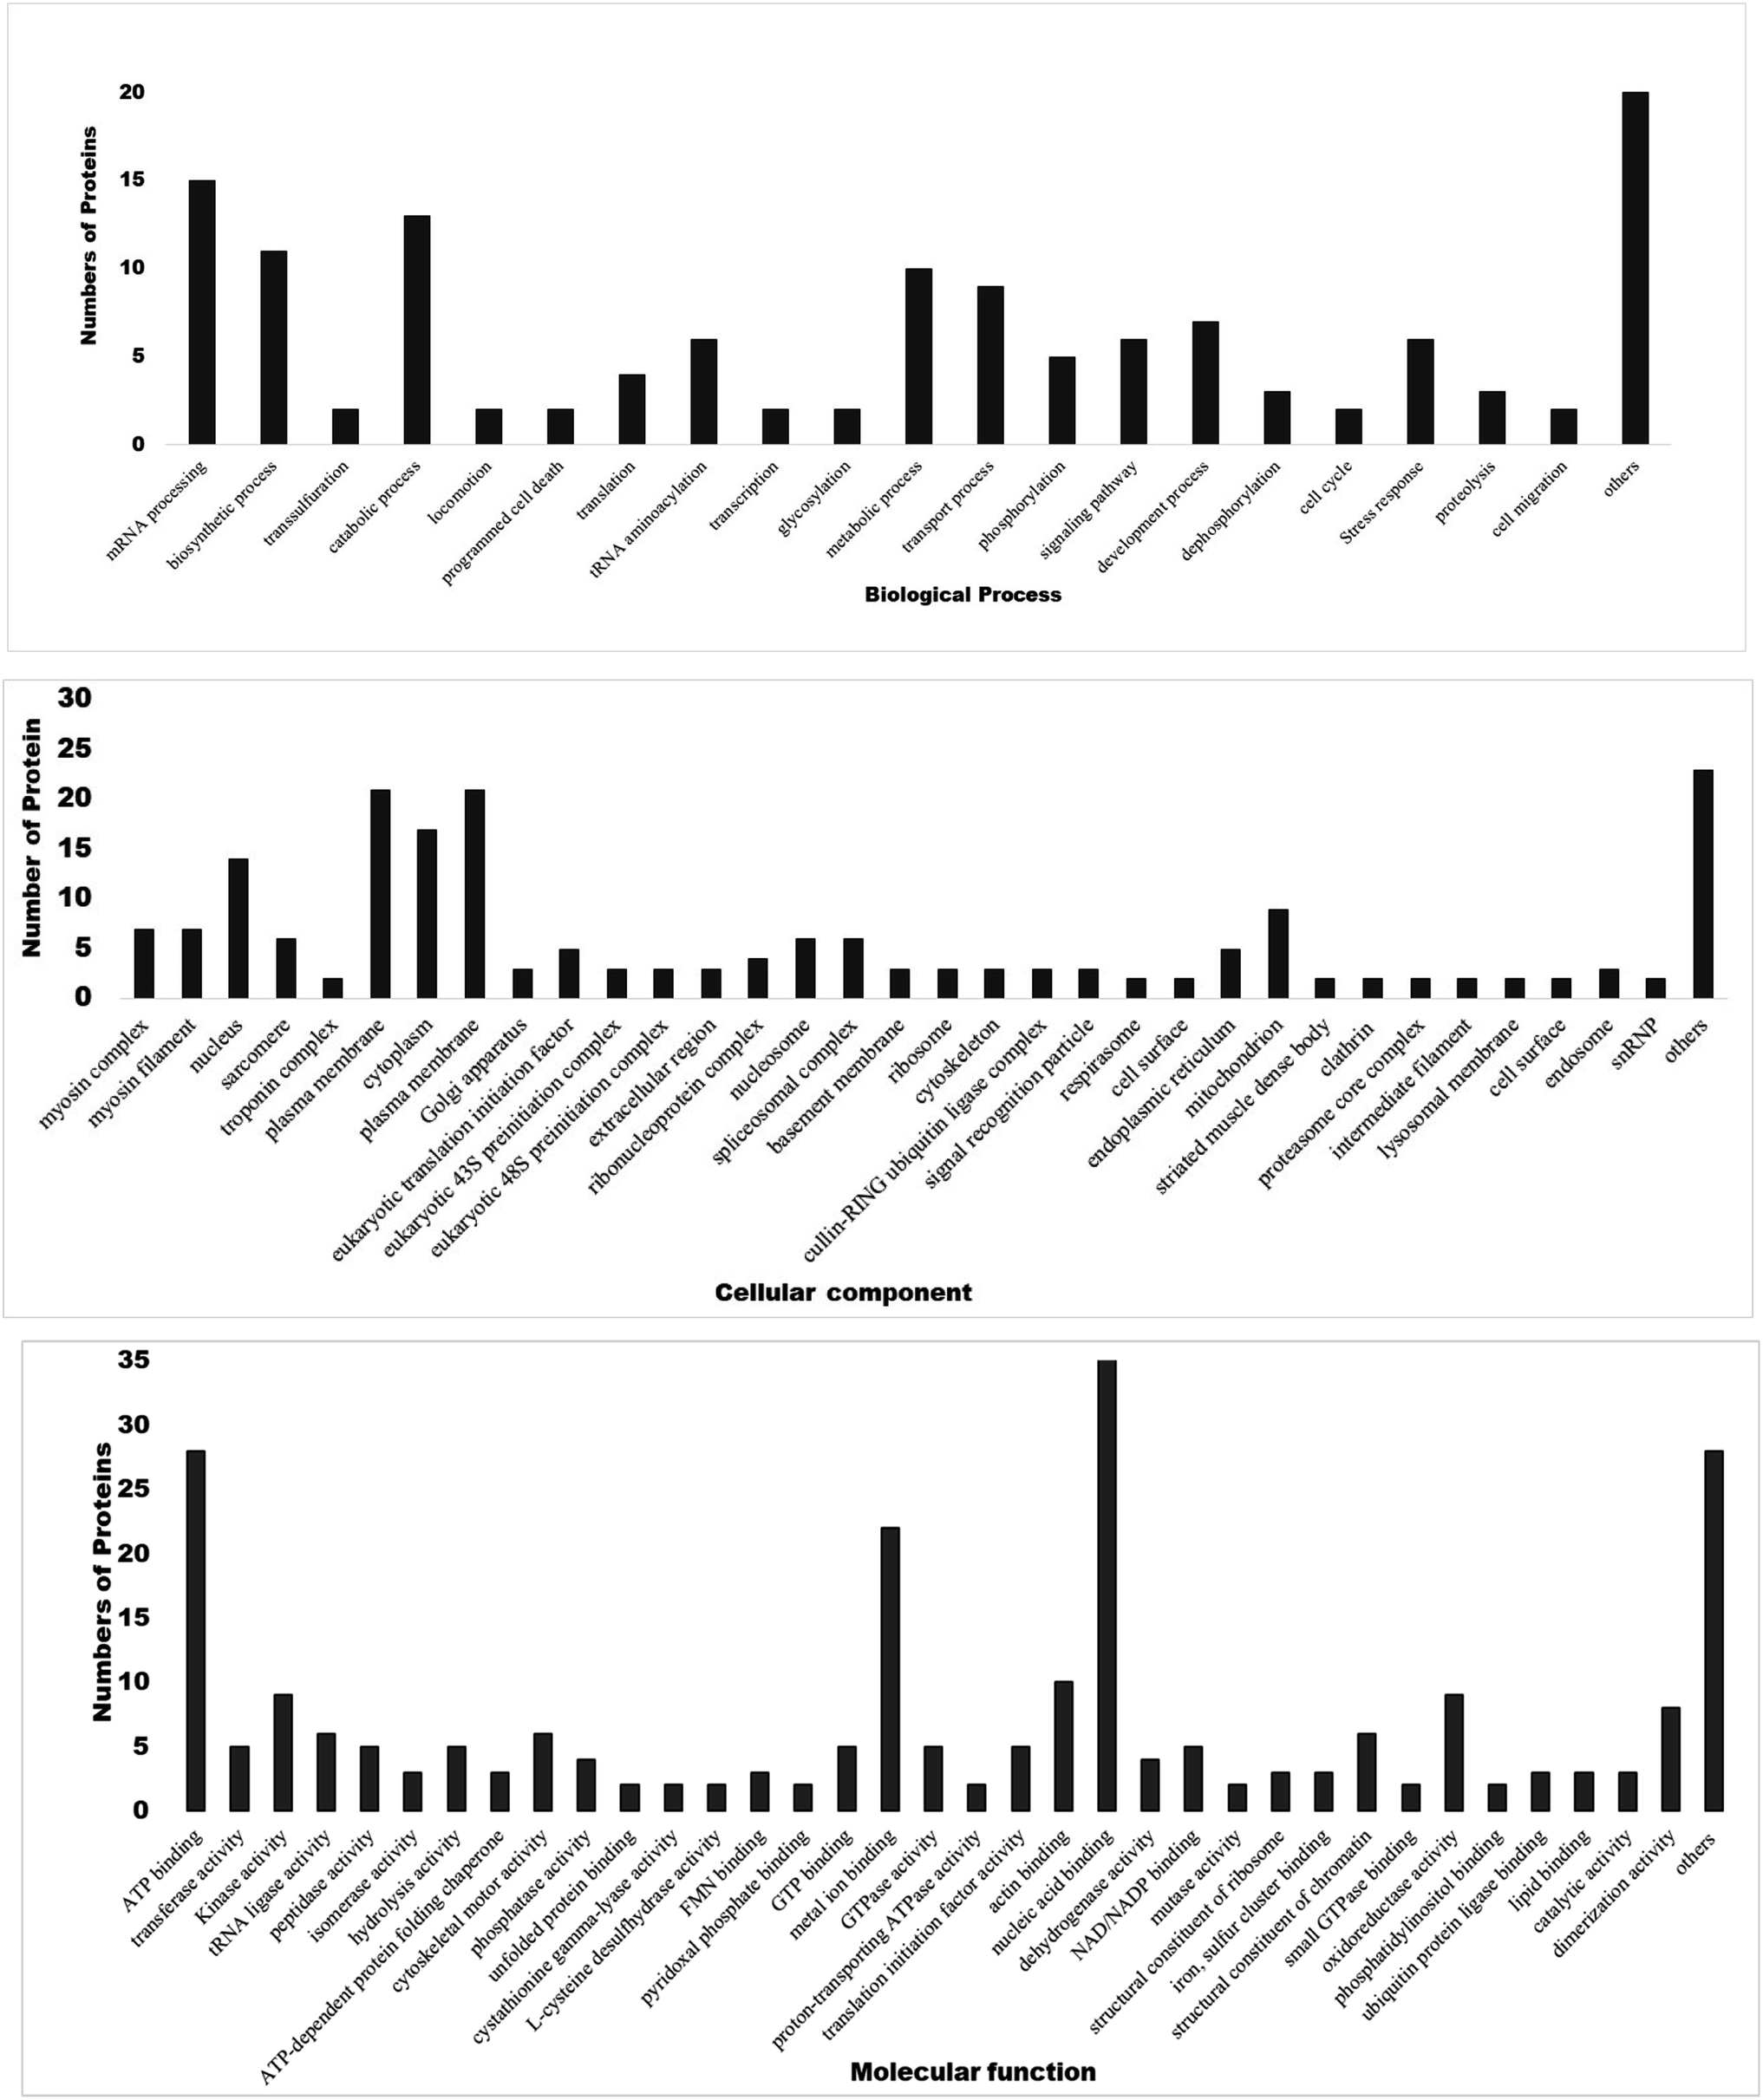
Gene Ontology annotation analysis of most significant DEPs based on molecular function, biological process, and cellular components is shown in Fig. 5. In terms of molecular function, major DEPs participated in ATP binding, kinase activity, metal ion binding, nucleic acid binding, oxidoreductase activity, dimerization activity, and as structural constituents of chromatin. Major DEPs in the category of biological processes belonged to mRNA processing, biosynthetic process, catabolic process, tRNA aminoacylation, metabolic process, transport process, development process and stress response. Furthermore, the myosin complex, nucleus, plasma membrane, cytoplasm, mitochondria, spliceosome complex, nucleosome, and translation initiation factor were significantly enriched in the cellular components. Differential expression patterns of proteins revealed that treatment of filarial worms with OSAgNPs resulted in the downregulation of several proteins that were involved in energy metabolism, signal transduction, stress response, chaperone proteins as well as highly antigenic proteins.
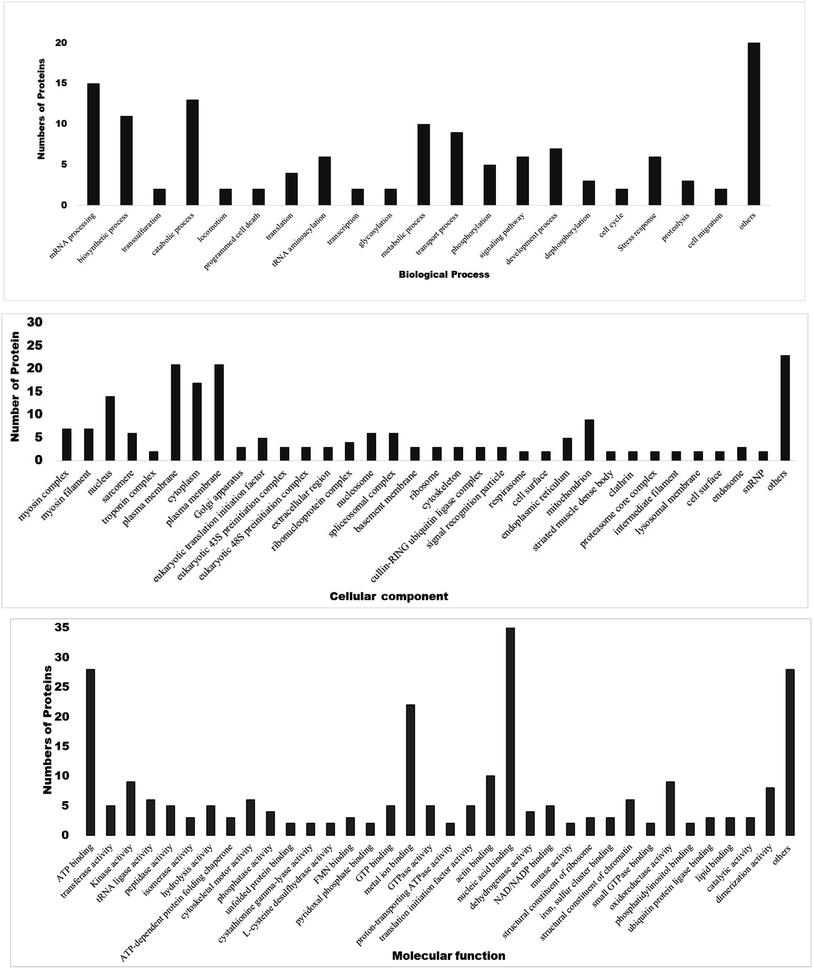 |
| | Fig. 5 Gene ontology annotation analysis of major DEPs classified into three main categories i.e., molecular functions, biological processes and cellular components. | |
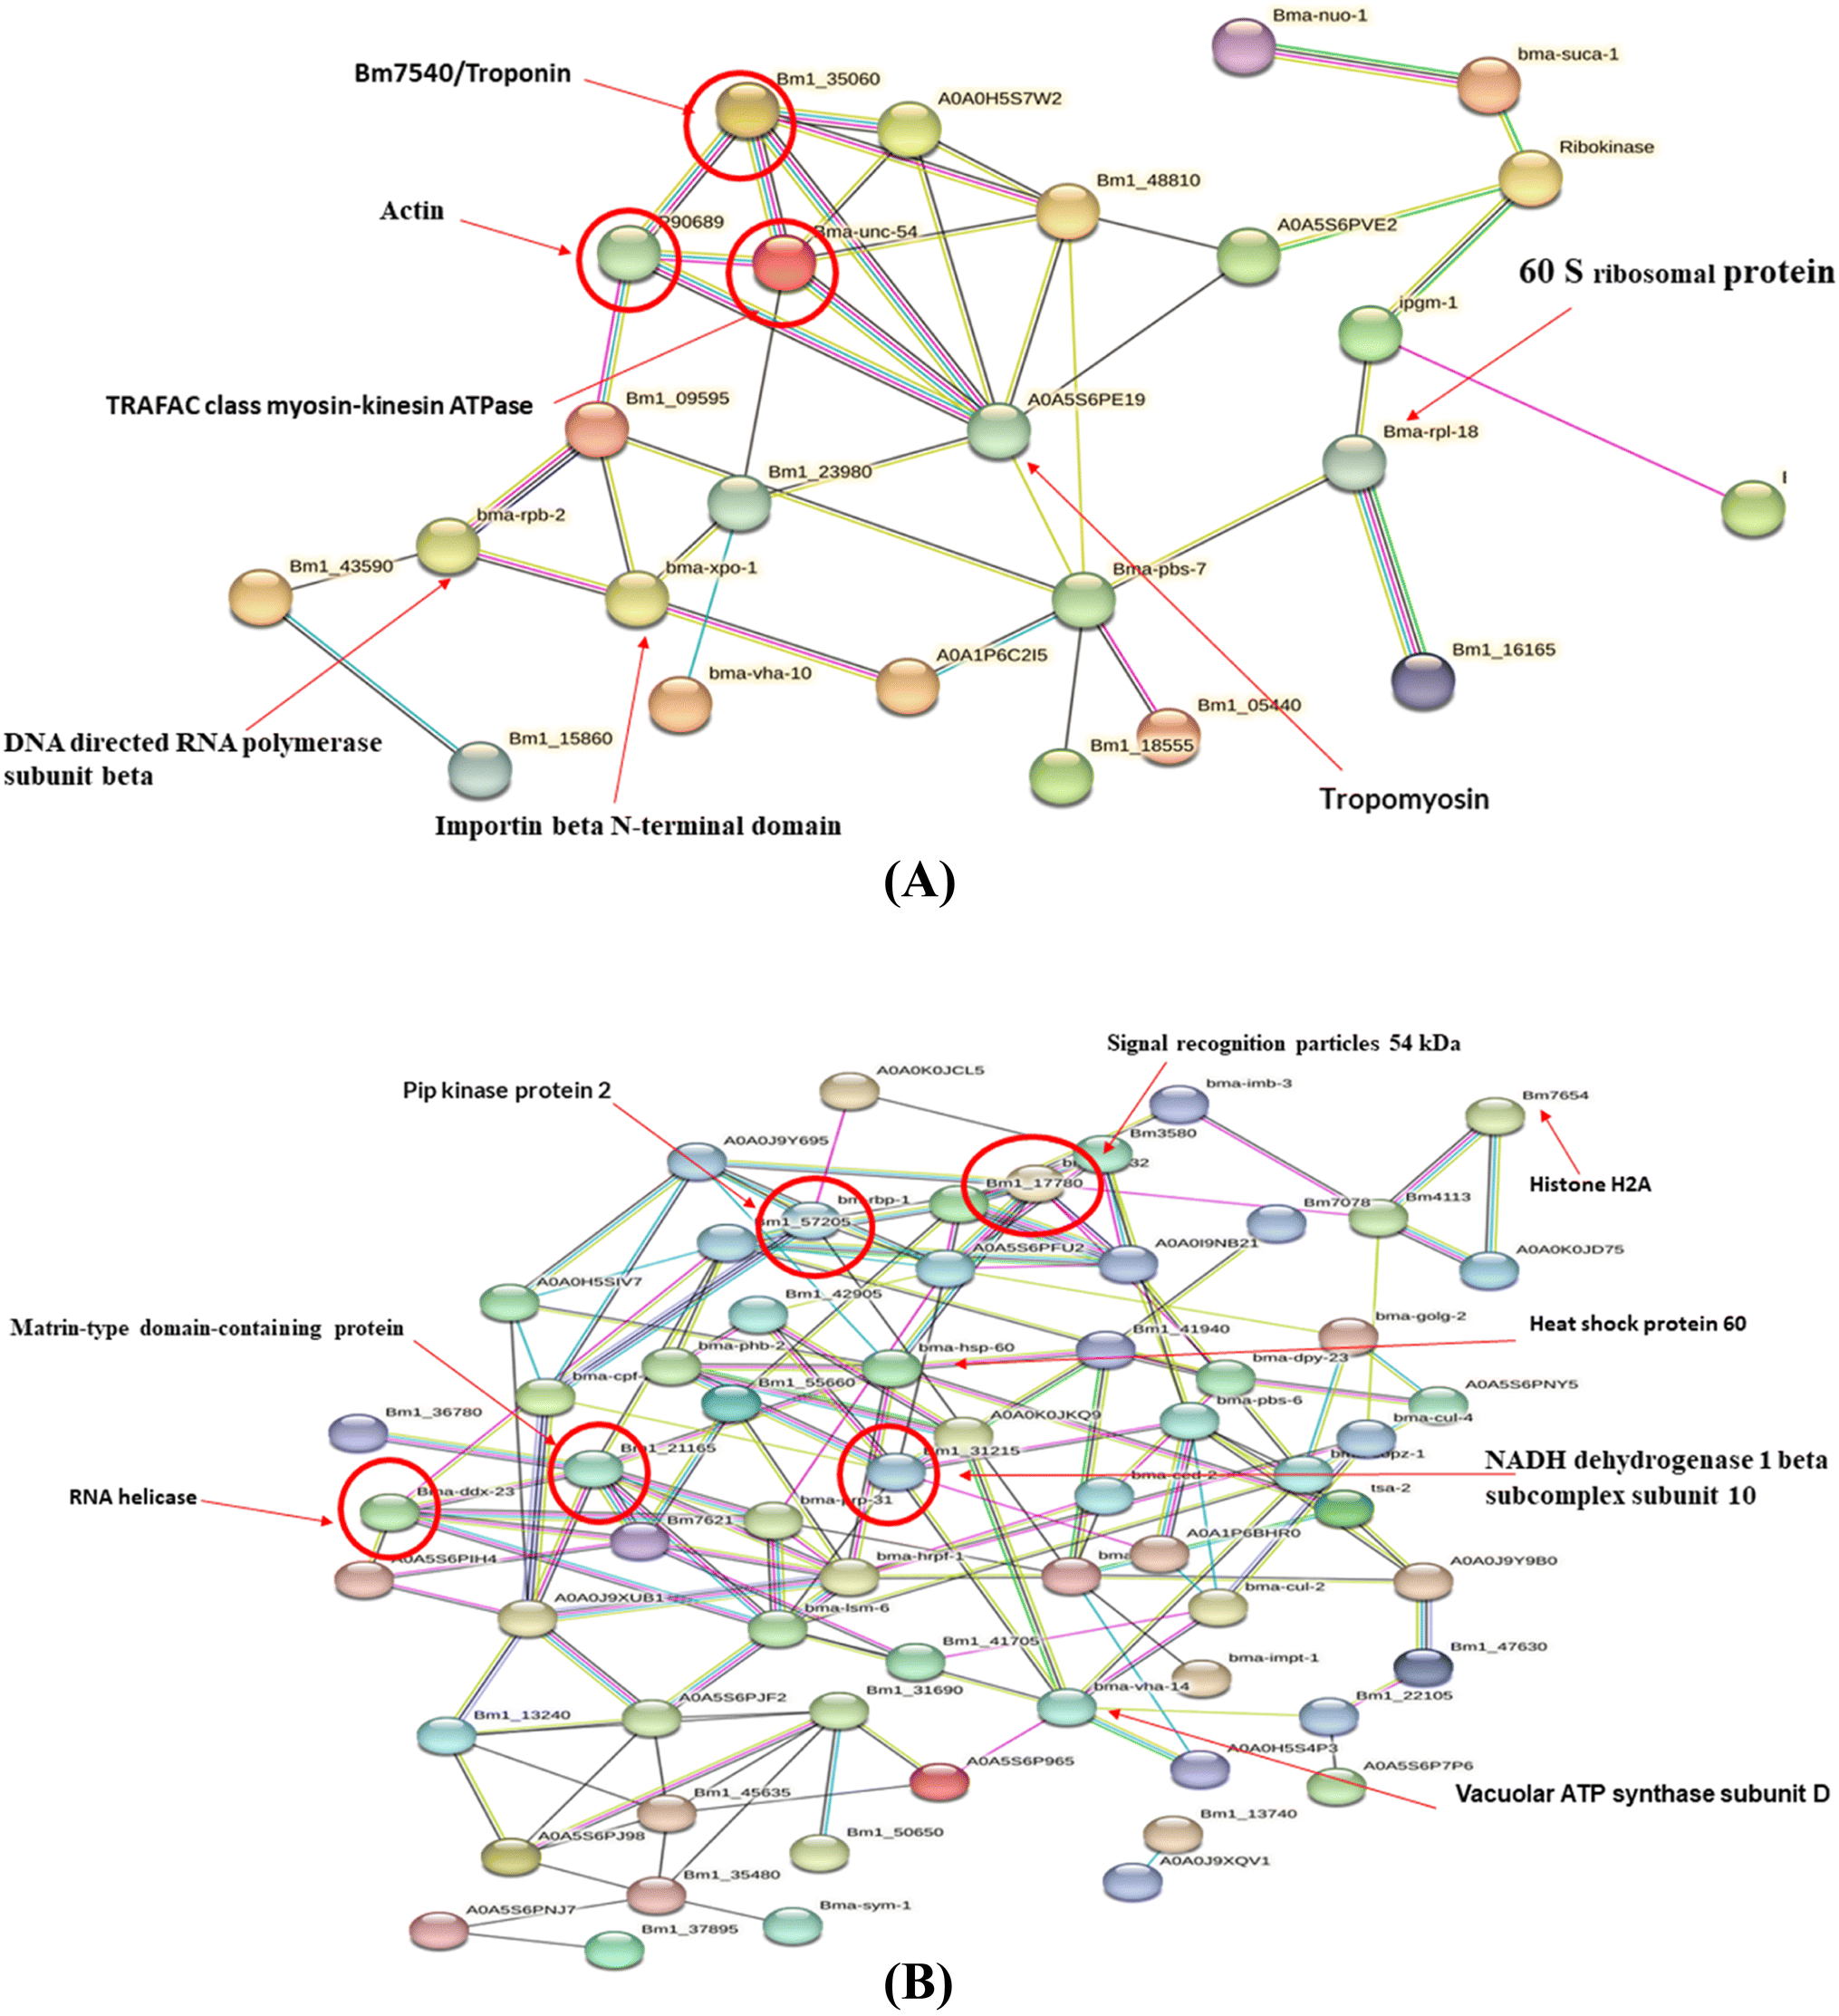
3.6. PPI network analysis
The protein–protein interaction (PPI) analysis of differentially expressed proteins was predicted using the STRING tool. Out of the 69 upregulated proteins, 25 were interrelated to each other, whereas out of the 144 downregulated proteins, 64 were found to interact with each other (Fig. 6A and B). The PPI network of upregulated proteins revealed that troponin, actin, and tropomyosin were highly connected to each other and also with many other upregulated proteins. The downregulated proteins like signal recognition particles, HSP60, PIP kinase protein 2, Matrin-type domain containing protein exhibited the most number of connections in the PPI network. The in silico analysis indicates that the highly connected differentially expressed proteins play crucial roles in filarial metabolism via different signalling pathways and are also sensitive to anti-filarial molecules. Thus, it is anticipated that some of these key proteins may be developed and utilized as therapeutic markers in filarial treatments.
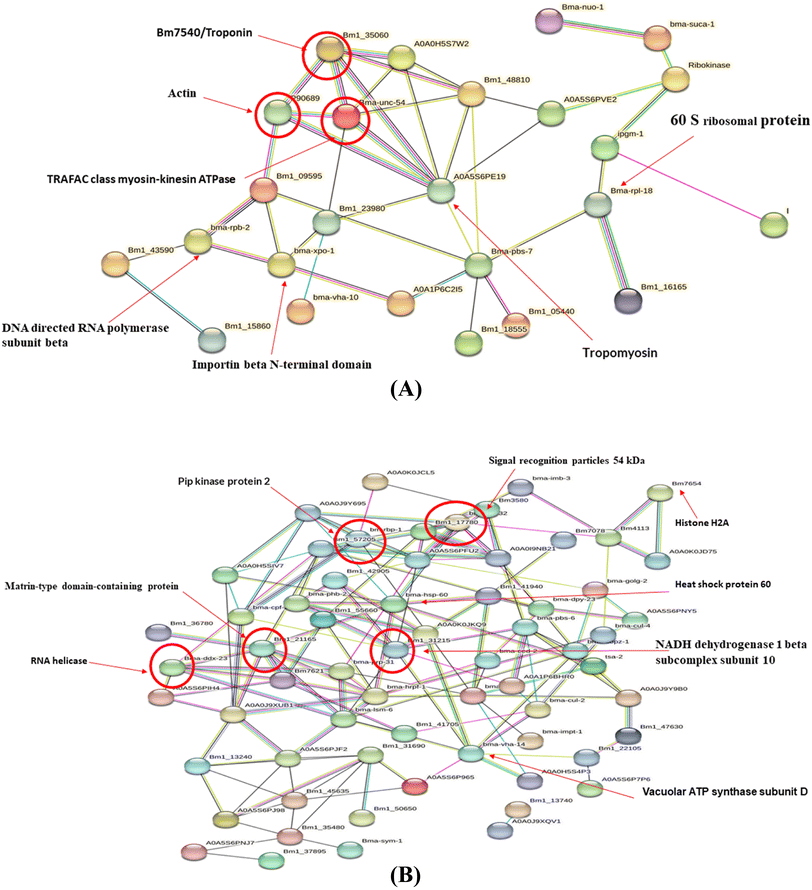 |
| | Fig. 6 Protein–protein interaction of major DEPs. (A) Upregulated proteins (B) downregulated proteins. | |
In summary, the objective of this work was to evaluate the adulticidal activity of naturally synthesized Ocimum sanctum silver nanoparticles and to develop an understanding of its molecular mechanism of action on the filarial parasites. Additionally, the study is opening up new avenues for future research on the effect of OSAgNPs on other filarial parasites, thus broadening the horizons for advanced research in filariasis treatment and management.
4. Conclusion
In this study, Ocimum sanctum silver nanoparticles were synthesized using an eco-friendly, rapid, easy and reproducible method. The green OSAgNPs had profound effect on the metabolism and survival of S. cervi filarial parasites and were also highly effective at very low concentrations. The HRAMS proteomics results proved that the exposure of parasites to OSAgNPs resulted in disruption of important signalling and metabolic pathways. To the best of our knowledge, this is the first report of OSAgNPs exhibiting anti-filarial effect against mature filarial parasites under ex vivo conditions. Undoubtedly, this study will open new avenues for designing and developing new nano-herbal anti-filarial drugs.
Ethical statement
Indian water buffaloes are slaughtered for food as part of non-vegetarian diets. The Setaria cervi worms were procured from the peritoneal lavage of freshly butchered buffaloes. Worms were purchased and brought to the laboratory in KRBMM for further experimental work.
Author contributions
Ayushi Mishra: conceptualization, methodology, data curation, formal analysis, investigation, writing – original draft, review & editing. Sunil Kumar: methodology, writing and editing. Anchal Singh: supervision, project administration, validation, writing – original draft, review & editing. All authors have read and agreed to the published version of the manuscript.
Conflicts of interest
The authors declare no conflict of interest.
Acknowledgements
Ayushi Mishra is grateful to the Council of Scientific and Industrial Research (CSIR), India (09/013(0832)/2018-EMR-I) for providing a Senior Research Fellowship (SRF). Sunil Kumar is thankful to the Banaras Hindu University for UGC-NET Research Fellowship (BHU Res. Sch.) 2021-22/34927. We acknowledge the Interdisciplinary School of Life Sciences, Banaras Hindu University for providing laboratory space and speed-vac concentration facility.
References
- https://www.who.int/news-room/fact-sheets/detail/lymphatic-filariasis.
- J. N. Sangshetti, D. B. Shinde, A. Kulkarni and R. Arote, RSC Adv., 2017, 7, 20628 RSC.
- A. Naganthran, G. Verasoundarapandian, F. E. Khalid, M. J. Masarudin, A. Zulkharnain, N. M. Nawawi, M. Karim, C. A. Che Abdullah Ahmad and S. A. Ahmad, Materials, 2022, 15(2), 427 CrossRef CAS PubMed.
- A. S. Jain, P. S. Pawar, A. Sarkar, V. Junnuthula and S. Dyawanapelly, Int. J. Mol. Sci., 2022, 22(21), 11993 CrossRef PubMed.
- A. Almatroudi, Open Life Sci., 2020, 15(1), 819–839 CAS.
- M. M. Cohen, J. Ayurveda Integr. Med., 2014, 5(4), 251–259 CrossRef PubMed.
- D. Kanojiya, D. Shanker, V. Sudan, A. K. Jaiswal and R. Parashar, Res. Vet. Sci., 2015, 99, 165–170 CrossRef PubMed.
- A. I. P. Sousa, C. R. Silva, H. N. Costa-Júnior, N. C. S. Silva, J. A. O. Pinto, A. F. Blank, A. M. S. Soares and L. M. Costa-Júnior, J. Helminthol., 2021, 95, e17 CrossRef CAS PubMed.
- A. Mishra, V. Kumar and A. Singh, Pharm. Biol., 2022, 60(1), 2237–2252 CrossRef CAS PubMed.
- G. Tailor, B. L. Yadav, J. Chaudhary, M. Joshi and C. Suvalka, Biochem. Biophys. Rep., 2020, 24, 100848 Search PubMed.
- G. Singhal, R. Bhavesh, K. Kasariya, A. R. Sharma and R. A. Singh, J. Nanopart. Res., 2011, 13, 2981–2988 CrossRef CAS.
- S. Jain and M. S. Mehata, Sci. Rep., 2017, 7, 15867 CrossRef PubMed.
- S. Yadav, S. Sharma, F. Ahmad and S. Rathaur, J. Drug Delivery Sci. Technol., 2020, 56, 101557 CrossRef CAS.
- S. Li, Y. Shen, A. Xie, X. Yu, L. Qiu, L. Zhang and Q. Zhang, Green Chem., 2007, 9, 852–858 RSC.
- T. T. Nguyen, P. Zhang, J. Bi, N. H. Nguyen, Y. Dang, Z. Xu, H. Wang, N. Ninan, R. Bright, T. Pham, C. K. Nguyen, Y. Sabri and M. T. Nguyen, et al., Adv. Funct. Mater., 2023, 2310539 CrossRef.
- S. Sharma, F. Ahmad, A. Singh and S. Rathaur, Comp. Biochem. Physiol., 2022, 258, 110683 CrossRef CAS PubMed.
- M. M. Bradford, Anal. Biochem., 1970, 72, 248–254 CrossRef.
- S. Sharma, F. Ahmad, A. Singh and S. Rathaur, Vet. Parasitol., 2021, 290, 109357 CrossRef CAS PubMed.
- T. R. Mosmann and R. L. Coffman, Annu. Rev. Immunol., 1989, 7, 145–173 CrossRef CAS PubMed.
- H. S. Choi, J. W. Kim, Y. N. Cha and C. A. Kim, J. Immunoassay Immunochem., 2006, 27, 31–44 CrossRef CAS PubMed.
- M. K. Singh, A. Kumar, D. C. Rai, A. Aggarwal and M. Malik, Int. J. Food Sci. Technol., 2023, 16655 CrossRef.
- W. Wang, G. Huang, H. Lin, L. Ren, L. Fu and X. Mao, Front. Oncol., 2023, 12, 1102392 CrossRef PubMed.
- H. Y. Lee, Y. J. Choi, E. J. Jung, H. Q. Yin, J. T. Kwon, J. E. Kim, H. T. Im, M. H. Cho, J. H. Kim, H. Y. Kim and B. H. Lee, J. Nanopart. Res., 2010, 12, 1567–1578 CrossRef CAS.
- S. Gates-Rector and T. Blanton, Powder Diffr., 2019, 34(4), 352–360 CrossRef CAS.
- R. Sathyavathi, M. B. Krishna, S. V. Rao, R. Saritha and D. N. Rao, Adv. Sci. Lett., 2010, 3, 138–143 CrossRef CAS.
- P. Magudapathy, P. Gangopadhyay, B. K. Panigrahi, K. G. M. Nair and S. Dhara, Phys. B, 2001, 299(1–2), 142–146 CrossRef CAS.
- P. Saini, S. K. Saha, P. Roy, P. Chowdhury and S. P. Sinha Babu, Exp. Parasitol., 2016, 160, 39–48 CrossRef CAS PubMed.
- W. Hartmann, N. Singh, S. Rathaur, Y. Brenz, E. Liebau, B. Fleischer and M. Breloer, Parasite Immunol., 2014, 36(4), 141–149 CrossRef CAS PubMed.
- S. Arumugam, J. Wei, Z. Liu, D. Abraham, A. Bell, M. E. Bottazzi, P. J. Hotez, B. Zhan, S. Lustigman and T. R. Klei, PLoS Neglected Trop. Dis., 2016, 10(4), e0004586 CrossRef PubMed.
- M. Lachén-Montes, N. Mendizuri, K. Ausín, A. Pérez-Mediavilla, M. Azkargorta, I. Iloro, F. H. Elortza Kondo, I. Ohigashi, I. Ferrer, R. de la Torre, P. Robledo, J. Fernández-Irigoyen and E. Santamaría, J. Proteome Res., 2020, 19(12), 4826–4843 CrossRef PubMed.
- H. Engqvist, T. Z. Parris, A. Kovács, S. Nemes, E. Werner Rönnerman, S. De Lara, J. Biermann, K. Sundfeldt, P. Karlsson and K. Helou, BMC Cancer, 2019, 19(1), 928 CrossRef PubMed.
- Annual Reports in Medicinal Chemistry, ed. S. Sainas, F. Dosio, D. Boschi, M. L. Lolli and M. Botta, Academic Press, 2018, vol. 51, pp. 1–38 Search PubMed.
|
| This journal is © The Royal Society of Chemistry 2024 |

 Open Access Article
 This Open Access Article is licensed under a Creative Commons Attribution-Non Commercial 3.0 Unported Licence
 *
*