 Open Access Article
Creative Commons Attribution 3.0 Unported Licence
Two new rare-earth oxyborates Ba4BiTbO(BO3)4 and Ba1.54Sr2.46BiTbO(BO3)4 and luminescence properties of the Ba4BiTb1−xEuxO(BO3)4 phosphors†
Xuean Chen *a,
Xuyang Yuana,
Weiqiang Xiaob and
Xiaoyan Song
 a
a
aFaculty of Materials and Manufacturing, Key Laboratory of Advanced Functional Materials, Ministry of Education of China, Beijing University of Technology, 100124, Beijing, China. E-mail: xueanchen@bjut.edu.cn
bBeijing Key Laboratory of Microstructure and Property of Solids, Beijing University of Technology, 100124, Beijing, China
First published on 19th February 2024
Abstract
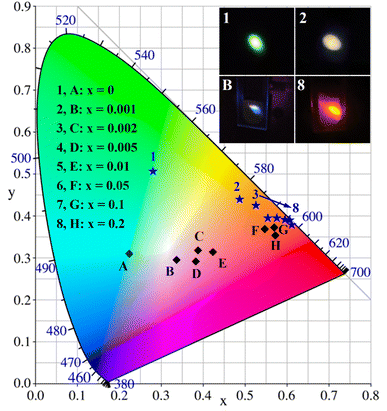
Single crystals of two new terbium oxyborates Ba4BiTbO(BO3)4 and Ba1.54Sr2.46BiTbO(BO3)4 were obtained by the high-temperature solution method. They crystallize in the hexagonal P63/mmc group (Z = 2) with lattice parameters of a = 5.41865(9) Å, c = 26.3535(5) Å, V = 670.12(3) Å3 and a = 5.36534(19) Å, c = 26.0661(10) Å, V = 649.83(5) Å3, respectively. Their crystal structures feature two kinds of layers: [Tb(BO3)2]n3n− formed by corner-sharing TbO6 octahedra and BO3 triangles, as well as [Bi(BO3)2O]n5n− consisting of Bi2O13 dimers and BO3 groups, with alkali-earth cations sitting inside and between the layers. In addition, solid solutions of Ba4BiTb1−xEuxO(BO3)4 (0 ≤ x ≤ 0.2) were prepared via the solid-state reaction method. The obtained products were characterized by powder XRD, SEM, IR/Raman, XPS, DRS, and luminescence spectroscopy. It was found that as the Eu3+ doped content varies from x = 0 to 0.2, the emission color of the Ba4BiTb1−xEuxO(BO3)4 phosphors can be adjusted from cyan to near-white and then to orange-red or from green to orange and then to red under the excitation of 349 and 377 nm, respectively. Furthermore, the emission intensities and chromaticity coordinates were found to be sensitive to the temperature for the phosphor Ba4BiTb0.999Eu0.001O(BO3)4 upon 377 nm excitation. The above results demonstrate that Ba4BiTb1−xEuxO(BO3)4 phosphors have potential as multifunctional materials for solid-state lighting and temperature sensing applications.
1. Introduction
Among solid-state lighting technology, white light-emitting diodes (w-LEDs) are excellent candidates to replace conventional incandescent lamps for their merits of high brightness, low energy consumption, long lifetime, small size, environmental-friendly nature, and so on.1,2 In the past years, cadmium chalcogenide quantum dots (QDs) have been proposed to be the promising alternatives to the phosphors in w-LEDs due to their tunable and narrow-band emission, high photoluminescence quantum yield (PLQY), and good stability.3 However, the cadmium chalcogenide QDs have some issues hindering their practical applications. For example, to achieve good stability and high PLQY, high reaction temperatures and delicate surface passivation (shelling) are often required. Lately, fully inorganic perovskite QDs, CsPbX3 (X = Cl, Br, I), have received rapidly growing attention as another option for further advancing w-LEDs.4 Different from chalcogenide QDs, perovskite QDs can be synthesized at much lower temperatures, and can easily achieve high PLQY without the need to grow passivation shells. Although different types of nanomaterials can be used for LEDs,5–7 to date, the most efficient and popular commercial w-LEDs are based on the combination of a blue-emitting InGaN or GaN chip with a yellow-emitting phosphor, i.e. Y3Al5O12:Ce3+ (YAG:Ce3+).8 However, the lack of red component in YAG-based w-LEDs results in a low color-rendering index (typically ≤80) and a high correlated color temperature (typically ≥4500 K), which in turn restricts their potential applicability in many fields, such as the general illumination or medical lighting.9 To solve this problem and obtain an ideal warm w-LEDs, an alternative strategy was proposed which is to employ red, green, and blue phosphors excited by ultraviolet (UV) or near-ultraviolet (n-UV) LED chips.10 This scheme is often prone to problems of complex mixing ratios and overlapping of energy levels among various phosphors.11 Besides, different attenuation situations of each phosphor will result in an unstable white light.12 Therefore, it has also been proposed to manufacture w-LEDs by coating single-phase white-light-emitting phosphors on UV/n-UV LED chips, which has always been a research hotspot in solid-state lighting.Among the trivalent rare-earth ions, Tb3+ and Eu3+ are the most frequently used activators in luminescent materials that can produce green or red light under n-UV excitation due to the characteristic transitions of Tb3+:5D4 → 7FJ (J = 6, 5, 4, 3) or Eu3+:5D0 → 7FJ (J = 0, 1, 2, 3, 4).13–16 When Tb3+ and Eu3+ ions are co-doped into one host matrix, multi-color emission may occur owing to the efficient energy transfer from Tb3+ to Eu3+, the representative examples including KBaY(MoO4)3:Ln3+ (Ln3+ = Tb3+, Eu3+, Sm3+, Tb3+/Eu3+, Tb3+/Sm3+), Sr3Y(BO3)3:Tb3+, Eu3+, Sr8ZnY(PO4)7:Tb3+, Eu3+ and K2Tb1−xEuxHf(PO4)3.17–20 Once Tb3+ and Eu3+ ions are further combined with blue-emitting activators, such as Ce3+ or Eu2+, white light emission can be obtained, like the cases of BaY2Si3O10:Ce3+, Tb3+, Eu3+, MgY4Si3O13:Ce3+, Tb3+, Eu3+, Sr1.5Ca0.5SiO4:Eu3+, Tb3+, Eu2+ and Gd2O2S:Eu3+, Tb3+, Eu2+.21–24
The most common blue phosphors are usually produced by doping Ce3+ or Eu2+ into a host material.25–27 The syntheses of these phosphors require a reducing atmosphere, as the rare-earth ions Ce3+ and Eu2+ are in their lower valence states. As everyone knows, Bi3+ ion is a representative non-rare-earth activator with 6s2 electronic configuration, which can exhibit blue emission generated by the parity-allowed 6s2–6s6p inter-configurational transitions.28 Bi3+ has low toxicity and is stable in the air, and its synthesis condition is relatively mild compared to Ce3+ and Eu2+. Consequently, Bi3+ can also be used as a blue-emitting center to combine with Tb3+ and Eu3+ ions to obtain single-composition white phosphors, and some reported examples include β-GdB3O6:Bi3+, Tb3+, Eu3+, Ca3ZrSi2O9:Bi3+, Tb3+, Eu3+, Gd2MoB2O9:Bi3+, Tb3+, Eu3+ and NaYGeO4:Bi3+/Tb3+/Eu3+.29–32 However, doping with three ions such as Bi3+, Tb3+, and Eu3+ can lead to complicated energy transfer, so tuning to accurate white color remains still a challenge.
In the previous study, we systematically investigated the BaO–Bi2O3–PbO–Eu2O3–B2O3 system and discovered a new borate Ba3BiPbEuO(BO3)4.33 On this basis, we synthesized a series of Ba3BiPbY1−xEuxO(BO3)4 (0 ≤ x ≤ 1) solid solutions and studied their luminescence properties. However, there have been no reports of doping Tb3+ activators in this host to obtain white or color-adjustable phosphors, and of course, temperature sensing properties of this type of phosphor have also not been investigated so far. Because Pb belongs to a toxic element that limits the practical application of this phosphor in w-LEDs. Our attempt to replace Pb2+ with iso-valent Ba2+ and Sr2+ ions led to the characterization of two new rare-earth oxyborates, Ba4BiTbO(BO3)4 and Ba1.54Sr2.46BiTbO(BO3)4. In this work, we first introduced the syntheses and crystal structures of these two new phases, and then, described the luminescence performance, energy transfer process, and temperature sensing behavior of Ba4BiTb1−xEuxO(BO3)4 (0 ≤ x ≤ 0.2) fluorescent powders. It was found that the syntheses of this series of new borates can be carried out at a relatively low temperature without the need for a reducing atmosphere. Besides, the white light and color-tunable emission from green to red can be realized in Ba4BiTb1−xEuxO(BO3)4 by simply changing the concentrations ratio of Tb3+/Eu3+ and selecting appropriate excitation irradiation. Additionally, a strong temperature sensitization phenomenon was found for this phosphor under 377 nm excitation, suggesting that Ba4BiTb1−xEuxO(BO3)4 is a kind of luminescent material with potential application value in the field of w-LEDs and temperature sensors.
Note that Ba4BiTbO(BO3)4 and Ba1.54Sr2.46BiTbO(BO3)4 are the first quaternary (quinary) borate found in the BaO (and SrO)–Bi2O3–Tb2O3–B2O3 system, and also, the luminescence properties of Ba4BiTb1−xEuxO(BO3)4 (0 ≤ x ≤ 0.2) are presented here for the first time. This study also reveals that Ba4BiLnO(BO3)4 (Ln = trivalent rare-earth ions) forms a large family of compounds, in which Ba2+ can be partially replaced by other divalent cations, such as Pb2+ and Sr2+. We believe that this work will enrich the structural chemistry of borates and help the development of new emission-tunable phosphors for w-LED applications and highly efficient luminescent thermometers for temperature-sensing applications.
2. Experimental section
2.1. Materials and methods
All chemicals for the synthesis were purchased from Sinopharm Chemical Reagent Co. Ltd, including BaCO3 (A.R.), SrCO3 (A.R.), Bi2O3 (A.R.), Y2O3 (99.99%), Tb4O7 (99.99%), Eu2O3 (99.99%) and H3BO3 (A.R.). Powder X-ray diffraction (XRD) measurements were conducted on a Bruker D8 ADVANCE diffractometer, which operated at 40 kV and 40 mA with Cu Kα radiation (λ = 1.5406 Å). Scanning electron microscope (SEM) images were taken using a Hitachi SU8020 instrument (accelerating voltage 20 kV) equipped with an energy-dispersive X-ray detector (EDX). Infrared (IR) spectra were obtained with a VERTEX 70 Fourier Transform Infrared Spectrometer (Bruker). Raman spectroscopy data were recorded on the powder sample by a Renishaw InVia Raman spectrometer, which has a spectral resolution of 1 cm−1 and is equipped with a confocal DM 2500 Leica optical microscope (with a 50× objective) and a 785 nm diode laser. Diffuse Reflectance Spectra (DRS) were measured with a Hitachi UH4150 UV-visible/NIR spectrophotometer, scanning at 120 nm min−1. The elemental valence states were analyzed via X-ray Photoelectron Spectroscopy (XPS) on a Thermo Scientific ESCALAB 250Xi spectrometer with monochromatized Al Kα radiation (hν = 1486.6 eV). Photoluminescence excitation (PLE) and emission (PL) spectra as well as luminescence decay curves were collected via the Edinburgh FLS 1000 fluorescence spectrometer. A 150 W Xe lamp and a 60 W μF flash lamp were used as the excitation source for the steady-state spectrum and decay curve measurements, respectively. Quantum yield (QY) and variable temperature PL spectra were measured by employing a barium sulfate-coated integrating sphere (150 mm in diameter) and a temperature controller (Oxford, OptistatDN2) attached to the FLS 1000 system, respectively.2.2. Synthetic procedures
Single crystals of the title compounds were grown via the high-temperature solution method. Typically, a mixture of 0.2894 g BaCO3, 0.9112 g Bi2O3, 0.1828 g Tb4O7 and 0.0907 g H3BO3 (the molar ratio of 6![[thin space (1/6-em)]](https://www.rsc.org/images/entities/char_2009.gif) :
:![[thin space (1/6-em)]](https://www.rsc.org/images/entities/char_2009.gif) 8
8![[thin space (1/6-em)]](https://www.rsc.org/images/entities/char_2009.gif) :
:![[thin space (1/6-em)]](https://www.rsc.org/images/entities/char_2009.gif) 1
1![[thin space (1/6-em)]](https://www.rsc.org/images/entities/char_2009.gif) :
:![[thin space (1/6-em)]](https://www.rsc.org/images/entities/char_2009.gif) 6) for Ba4BiTbO(BO3)4, and a mixture of 0.3879 g BaCO3, 0.2031 g SrCO3, 0.6411 g Bi2O3, 0.0735 g Tb4O7 and 0.1945 g H3BO3 (the molar ratio of 20
6) for Ba4BiTbO(BO3)4, and a mixture of 0.3879 g BaCO3, 0.2031 g SrCO3, 0.6411 g Bi2O3, 0.0735 g Tb4O7 and 0.1945 g H3BO3 (the molar ratio of 20![[thin space (1/6-em)]](https://www.rsc.org/images/entities/char_2009.gif) :
:![[thin space (1/6-em)]](https://www.rsc.org/images/entities/char_2009.gif) 14
14![[thin space (1/6-em)]](https://www.rsc.org/images/entities/char_2009.gif) :
:![[thin space (1/6-em)]](https://www.rsc.org/images/entities/char_2009.gif) 14
14![[thin space (1/6-em)]](https://www.rsc.org/images/entities/char_2009.gif) :
:![[thin space (1/6-em)]](https://www.rsc.org/images/entities/char_2009.gif) 1
1![[thin space (1/6-em)]](https://www.rsc.org/images/entities/char_2009.gif) :
:![[thin space (1/6-em)]](https://www.rsc.org/images/entities/char_2009.gif) 32) for Ba1.54Sr2.46BiTbO(BO3)4 were transferred to Pt crucibles after thorough grinding, respectively. In the furnace, these mixtures were gradually heated to 950 °C, where they were kept for 6 h, then cooled to 700 °C at a rate of 1.5 °C h−1, and further to 400 °C at 5 °C h−1, followed by cooling to room temperature at 20 °C h−1. The colorless transparent crystals of the title compounds were observed, which showed a hexagonal plate-like habit with various sizes ranging from 0.1 to 1.0 mm in diameter and several tenths of a millimeter in thickness. They were mechanically isolated from the solidified melt and further examined through SEM-EDX analyses, which confirmed the existence of heavy elements of Ba, Bi, Tb, and O (Ba, Sr, Bi, Tb, and O) (B is too light to be detected, see Fig. S1 and S2†).
32) for Ba1.54Sr2.46BiTbO(BO3)4 were transferred to Pt crucibles after thorough grinding, respectively. In the furnace, these mixtures were gradually heated to 950 °C, where they were kept for 6 h, then cooled to 700 °C at a rate of 1.5 °C h−1, and further to 400 °C at 5 °C h−1, followed by cooling to room temperature at 20 °C h−1. The colorless transparent crystals of the title compounds were observed, which showed a hexagonal plate-like habit with various sizes ranging from 0.1 to 1.0 mm in diameter and several tenths of a millimeter in thickness. They were mechanically isolated from the solidified melt and further examined through SEM-EDX analyses, which confirmed the existence of heavy elements of Ba, Bi, Tb, and O (Ba, Sr, Bi, Tb, and O) (B is too light to be detected, see Fig. S1 and S2†).
Polycrystalline samples of Ba4BiYO(BO3)4 and Ba4BiTb1−xEuxO(BO3)4 (x = 0, 0.001, 0.002, 0.005, 0.01, 0.05, 0.1, 0.2, and 1) were prepared by the traditional solid-state reaction method. The required metal carbonates or oxides and boric acid were weighted in stoichiometric ratio and thoroughly mixed and ground in an agate mortar for 30 min. Subsequently, they were transferred into alumina crucibles and preheated at 500 °C for 12 h to remove CO2 and H2O. Then further sintering at 830 °C for 96 h with multiple intermittent grinding was implemented to ensure the complete chemical reaction. Finally, the obtained products were naturally cooled to room temperature and ground again for further characterization.
2.3. Single-crystal X-ray diffraction
Single-crystal XRD data of two crystals were collected at room temperature on a SuperNova (Mo) X-ray source (λ = 0.71073 Å). Data reduction, cell refinements, and analytical absorption corrections were accomplished using CrysAlisPro software.34 The structures were solved by direct methods and refined with anisotropic displacement parameters for all atoms by full-matrix least-squares fitting on F2 using SHELX-2019.35For Ba4BiTbO(BO3)4, the site-occupancy refinements indicated that there is an atomic site (Wyckoff 4e position) that was co-occupied by Ba and Bi atoms. In the initial refinement, Ba2+ and Bi3+ cations were placed at the same 4e site, with their atomic coordinates and anisotropic displacement parameters being constrained to be identical. After convergence of the refinement, rather large displacement parameters were obtained for this (Ba/Bi) site, suggesting additional positional disorder. Eventually, a significant improvement in the refinement was achieved after splitting the (Ba/Bi) into two close positions. A similar situation was found in Ba1.54Sr2.46BiTbO(BO3)4, except that (Ba/Bi) was replaced by (Sr/Bi). The structures were checked with the program MISSYM, and no obvious additional crystallographic symmetry was detected.36 General crystallographic information is presented in Table 1. Atomic coordinates, site occupancies, and equivalent isotropic displacement parameters, as well as selected bond lengths and angles, are provided in Tables S1–S3.†
| a R1 = Σ||F0| − |Fc||/Σ|F0| and wR2 = [Σw(F02 − Fc2)2/ΣwF04]1/2 for F02 > 2σ(F02). | ||
|---|---|---|
| Formula | Ba4BiTbO(BO3)4 | Ba1.54(7)Sr2.46(7)BiTbO(BO3)4 |
| Formula weight | 1168.50 | 1046.19 |
| Crystal size (mm3) | 0.25 × 0.20 × 0.05 | 0.25 × 0.25 × 0.15 |
| Space group | P63/mmc (no. 194) | P63/mmc (no. 194) |
| a (Å) | 5.41865(9) | 5.36534(19) |
| c (Å) | 26.3535(5) | 26.0661(10) |
| V (Å3) | 670.12(3) | 649.83(5) |
| Z | 2 | 2 |
| dcalc (g cm−3) | 5.791 | 5.347 |
| μ (mm−1) | 29.920 | 33.542 |
| 2θmax (°) | 70 | 66 |
| Unique reflections | 636 | 536 |
| Observed [I ≥ 2σ(I)] | 576 | 491 |
| No. of variables | 35 | 37 |
| GOF on F02 | 1.128 | 1.066 |
| R1/wR2 [I ≥ 2σ(I)] | 0.0417/0.0964 | 0.0604/0.1077 |
| R1/wR2 (all data) | 0.0464/0.0988 | 0.0645/0.1094 |
3. Results and discussion
3.1. Crystal structure description
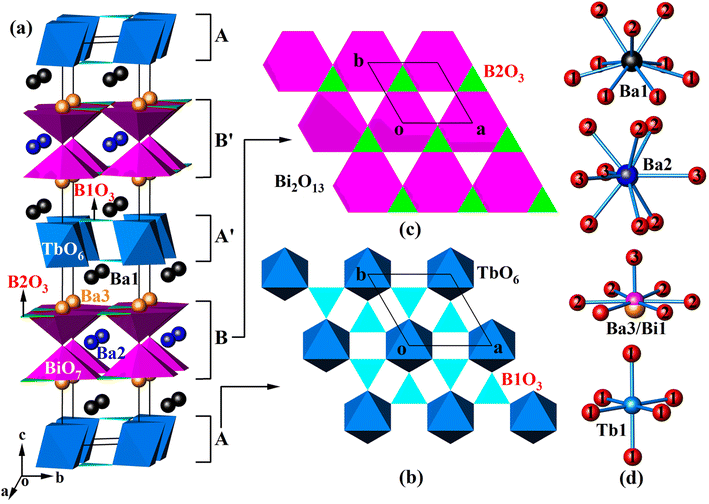
Since Ba4BiTbO(BO3)4 and Ba1.54Sr2.46BiTbO(BO3)4 are isostructural, we chose Ba4BiTbO(BO3)4 to describe the crystal structure. The fundamental building blocks in this structure are TbO6 octahedra, BO3 triangles, and Bi2O13 dimers composed of two corner-sharing BiO7 hexagonal pyramids, as shown in Fig. 1(a). Within the ab plane, TbO6 octahedra are arranged hexagonally and further bridged by B1-centered BO3 groups via common O atoms to form a 2D infinite sheet of [Tb(BO3)2]n3n− [layer A, see Fig. 1(b)]. There is another type of 2D sheet that has a composition [Bi(BO3)2O]n5n− [layer B, see Fig. 1(c)]. This layer is constructed by corner-sharing Bi2O13 dimers, with a pair of boron atoms (two B2) accommodated within one-half of the three-membered rings of the layer. Four sheets, ABA′B′, are required to complete a translation period of the c-axis direction, where the sheets A′ and B′ are related to A and B by a 63-screw axis. Some alkali-earth cations (Ba1 and Ba3) fill the space between the layers, while others (Ba2) reside in the channels that pass through the layers B and B′ to provide charge compensation.As shown in Table S1,† there are nine unique atomic sites in the asymmetric unit of Ba4BiTbO(BO3)4, including 2Ba, 1(Ba/Bi), 1Tb, 2B, and 3O, all located in crystallographically special positions. Two distinct Ba atoms are both nine-coordinated, but adopt different coordination configurations: Ba1 in an irregular polyhedron and Ba2 in a tri-capped trigonal prism [Fig. 1(d)]. The Ba–O distances are normal, as shown in Table S2.† Concerning the disordered (Ba/Bi) site, it is found that Ba and Bi atoms are statistically distributed over two very close positions [Ba3–Bi1 = 0.320(3) Å]. Each is strongly bonded to one oxygen and also weakly bonded to six other O atoms to form a hexagonal pyramid, as shown in Fig. 1(d), which reflects the fact that the 6s2 non-bonded electron pairs of Bi3+ are stereochemically active. The Tb atom occupies the Wyckoff 2a position with local D3d symmetry. It is surrounded by six oxygen atoms in an octahedral environment with six equal Tb–O bond distances of 2.255(6) Å, which are very close to those reported in K3TbB6O12 [2.229(4) Å–2.348(5)].37 Two B atoms are each connected to three oxygen atoms, forming a BO3 planar triangle with bond lengths in the range of 1.372(6)–1.379(7) Å, and the bond angles deviated slightly from 120°. These are common values as found in other known borates.33,38 The calculated total bond valences for Ba1, Ba2, Tb, B1, and B2 are 2.049, 2.052, 3.282, 2.991, and 2.937, respectively, consistent with their expected oxidation states.39
Although the title compounds are isostructural with our previously reported Pb2+-analog, Ba3BiPbEuO(BO3)4, their crystal structures show a certain difference.33 For example, in Ba3BiPbEuO(BO3)4, both Pb2+ and Bi3+ cations are located at the same 4e site with identical positional and thermal parameters, while in Ba4BiTbO(BO3)4 [Ba1.54Sr2.46BiTbO(BO3)4], this site is split into two very close positions, occupied by Ba2+ and Bi3+ (Sr2+ and Bi3+), respectively. This is understandable because both Pb2+ and Bi3+ have a 6s2 electron configuration and, of course, a similar coordination environment, while the ionic radii and coordination geometries around Ba2+ and Bi3+ as well as Sr2+ and Bi3+ are very different. Inspection of structural details (Tables S1–S3†) reveals that when Sr2+ partially replaces Ba2+ in Ba4BiTbO(BO3)4 to form Ba1.54Sr2.46BiTbO(BO3)4, the Ba1 and Ba2 sites are mixed with some Sr atoms, with the refined compositions Ba0.58(2)Sr0.42(2) and Ba0.38(3)Sr0.62(3), respectively. The Ba3/Bi1 site is still statistically distributed, but Ba3 is completely replaced by Sr3. Given identical coordinated numbers, (Ba/Sr)–O distances are significantly smaller than the corresponding Ba–O ones as expected. In addition, there is also a remarkable reduction in cell axis lengths and volume due to the smaller size of Sr2+ compared with Ba2+ (Table 1). What's more, this work also indicates that Ba4BiLnO(BO3)4 (Ln = trivalent rare-earth ions) forms a large class of compounds, where Ba2+ can be partially substituted by other divalent ions, like Pb2+ and Sr2+.
3.2. Phase purity and morphology
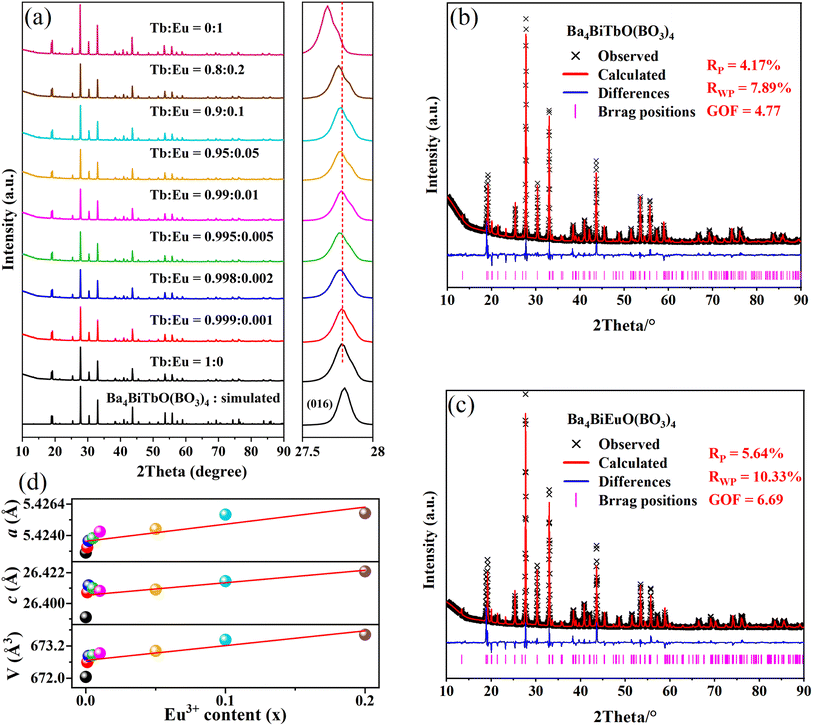
A series of Ba4BiTb1−xEuxO(BO3)4 (0 ≤ x ≤ 1) samples were prepared and their crystallinity and phase purity were assessed by powder XRD, as shown in Fig. 2(a). For comparison, the simulated pattern of Ba4BiTbO(BO3)4 based on its single-crystal structure is provided at the bottom of the figure. All observed XRD patterns are similar to each other and also consistent with the simulated pattern of the fully Tb3+ sample, showing that the introduction of Eu3+ into this host still maintains single-phase and does not cause significant changes in the crystal structure. Another noteworthy feature is that the enlarged diffraction peaks from 2θ = 27.5°–28.0° of the Ba4BiTb1−xEuxO(BO3)4 samples, belonging to the representative (016) crystal face, slightly shift towards lower angles relative to the position of Ba4BiTbO(BO3)4 with increasing x. Since the effective ionic radius of Eu3+ (r = 0.947 Å, CN = 6) is larger than that of Tb3+ (r = 0.923 Å, CN = 6), but smaller than that of Bi3+ (r = 1.07 Å, CN = 7),40,41 such a shift implies that Eu3+ ions prefer to substitute Tb3+ instead of Bi3+ sites in the Ba4BiTbO(BO3)4 host. This is understandable because the coordination configuration around Eu3+ and Tb3+ is very similar and relatively regular, while that around Bi3+ is severely distorted due to the steric effect of 6s2 lone pair electrons [see Fig. 1(d)].To further recognize the effect of doping Eu3+ ions on the crystal structures of Ba4BiTb1−xEuxO(BO3)4, Rietveld refinements were conducted on the powder XRD profiles of Ba4BiTb1−xEuxO(BO3)4 (x = 0, 0.001, 0.002, 0.005, 0.01, 0.05, 0.1, 0.2, and 1) using TOPAS Academic software.42 The initial model used for the Rietveld refinements was the single-crystal structure of Ba4BiTbO(BO3)4 (Tables 1 and S1†). The constraint condition is that atomic coordinates of B and O, all atomic occupancies, and isotropic displacement parameters were fixed, while the positional parameters of heavy atomic sites [including z(Ba1), z(Ba3), and z(Bi1)] and lattice constants (a and c) were refined along with other parameters. The final refinement results are presented in detail in Table S4† as well as Fig. 2(b), (c) and S3.† As representatives, the lattice parameters of the species for 0 ≤ x ≤ 0.2 are plotted against the substitution level x in Fig. 2(d). The refinements proceeded smoothly and the residual factors Rwp are all less than 10.4%, which further confirmed that this series of solid solutions are isomorphic and crystallize in the hexagonal system with space group P63/mmc. In addition, the cell parameters (a, c, and V) show an obvious linear expansion along with the increase in Eu3+ concentration. These results conform to Vegard's rule, indicating that Eu3+ ions are completely dissolved in the Ba4BiTbO(BO3)4 host to form perfect solid solutions of Ba4BiTb1−xEuxO(BO3)4.
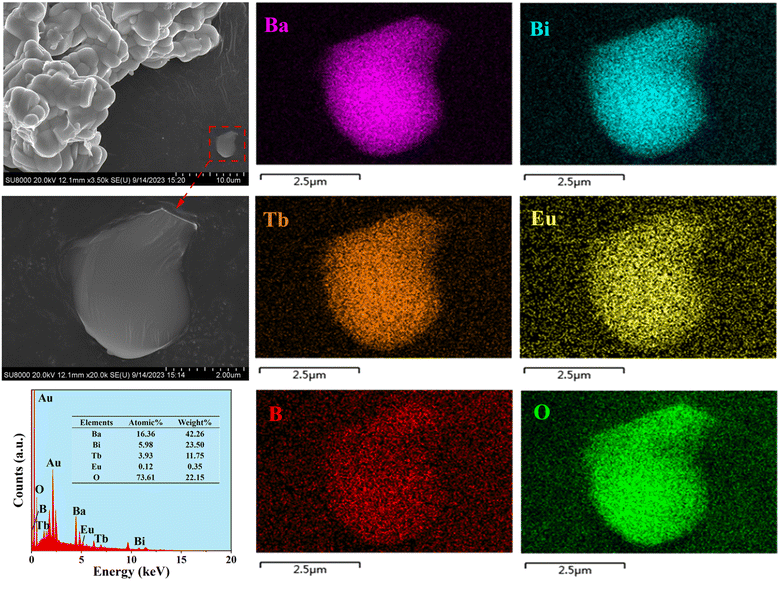
Because particle size and surface roughness are important factors influencing the luminescence performance of fluorescent powders, FE-SEM and EDX analyses were conducted to investigate the morphological characteristics of the obtained powder samples. Fig. 3 displays the FE-SEM images, EDX spectrum, and elemental mapping of the prepared Ba4BiTb0.999Eu0.001O(BO3)4 phosphor. It can be seen that the particles are aggregated together and have good crystallinity with smooth surface and irregular morphology, and the particle size is in the range of several micrometers. This may be due to the sample being obtained through a solid-state reaction route of intermediate grinding. The EDX pattern confirms the presence of the dominant elements Ba, Bi, Tb, Eu, B, and O, all homogeneously distributed over the same selection region of the sample, as demonstrated in the elemental mapping images. This indicates that the target solid solution has been successfully synthesized (note that the boron content cannot be accurately measured due to its low atomic weight, while the gold signal comes from the gold sputtering process).
3.3. IR and Raman spectra
Although single crystal XRD analyses indicated the presence of BO3 groups in the title compounds, IR and Raman spectroscopy were still studied to further confirm the coordination environment of B atoms. Ba4BiLnO(BO3)4 (Ln = trivalent rare-earth ions) crystallizes in the centrosymmetric P63/mmc (D6h4, No. 194) group (Z = 2). Based on group theoretical analysis,33,43 138 Brillouin zone center modes are predicted, which have the mechanical representation: Γvibr = 8A1g + 2A1u + 2A2g + 11A2u + 10B1g + 2B1u + 2B2g + 9B2u + 11E2u + 12E2g + 13E1u + 10E1g, where the E mode is doubly degenerate and usually observed as one frequency. These modes can be further subdivided into 2E2u + 2E2g + 2E1u + 2E1g asymmetric stretching (ν3), 2A1g + 2A2u + 2B1g + 2B2u symmetric stretching (ν1), 2A1g + 2A2u + 2B1g + 2B2u out-of-plane bending (ν2), 2E2u + 2E2g + 2E1u + 2E1g in-plane bending (ν4), 2A1g + 2A2u + 2B1g + 2B2u + 2E2u + 2E2g + 2E1u + 2E1g translational and 2A1u + 2A2g + 2B1u + 2B2g + 2E2u + 2E2g + 2E1u + 2E1g librational modes of the BO3 groups. The remaining modes correspond to translations of the Ba1 (A1g + A2u + B1g + B2u + E2u + E2g + E1u + E1g), Ba2 (A2u + B1g + E2g + E1u), (Ba3/Bi1) (A1g + A2u + B1g + B2u + E2u + E2g + E1u + E1g), Tb1 (A2u + B2u + E2u + E1u) and O3 (A2u + B1g + E2g + E1u) sites. It should be remembered that three vibrational modes (A2u + E1u) belong to the acoustic branch, therefore the total number of optical modes in the crystal is 135 (Γoptic = 8A1g + 2A1u + 2A2g + 10A2u + 10B1g + 2B1u + 2B2g + 9B2u + 11E2u + 12E2g + 12E1u + 10 E1g). Since A1u, A2g, B1g, B1u, B2g, B2u, and E2u modes are silent, there are a total of 86 optical modes distributed into 52 Raman-active (ΓR = 8A1g + 12E2g + 10E1g) and 34 IR-active (ΓIR = 10A2u + 12E1u) modes, leading to 30 Raman and 22 IR frequencies, respectively. It is difficult to accurately assign the individual bands to specific vibrational modes, as some modes have very similar wavenumbers, but a rough assignment of groups for both IR and Raman spectra is possible.Fig. S4† presents the polycrystalline IR and Raman spectra measured in the internal mode region for Ba4BiLnO(BO3)4 (Ln = Y, Tb and Eu). Three compounds show similar spectral profiles, illustrating that they are isostructural to each other, and the introduction of different rare-earth ions does not affect the fundamental vibrational modes of the main structural units. Both IR and Raman spectra above 550 cm−1 can be divided into four regions, of which the area of 1100–1400 cm−1 shows the asymmetric stretching vibrations (ν3) of the BO3 groups. The absorption bands between 850 and 980 cm−1 can be assigned as the BO3 symmetric stretching vibrations (ν1). The absorption caused by the out-of-plane bending (ν2) of the trigonal group appears as bands in the range of 700–800 cm−1. The remaining bands from 550 to 680 cm−1 are the result of the in-plane BO3 bending (ν4). These assignments are consistent with those of other reported borates.44–46 As everyone knows, for the ideal BO3 group with D3h symmetry, the modes ν1(A1′) and ν2(A2′′) should be IR and Raman inactive, respectively.43 The appearance of vibrations ν1(2A2u) in the IR and ν2(2A1g) in the Raman spectra indicates that the BO3 groups in Ba4BiLnO(BO3)4 deviate from the ideal symmetry. In fact, our structural analysis reveals that there are two crystallographically independent B atoms, both of which occupy the 4f position with local symmetry C3v instead of D3h (see Table S1†).
3.4. XPS spectra
To get an idea of the valence states of the constituent elements in the system, we conducted XPS studies on the phosphor Ba4BiTb0.999Eu0.001O(BO3)4 over a wide energy range, as shown in Fig. S5(a).† The XPS survey scan shows the respective photoemission peaks caused by the constituent elements (Ba, Bi, Tb, Eu, B, and O) and the Auger peaks of Ba and O (Ba MNN & O KLL). The appearance of the C 1s signal is due to the absorption of adventitious hydrocarbons on the sample surface during the sample handling for XPS measurements. The chemical composition and bonding information were further probed utilizing the detailed, high-resolution core-level XPS scans of Ba 3d, Bi 4f, Tb 3d, Eu 3d, B 1s, and O 1s, as illustrated in Fig. S5(b)–(g).† The Ba 3d can be deconvoluted into two spin-orbital splitting components, Ba 3d3/2 and Ba 3d5/2, located at the binding energies (BEs) of 795.48 and 780.25 eV, respectively.47 The XPS spectrum related to Bi 4f consists of two intense and symmetrical peaks observed at 164.47 (Bi 4f5/2) and 159.25 (Bi 4f7/2) eV with an energy difference of ∼5.22 eV.48 The Tb 3d XPS peaks also exhibit doublet characteristics, which are assigned to Tb 3d3/2 (∼1278.86 eV) and Tb 3d5/2 (∼1244.18 eV), separated by 34.68 eV.49 These BE values can be used as fingerprints to identify the presence of Ba2+, Bi3+, and Tb3+, respectively. In Fig. S5(e),† due to the very low Eu3+ content in the synthesized sample, the Eu 3d XPS signal is relatively weak, but it can be resolved into two components, corresponding to Eu 3d3/2 (∼1168.40 eV) and 3d5/2 (∼1138.02 eV), similar to previous results of other Eu3+-based materials.33,50 For the B 1s and O 1s spectra, they can be fitted to symmetric single peaks with BEs of 191.32 and 531.60 eV, respectively, which are typical values related to B–O or O–cation bonding states in borates.51–53 In addition, no other impurity peaks (including those from Eu2+ and Tb4+ ions) were identified from the XPS spectra. These results in combination with XRD and EDX data ensure the successful preparation of Ba4BiTb1−xEuxO(BO3)4 phosphors, which provides a solid basis for subsequent investigations of optical absorption and PL properties.3.5. UV-vis diffuse reflection spectra
To investigate the optical absorption properties, the UV-vis diffuse reflection spectra of Ba4BiLnO(BO3)4 (Ln = Y, Tb, and Eu) were measured, as shown in Fig. S6.† All samples show a very high reflectance between 90 and 100% relative to the white standard BaSO4 (optical grade) in the visible region, indicating a high optical grade of the as-prepared compounds. Below 400 nm, there is an intense broad absorption band, which is due to the collective effect of the 1S0 → 1P1/3P1 transition of Bi3+ and the host lattice absorption.28 For the Tb and Eu compounds, the Tb3+:4f8 → 4f75d1 absorption and O2− → Eu3+ charge transfer absorption are also located in this area, respectively. Moreover, several sharp characteristic absorption peaks at about 393, 466, 527, 535 and 592 nm are assigned to 7F0 → 5L6, 7F0 → 5D2, 7F0 → 5D1, 7F1 → 5D1 and 7F1 → 5D0 transitions of Eu3+, respectively, while the peak at 486 nm is ascribed to the 7F6 → 5D4 transition of Tb3+.54The optical band gap of Ba4BiLnO(BO3)4 can be estimated by the following formula:55
| [F(R∞)hν]n = A(hν − Eg) | (1) |
| F(R∞) = (1 − R)2/2R = K/S | (2) |
3.6. PLE and PL spectra
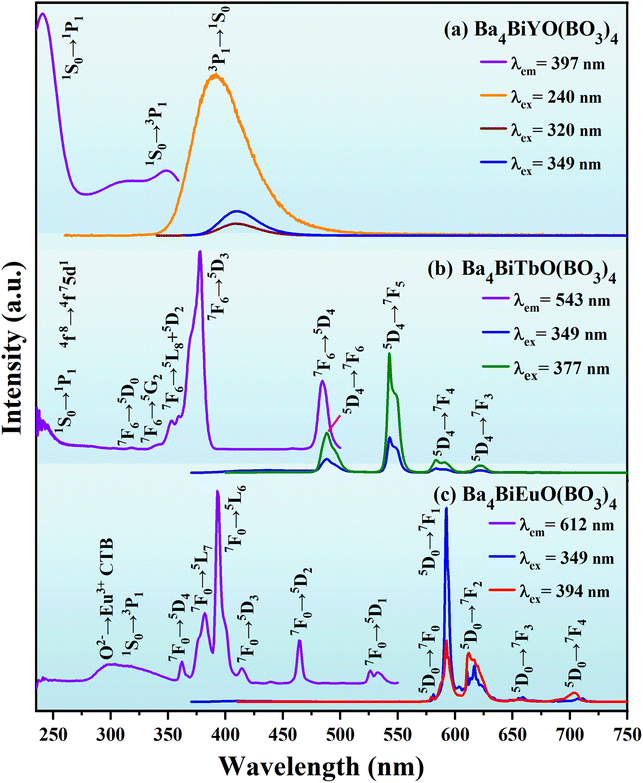
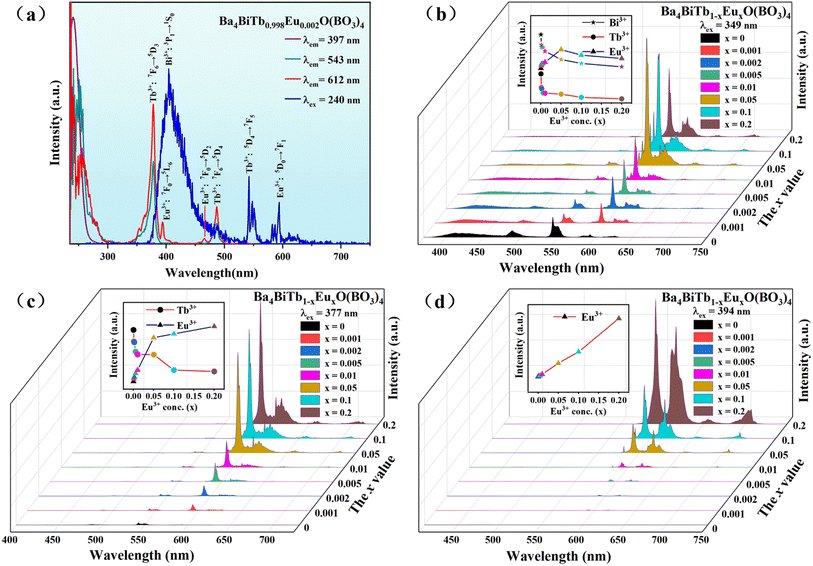
As is known to all, Bi3+ possesses 6s2 lone pair electrons, therefore, the position of its excitation and emission bands depends largely on the nature of the host lattice. The ground state of Bi3+ is 1S0 and its excited states are composed of 3P0, 3P1, 3P2, and 1P1 in order of increasing energy. For the electron transition of Bi3+, 1S0 → 1P1 is parity- and spin-allowed, but it is usually located in the deep ultraviolet region (typically ≤250 nm), so it is difficult to use in LED devices. 1S0 → 3P2 is spin-forbidden and the luminous intensity is low. 1S0 → 3P0 is strictly forbidden because the total angular momentum does not change (ΔJ = 0). In contrast, 1S0 → 3P1 has the longest luminous wavelength and can even enter the n-UV region (around 350–420 nm). Although it is forbidden according to the spin-selection rule, it will become partially allowed by mixing with singlet and triplet states (ΔJ = 1).57The luminescent properties of the title compounds were characterized by the photoluminescence excitation (PLE) and emission (PL) spectra. As depicted in Fig. 4(a), the PLE spectrum of Ba4BiYO(BO3)4 (λem = 397 nm) shows three broad excitation bands, attributing to the 1S0 → 1P1 transition of Bi3+ (240 nm), and 1S0 → 3P1 transitions of Bi3+ (I) (320 nm) and Bi3+ (II) (349 nm), respectively,58–61 which are related to the crystal structure where the disordered (Ba/Bi) site is split into two positions (Table S1†). Upon 240 nm excitation, the PL spectrum presents an asymmetric emission band extending from 340 to 530 nm with the maximum at about 397 nm, which is ascribed to the 3P1 → 1S0 transition of Bi3+.58–61 The profiles of the emission spectra under 320 and 349 nm excitation are similar to those under 240 nm excitation, except that the emission intensities are much lower.
Fig. 4(b) shows the luminescence spectra of Ba4BiTbO(BO3)4. The PLE spectrum monitored at 543 nm comprises two parts: the absorption band from 230 to 275 nm (centered at ∼236 nm) corresponding to the 4f8 → 4f75d1 transition of Tb3+ overlapped with the 1S0 → 1P1 transition of Bi3+, and the other from 275 to 500 nm mainly associated with the intra-configurational 4f8 → 4f8 transitions of Tb3+ from 7F6 levels to 5D0 (318 nm), 5G2 (342 nm), 5L8 (353 nm), 5D2 (360 nm), 5D3 (377 nm) and 5D4 (485 nm) levels.54,62 The PL spectrum excited at 377 nm exhibits four groups of emission peaks in the region from 450 to 650 nm, of which the strongest at 543 nm is due to the 5D4 → 7F5 transition, while others at 488, 584, and 621 nm belong to the 5D4 → 7F6, 5D4 → 7F4, and 5D4 → 7F3 transitions, respectively.54,62 The spectrum clearly shows strong 5D4 emission, and no significant 5D3 emission was observed due to efficient cross-relaxation processes [5D3(Tb3+) + 7F6(Tb3+) → 5D4(Tb3+) + 7F0(Tb3+)] as expected for a fully concentrated Tb3+ material.63 In addition, the PL spectrum under 349 nm excitation (Bi3+ absorption) includes intense Tb3+ emission together with weak Bi3+ emission, suggesting the occurrence of Bi3+ to Tb3+ energy transfer in Ba4BiTbO(BO3)4.
Fig. 4(c) presents the luminescence spectra of Ba4BiEuO(BO3)4. When monitoring 612 nm emission, the PLE spectrum consists of one broad absorption band in the region of 280–357 nm (centered at ∼299 nm) and several sharp excitation peaks in the longer wavelength region. The wide band is the typical absorption of O2− → Eu3+ charge transfer superimposed with the 1S0 → 3P1 transition of Bi3+, while the sharp peaks at 362, 382, 394, 414, 465, and 526 nm are attributed to 7F0 → 5D4, 5L7, 5L6, 5D3, 5D2 and 5D1 transitions of Eu3+, respectively.54,62 Upon 394 nm excitation, the PL spectrum shows a series of sharp emission peaks within 570–710 nm. These peaks located at 580, 593, 612, 656, and 704 nm are readily assigned to 5D0 → 7FJ (J = 0–4) transitions of Eu3+, respectively. When excited at 349 nm (Bi3+ absorption), besides the very small residual emission of Bi3+, the strong characteristic emission peaks of Eu3+ can also be observed, which means an efficient energy transfer from Bi3+ to Eu3+. The comparison of the PLE spectrum for Ba4BiLnO(BO3)4 (Ln = Tb and Eu) and PL spectrum for Ba4BiYO(BO3)4 reveals a significant spectral overlap between the emission band of Bi3+ and the f–f absorption of Tb3+ and Eu3+ in the wavelength range of 360–425 nm. Therefore, the effective energy transfer from Bi3+ to both Tb3+ and Eu3+ can be expected. It is noticeable that among the observed emission transitions, the magnetic dipole 5D0 → 7F1 is predominant, suggesting that the surrounding environment of Eu3+ is centrosymmetric. This is in line with our crystallographic research, which shows that Eu3+ may replace Tb3+ and mainly occupies the six-fold coordinated Wyckoff 2a site, which has a regular octahedral coordination configuration. Therefore, the ligand field around Eu3+ is centrosymmetric [see Fig. 1(d) and Table S1†].
Fig. 5(a) shows the PLE and PL spectra of the representative phosphor, Ba4BiTb0.998Eu0.002O(BO3)4. The PLE spectra monitored with Bi3+ emission of 397 nm and Tb3+ emission of 543 nm are similar to those of Ba4BiYO(BO3)4 and Ba4BiTbO(BO3)4, respectively, which means that the energy transfer of Bi3+ → Tb3+ is still apparent in this Bi3+/Tb3+/Eu3+ coexisting phosphor. On the contrary, the PLE spectrum of Ba4BiTb0.998Eu0.002O(BO3)4 by monitoring Eu3+ emission at 612 nm differs slightly from those of Ba4BiTbO(BO3)4 and Ba4BiEuO(BO3)4. It is primarily composed of the characteristic excitation bands of Tb3+:4f8 → 4f75d1 and 4f8 → 4f8 transitions, with small admixtures of those of Bi3+:1S0 → 1P1 and Eu3+:4f6 → 4f6 transitions. On the other hand, under 240 nm (Bi3+:1S0 → 1P1) excitation, the PL spectrum of Ba4BiTb0.998Eu0.002O(BO3)4 contains not only the Bi3+ blue emission band at 370–475 nm but also the Tb3+ green emission peak at 543 nm and the Eu3+ orange emission peak at 593 nm. The presence of Bi3+ and Tb3+ absorption bands when monitoring the Eu3+ emission and the observation of both Tb3+ and Eu3+ characteristic emissions when excited by Bi3+ absorption suggests the occurrence of Bi3+ → Eu3+, Tb3+ → Eu3+ and Bi3+ → Tb3+ energy transfer in the three-ion coexisting phosphor.
Since the UV-excitation at ∼240 nm does not match the output wavelength of commercial n-UV (λem = 350–420 nm) LED chips, and also the Ba4BiTb1−xEuxO(BO3)4 (0 ≤ x ≤ 0.2) phosphors show a blue-to-purple emission (without passing through the white light region) under this excitation, we chose 349 nm (Bi3+:1S0 → 3P1) as the excitation wavelength for Bi3+ to measure the concentration-dependent PL spectra of Ba4BiTb1−xEuxO(BO3)4. As seen from Fig. 5(b), the spectra exhibit typical Bi3+:3P1 → 1S0, Tb3+:5D4 → 7FJ (J = 6, 5) and Eu3+:5D0 → 7FJ (J = 1–4) transitions in the blue, green, and orange emission regions, respectively. With an increase in the Eu3+ content (x), the emission intensities of both Bi3+ and Tb3+ decline monotonously, whereas that of Eu3+ first increases until x = 0.05 and then appears a downfall. This is easy to understand because the occurrence of Bi3+ → Tb3+ and Bi2+ → Eu3+ energy transfer results in a reduction of Bi3+ emissions. The incorporation of Eu3+ into the Ba4BiTbO(BO3)4 host would cause the substantial energy transfer from Tb3+ to Eu3+, and meanwhile, the relatively high efficiency of Bi3+-to-Eu3+ energy transfer would suppress the Bi3+-to-Tb3+ energy transfer, therefore, a decrease in Tb3+ emissions can be anticipated. In addition, the increase of Eu3+ emissions with increasing Eu3+ content up to x = 0.05 is also understandable because both Bi3+ and Tb3+ can transfer energy to Eu3+. However, once the Eu3+ content (x) exceeds 0.05, the concentration quenching occurs, resulting in the weakening of the Eu3+ emission intensity. Moreover, as shown in Fig. 5(c), when excited at 377 nm (Tb3+:7F6 → 5D3), the PL spectra exhibit both Tb3+ and Eu3+ emissions, with the latter dominating. As the Eu3+ concentration increases, the emission intensity of Tb3+ at 543 nm decreases, while that of Eu3+ at 593 nm shows the opposite trend, as a consequence of Tb3+ → Eu3+ energy transfer. However, if we use 394 nm (Eu3+:7F0 → 5L6) as the excitation wavelength, only the characteristic emissions of Eu3+:5D0 → 7FJ (J = 0–4) are visible in Fig. 5(d), indicating that the inverse transition (Eu3+ → Bi3+ and Eu3+ → Tb3+) is forbidden. In this case, the PL intensity increases linearly with the Eu3+ doping content (x), and no concentration quenching occurs up to x = 0.2. These observations show that the emission profiles and color of Ba4BiTb1−xEuxO(BO3)4 are influenced not only by the dopant concentration but also by the selected excitation wavelength. Similar phenomena were reported in CdTb1−xSmxGaB2O7, CaCO3:Eu3+, Tb3+ and CeO2:Eu3+ as well.64–66
3.7. Fluorescence lifetime and energy transfer mechanism
To further illustrate the energy transfer processes, Fig. 6 shows the fluorescence decay curves for the Bi3+:3P1 → 1S0 and Tb3+:5D4 → 7F5 emission bands of Ba4BiTb1−xEuxO(BO3)4 under excitation at 349 and 377 nm, respectively. All the decay profiles can be fitted into a triple-exponential function:
 | (3) |
 | (4) |
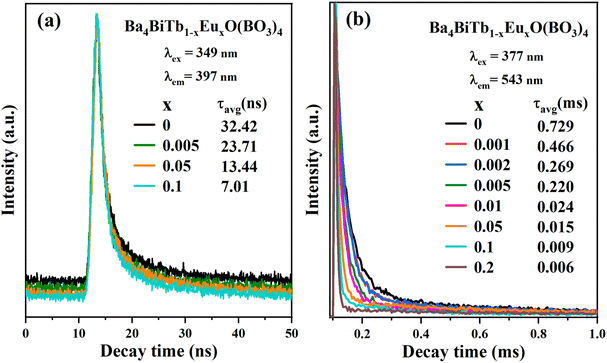 | ||
| Fig. 6 Decay curves of the Ba4BiTb1−xEuxO(BO3)4 phosphors monitoring 3P1 → 1S0 transition of Bi3+ (a) and 5D4 → 7F5 transition of Tb3+ (b) under excitation at 349 and 377 nm, respectively. | ||
The τavg values obtained for different phosphors are also provided in Fig. 6, from which it is easy to see that increasing the Eu3+ concentration causes a reduction in the decay lifetimes of Bi3+ and Tb3+ emissions, which strongly supports the energy transfer from Bi3+ to Tb3+/Eu3+ and from Tb3+ to Eu3+.
Based on the above analyses, a schematic representation of the possible energy transfer pathways in Ba4BiTb1−xEuxO(BO3)4 is described in Fig. 7. Upon excitation at 349 nm, the electrons on Bi3+ ions can be effectively excited from the ground state 1S0 to the excited state 3P1. Then they relax nonradiatively to the lowest vibration mode of the 3P1 state. Afterward, some of the excited electrons return to the ground state of Bi3+ to generate the broadband blue emission, while the others can transfer their energy to the 5D3 level of Tb3+ and the 5L6 level of Eu3+ due to energy level matching, followed by non-radiative relaxation from 5D3 to 5D4 (Tb3+) and from 5L6 to 5D0 (Eu3+) states. Finally, a series of characteristic emissions of Tb3+:5D4 → 7F6,5,4,3 and Eu3+:5D0 → 7F0,1,2,3,4 occur. Apart from the energy transfer from Bi3+ to both Tb3+ and Eu3+, some of the excited electrons can also transfer their energy from the 5D3 level of Tb3+ to the 5L6 excited level of Eu3+, which enhances the Eu3+ emission, accompanied by a decrease in the Bi3+ and Tb3+ emissions.
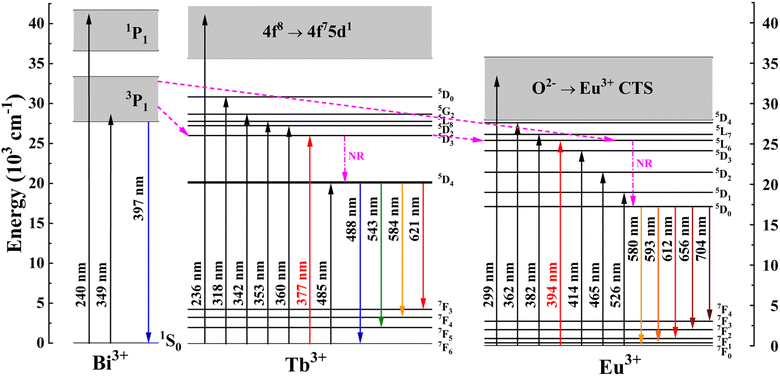 | ||
| Fig. 7 Schematic energy-level diagrams of Bi3+, Tb3+, and Eu3+ in Ba4BiTb1−xEuxO(BO3)4, showing energy-transfer process (NR: nonradiative). | ||
3.8. Emitting light color analysis
In general, the Commission Internationale de I'Eclairage (CIE) chromaticity coordinates are used to characterize the emission color of the phosphor material, and the Correlated Color Temperature (CCT) is used to study which type of light the phosphor can emit. The CIE coordinates of the Ba4BiTb1−xEuxO(BO3)4 (0 ≤ x ≤ 0.2) phosphors were determined by their corresponding PL spectra, and the CCT values were calculated using McCamy's empirical formula:68| CCT = −449n3 + 3525n2 − 6823.3n + 5520.33 | (5) |
| Ba4BiTb1−xEuxB4O13 | CIE(x, y) at λex= | CCT(K) at λex= | ||
|---|---|---|---|---|
| 349 nm | 377 nm | 349 nm | 377 nm | |
| x = 0 | 0.2235 | 0.2785 | 14![[thin space (1/6-em)]](https://www.rsc.org/images/entities/char_2009.gif) 437 437 |
6761 |
| 0.3106 | 0.5058 | |||
| x = 0.001 | 0.3365 | 0.4854 | 5242 | 2578 |
| 0.2938 | 0.4389 | |||
| x = 0.002 | 0.3886 | 0.5248 | 3173 | 2064 |
| 0.3154 | 0.4235 | |||
| x = 0.005 | 0.3829 | 0.5545 | 3009 | 1708 |
| 0.2921 | 0.3947 | |||
| x = 0.01 | 0.4231 | 0.5759 | 2275 | 1644 |
| 0.3131 | 0.3946 | |||
| x = 0.05 | 0.5476 | 0.6004 | 1642 | 1623 |
| 0.3697 | 0.3889 | |||
| x = 0.1 | 0.5703 | 0.6079 | 1620 | 1636 |
| 0.3718 | 0.3865 | |||
| x = 0.2 | 0.5714 | 0.6120 | 1652 | 1667 |
| 0.3549 | 0.3797 | |||
3.9. Thermal stability
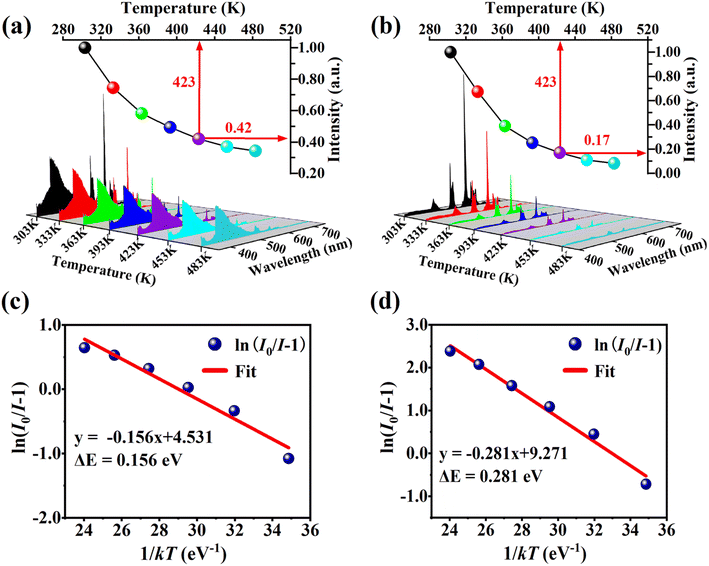
Thermal stability is an indispensable parameter for novel phosphor material because the LED chips are always operated in a high-temperature environment. The temperature-dependent PL spectra of the phosphor Ba4BiTb0.999Eu0.001O(BO3)4 were recorded under two excited wavelengths of 349 and 377 nm, respectively, and the corresponding normalized emission intensities were calculated, as shown in Fig. 9(a) and (b). The PL intensity decreases monotonically with the temperature increasing from 303 to 483 K due to the thermal quenching effect. When the temperature reaches 423 K (150 °C), the PL intensity retains ∼42% (λex = 349 nm) and ∼17% (λex = 377 nm) of that at room temperature (303 K), respectively, indicating that the thermal quenching is more obvious for λex = 377 nm than λex = 349 nm. To better understand the temperature dependence of photoluminescence, the activation energy of thermal quenching (ΔE) was calculated by the Arrhenius equation given as:70
 | (6) |
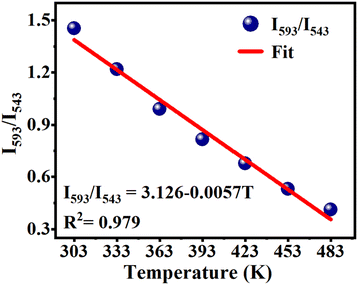
This phosphor exhibits strong temperature sensitization when excited at 377 nm, and its CIE coordinates shift significantly from (0.4540, 0.4052) to (0.2891, 0.3308) as the temperature increases from 303 to 483 K, indicating its potential application in temperature sensing. Fig. 10 shows the temperature-dependent Eu3+/Tb3+ fluorescence intensity ratio FIR [FIR = I593/I543 = I(Eu3+:5D0 → 7F1)/I(Tb3+:5D4 → 7F5)] for this phosphor upon excitation at 377 nm. The calculated FIR-value monotonically decreases with rising temperature from 303 to 483 K, which can be fitted to the correlation coefficient R2 = 0.979 employing the linear function described by the equation:
| FIR = I593/I543 = A + BT = 3.126 − 0.0057T | (7) |
Thus, the sensitivity of Ba4BiTb0.999Eu0.001O(BO3)4 for temperature sensing is about 0.57% per K. Considering this change in the emission intensity and chromaticity coordinates with temperature, we expect that Ba4BiTb1−xEuxO(BO3)4 phosphors excited at 377 nm may be used as luminescent thermometers at this temperature range.72,73 A detailed investigation of this aspect is beyond the scope of this article and will be provided elsewhere.
4. Conclusions
The investigation of the BaO (and SrO)–Bi2O3–Tb2O3–B2O3 system led to the discovery of two new phases, Ba4BiTbO(BO3)4 and Ba1.54Sr2.46BiTbO(BO3)4. They are layered compounds, where Bi2O13 groups share corners with each other and edges with BO3 triangles to create a 2D [Bi(BO3)2O]n5n− layer. There exists another kind of 2D layer, [Tb(BO3)2]n3n−, constructed from TbO6 octahedra and BO3 triangles. These layers and their equivalent partners are stacked alternately along the [001] direction, with the interlayer spaces and intralayer tunnels filled by alkali-earth cations. This study also reveals that Ba4BiLnO(BO3)4 (Ln = trivalent rare-earth ions) forms a large family of compounds, in which Ba2+ can be partially replaced by other divalent cations, such as Pb2+ and Sr2+. Additionally, a series of phosphors, Ba4BiTb1−xEuxO(BO3)4 (0 ≤ x ≤ 1) and Ba4BiYO(BO3)4, were synthesized at 830 °C. Based on analyses of IR/Raman and UV-vis diffuse reflection spectra, the geometric deviation of the BO3 group from the D3h symmetry was verified, and the indirect and direct band gaps of Ba4BiLnO(BO3)4 (Ln = Y, Tb, Eu) were determined. Upon 349 nm excitation, the PL spectra of Ba4BiTb1−xEuxO(BO3)4 contain blue Bi3+:3P1 → 1S0, green Tb3+:5D4 → 7F6,5 and orange Eu3+:5D0 → 7F1,2,3,4 emissions. With an increase in Eu3+ content (x), the emission intensities of Bi3+ and Tb3+ decline steadily, whereas that of Eu3+ initially increases until x = 0.05, and then decreases. When λex = 377 nm, only Tb3+ and Eu3+ emissions appear simultaneously, and the emission intensity of Tb3+ decreases, while that of Eu3+ increases along with increasing x. Thus, a single-component near-white emission and a color-tunable emission from green to red can be realized in Ba4BiTb1−xEuxO(BO3)4 by manipulating the Tb3+/Eu3+ ratio and adopting different excitation wavelengths. Moreover, the Eu3+/Tb3+ fluorescence intensity ratio (I593/I543) for Ba4BiTb0.999Eu0.001O(BO3)4 upon 377 nm excitation can be linearly related to the temperature between 303 and 483 K, indicating the potential of the phosphor as a promising temperature sensor. These findings indicate that exploring new borates based on element substitution is feasible. By doping rare-earth activators onto the newly prepared borate matrix, multifunctional fluorescent materials can be obtained, which may find potential use for w-LEDs and temperature sensor applications. This is a promising field of research that is worth further studying.Conflicts of interest
There are no conflicts to declare.Acknowledgements
This work was supported by the National Key R&D Program of China (2021YFB3501502) and the National Natural Science Foundation of China (92163107). We thank Mr Taifeng Lin from the large scientific instrument-sharing platform of the Beijing University of Technology for the luminescent property measurements.References
- C. C. Lin and R. S. Liu, J. Phys. Chem. Lett., 2011, 2, 1268–1277 CrossRef CAS.
- J. Meyer and F. Tappe, Adv. Opt. Mater., 2015, 3, 424–430 CrossRef CAS.
- H. S. Jang, H. Yang, S. W. Kim, J. Y. Han, S. G. Lee and D. Y. Jeon, Adv. Mater., 2008, 20, 2696–2702 CrossRef CAS.
- T. Xuan, X. Yang, S. Lou, J. Huang, Y. Liu, J. Yu, H. Li, K. L. Wong, C. Wang and J. Wang, Nanoscale, 2017, 9, 15286–15290 RSC.
- J. Zhou, J. L. Leaño Jr, Z. Liu, D. Jin, K. L. Wong, R. S. Liu and J. C. G. Bünzli, Small, 2018, 14, 1801882 CrossRef.
- M. A. Triana, E. L. Hsiang, C. Zhang, Y. Dong and S. T. Wu, ACS Energy Lett., 2022, 7, 1001–1020 CrossRef CAS.
- L. Sun, B. Dong, J. Sun, Y. Wang, R. Sun, S. Hu, B. Zhou, W. Xu, X. Bai, L. Xu, D. Zhou and H. Song, Laser Photonics Rev., 2023, 17, 2300045 CrossRef.
- R. Zhang, H. Lin, Y. Yu, D. Chen, J. Xu and Y. Wang, Laser Photonics Rev., 2014, 8, 158–164 CrossRef CAS.
- G. G. Li, Y. Tian, Y. Zhao and J. Lin, Chem. Soc. Rev., 2015, 44, 8688–8713 RSC.
- J. K. Sheu, S. J. Chang, C. H. Kuo, Y. K. Su, L. W. Wu, Y. C. Lin, W. C. Lai, J. M. Tsai, G. C. Chi and R. K. Wu, IEEE Photonics Technol. Lett., 2003, 15, 18–20 Search PubMed.
- N. C. George, K. A. Denault and R. Seshadri, Annu. Rev. Mater. Res., 2013, 43, 481–501 CrossRef CAS.
- G. Zhu, S. Xin, Y. Wen, Q. Wang, M. Que and Y. Wang, RSC Adv., 2013, 3, 9311–9318 RSC.
- X. X. Guo, J. He, M. M. Huang, R. Shi, Y. B. Chen, Y. Huang, J. Zhang and Z. Q. Liu, Mater. Res. Bull., 2019, 118, 110523 CrossRef CAS.
- Q. Cheng, F. Q. Ren, Q. Lin, H. Tong and X. S. Miao, J. Alloys Compd., 2019, 772, 905–911 CrossRef CAS.
- J. Huang, W. Lu, D. Yue, Y. Wang, Z. Wang, L. Jin, L. Zhang and Z. Li, CrystEngComm, 2019, 21, 6482–6490 RSC.
- Y. Wang, D. Yue, B. Tian, W. Li, B. Zhang, L. Yang, Y. Li, Z. Wang and Y. Zhang, J. Rare Earths, 2022, 40, 1007–1013 CrossRef CAS.
- K. Li and R. V. Deun, Dalton Trans., 2018, 47, 6995–7004 RSC.
- X. L. Wu, J. L. Zheng, Q. Ren, J. F. Zhu, Y. H. Ren and O. Hai, J. Alloys Compd., 2019, 805, 12–18 CrossRef CAS.
- M. Xia, X. B. Wu, Y. Zhong, H. T. Hintzen, Z. Zhou and J. Wang, J. Mater. Chem. C, 2019, 7, 2927–2935 RSC.
- D. Zhao, S. R. Zhang, R. J. Zhang, Y. P. Fan, B. Z. Liu and L. Y. Shi, CrystEngComm, 2020, 22, 4914–4922 RSC.
- J. Zhou and Z. G. Xia, J. Mater. Chem. C, 2015, 3, 7552–7560 RSC.
- W. R. Wang, Y. Jin, S. Yan, Y. Q. Yang, Y. L. Liu and G. T. Xiang, Ceram. Int., 2017, 43, 16323–16330 CrossRef CAS.
- X. Chen, J. F. Zhao, L. P. Yu, C. Y. Rong, C. Z. Li and S. X. Lian, J. Lumin., 2011, 131, 2697–2702 CrossRef CAS.
- J. P. Xie, B. N. Liu, Q. T. Qong, Z. C. Xu, Z. Q. Jin and W. J. Ma, Mater. Express, 2021, 11, 54–62 CrossRef CAS.
- J. H. Zheng, Q. J. Cheng, S. Q. Wu, Z. Q. Guo, Y. X. Zhuang, Y. J. Lu, Y. Li and C. Chen, J. Mater. Chem. C, 2015, 3, 11219–11227 RSC.
- J. Y. Zhong, W. D. Zhuang, X. R. Xing, R. H. Liu, Y. F. Li, Y. L. Zheng, Y. S. Hu and H. B. Xu, RSC Adv., 2016, 6, 2155–2161 RSC.
- M. M. Shang, G. G. Li, D. L. Geng, D. M. Yang, X. J. Kang, Y. Zhang, H. Z. Lian and J. Lin, J. Phys. Chem. C, 2012, 116, 10222–10231 CrossRef CAS.
- A. A. Setlur and A. M. Srivastava, Opt. Mater., 2006, 29, 410–415 CrossRef CAS.
- X. Sun, P. Jiang, W. Gao, X. Zhou, R. Cong and T. Yang, Chem.–Asian J., 2017, 12, 1353–1363 CrossRef CAS PubMed.
- Z. Zhou, G. Liu, J. Ni, W. Liu and Q. Liu, Opt. Mater. Express, 2018, 8, 3526–3542 CrossRef CAS.
- S. Yang, B. Jiang, B. Yu, Y. N. Dai, C. G. Duan, Y. K. Shan and Q. B. Zhao, J. Solid State Chem., 2020, 289, 121392 CrossRef CAS.
- E. L. Wang, K. Feng, J. Li, X. D. Zhou and X. K. Sun, J. Lumin., 2022, 250, 119108 CrossRef CAS.
- X. A. Chen, R. R. Bian, W. Q. Xiao and X. Y. Song, Dalton Trans., 2022, 51, 9454–9466 RSC.
- T. Skarzynski, M. Meyer and P. Stec, Acta Crystallogr., Sect. A: Found. Crystallogr., 2011, 67, C660–C661 Search PubMed.
- G. M. Sheldrick, Acta Crystallogr., Sect. C: Struct. Chem., 2015, 71, 3–8 Search PubMed.
- Y. Le Page, J. Appl. Crystallogr., 1987, 20, 264–269 CrossRef CAS.
- D. Zhao, F. X. Ma, R. J. Zhang, M. Huang, P. F. Chen, R. H. Zhang and W. Wei, Z. Kristallogr., 2016, 231, 525–530 CAS.
- R. R. Bian, X. A. Chen, W. Q. Xiao and X. Y. Song, J. Lumin., 2022, 242, 118545 CrossRef CAS.
- I. D. Brown and D. Altermatt, Acta Crystallogr., Sect. B: Struct. Sci., 1985, 41, 244–247 CrossRef.
- R. D. Shannon, Acta Crystallogr., Sect. A: Cryst. Phys., Diffr., Theor. Gen. Crystallogr., 1976, 32, 751–767 CrossRef.
- K. Li, J. Fan, M. M. Shang, H. Z. Lian and J. Lin, J. Mater. Chem. C, 2015, 3, 9989–9998 RSC.
- A. A. Coelho, J. Appl. Crystallogr., 2018, 51, 210–218 CrossRef CAS.
- K. Nakamoto, Infrared and Raman Spectra of Inorganic and Coordination Compounds, John Wiley and Sons, Inc., New York, 5th edn, 1997 Search PubMed.
- S. Filatov, Y. Shepelev, R. Bubnova, N. Sennova, A. V. Egorysheva and Y. F. Kargin, J. Solid State Chem., 2004, 177, 515–522 CrossRef CAS.
- V. V. Atuchin, A. K. Subanakov, A. S. Aleksandrovsky, B. G. Bazarov, J. G. Bazarova, T. A. Gavrilova, A. S. Krylov, M. S. Molokeev, A. S. Oreshonkov and S. Y. Stefanovich, Mater. Des., 2018, 140, 488–494 CrossRef CAS.
- X. S. Lv, Y. G. Yang, B. Liu, Y. Y. Zhang, L. Wei, X. Zhao and X. P. Wang, Vib. Spectrosc., 2015, 80, 53–58 CrossRef CAS.
- V. V. Atuchin, D. A. Vinnik, T. A. Gavrilova, S. A. Gudkova, L. I. Isaenko, X. X. Jiang, L. D. Pokrovsky, I. P. Prosvirin, L. S. Mashkovtseva and Z. S. Lin, J. Phys. Chem. C, 2016, 120, 5114–5123 CrossRef CAS.
- H. F. Li, Y. H. Zhang, H. L. Ou, T. Y. Ma and H. W. Huang, Colloids Surf., A, 2020, 584, 123994 CrossRef CAS.
- B. Ramesh, G. R. Dillip, B. Rambabu, S. W. Joo and B. Deva Prasad Raju, J. Mol. Struct., 2018, 1155, 568–572 CrossRef CAS.
- L. X. Yang, D. C. Zhu, S. S. Liu, J. S. Wang, C. Zhao and Y. Pu, Phys. B, 2019, 556, 6–11 CrossRef CAS.
- J. B. Chang, P. X. Yan and Q. Yang, J. Cryst. Growth, 2006, 286, 184–187 CrossRef CAS.
- B. Z. Wu, S. Qi, X. K. Wu, H. L. Wang, Q. Q. Zhuang, H. M. Yi, P. Xu, Z. N. Xiong, G. J. Shi, S. Q. Chen and B. F. Wang, Chin. Chem. Lett., 2021, 32, 3113–3117 CrossRef CAS.
- S. Solgi, M. Jafar Tafreshi and M. Sasani Ghamsari, Mater. Res. Express, 2019, 6, 026205 CrossRef.
- F. Baur, F. Glocker and T. Jüstel, J. Mater. Chem. C, 2015, 3, 2054–2064 RSC.
- J. Tauc and A. Menth, J. Non-Cryst. Solids, 1972, 8–10, 569–585 CrossRef CAS.
- J. H. Nobbs, Rev. Prog. Color., 1985, 15, 66–75 Search PubMed.
- P. P. Dang, D. J. Liu, G. G. Li, A. A. A. Kheraif and J. Lin, Adv. Opt. Mater., 2020, 8, 1901993 CrossRef CAS.
- Y. Gao, H. Y. Qian, P. F. Jiang, R. H. Cong and T. Yang, Dalton Trans., 2021, 50, 16660–16669 RSC.
- Y. Wang, N. Guo, B. Q. Shao, C. F. Yao, R. Z. Ouyang and Y. Q. Miao, Chem. Eng. J., 2021, 421, 127735 CrossRef CAS.
- Y. C. Ren, H. H. Zhang, Y. Y. Chen, N. N. Li and Y. G. Yang, Ceram. Int., 2022, 48, 5737–5743 CrossRef CAS.
- Z. Zhou, Y. Zhong, M. Xia, N. Zhou, B. F. Lei, J. Wang and F. F. Wu, J. Mater. Chem. C, 2018, 6, 8914–8922 RSC.
- X. A. Chen, J. Y. Zhang, W. Q. Xiao and X. Y. Song, Dalton Trans., 2022, 51, 6299–6313 RSC.
- M. Bettinelli, A. Speghini, F. Piccinelli, J. Ueda and S. Tanabe, Opt. Mater., 2010, 33, 119–122 CrossRef CAS.
- X. A. Chen, J. Y. Zhang, W. Q. Xiao and X. Y. Song, RSC Adv., 2023, 13, 16272–16284 RSC.
- Q. Cheng, Y. Dong, M. Kang and P. Zhang, J. Lumin., 2014, 156, 91–96 CrossRef CAS.
- X. Liu, S. Chen and X. Wang, J. Lumin., 2007, 127, 650–654 CrossRef CAS.
- D. Zhao, S. R. Zhang, Y. P. Fan, B. Z. Liu and R. J. Zhang, Inorg. Chem., 2020, 59, 8789–8799 CrossRef CAS PubMed.
- C. S. McCamy, Color Res. Appl., 1992, 17, 142–144 CrossRef.
- Y. Chen, G. H. Chen, X. Y. Liu, C. L. Yuan and C. R. Zhou, Opt. Mater., 2017, 73, 535–540 CrossRef CAS.
- S. Bhushan and M. V. Chukichev, J. Mater. Sci. Lett., 1988, 7, 319–321 CrossRef CAS.
- S. Yang, B. Jiang, J. H. Wu, C. G. Duan, Y. K. Shan and Q. B. Zhao, J. Mater. Chem. C, 2021, 9, 7065–7073 RSC.
- L. Li, P. X. Yang, W. X. Chang, X. H. Tang, C. Li, Z. Y. Zeng, S. Jiang and X. J. Zhou, Adv. Powder Technol., 2018, 29, 43–49 CrossRef CAS.
- M. Y. Ding, H. L. Zhang, D. Q. Chen, Q. W. Hu, J. H. Xi and Z. G. Ji, J. Alloys Compd., 2016, 672, 117–124 CrossRef CAS.
Footnote |
| † Electronic supplementary information (ESI) available: X-ray crystallographic files for Ba4BiTbO(BO3)4 and Ba1.54Sr2.46BiTbO(BO3)4 in CIF format; atomic coordinates and equivalent isotropic displacement parameters; selected bond lengths and angles; Rietveld refinement results of Ba4BiTb1−xEuxO(BO3)4 (0 ≤ x ≤ 1) and Ba4BiYO(BO3)4; SEM images and EDX spectra of the single-crystals; Rietveld plots of Ba4BiTb1−xEuxO(BO3)4 (0.001 ≤ x ≤ 0.2) and Ba4BiYO(BO3)4; IR, Raman, XPS and UV-vis absorption spectra. CCDC 2311747 and 2311748. For ESI and crystallographic data in CIF or other electronic format see DOI: https://doi.org/10.1039/d3ra08265b |
| This journal is © The Royal Society of Chemistry 2024 |

