 Open Access Article
Integrated resonance Rayleigh scattering approach utilizing Box–Behnken experimental design for the facile quantification of prucalopride in pharmaceutical tablets and human urine with sustainability assessment
Khalid M. Badr El-Dina,
Sayed M. Derayeaa,
Fatma F. Mohammed *a and
Ahmed Abdulhafez Hamadb
aAnalytical Chemistry Department, Faculty of Pharmacy, Minia University, Minia, Egypt. E-mail: fatma.farouk@mu.edu.eg
bPharmaceutical Analytical Chemistry Department, Faculty of Pharmacy, Al-Azhar University, Assiut Branch, Assiut, Egypt
First published on 5th March 2024
Abstract
Prucalopride (PCP) is one of the recent drugs used for the regulation of gastrointestinal tract motility and the treatment of constipation. A new, highly sensitive and fast resonance Rayleigh scattering (RRS) approach was suggested for PCP determination. The approach was based on its reaction of PCP with eosin Y in buffered medium (pH 3.5) to form an ion pair association complex which had a significant enhancement in RRS compared to that of eosin Y or PCP alone. The enhancement of RRS intensity had straight correlation to PCP concentration ranging from 150 to 2000 ng mL−1 with 38 ng mL−1 as LOD and 125 ng mL−1 as LOQ. The measurements were done at a wavelength of 365 nm that provided the maximum sensitivity. All the experimental parameters were studied carefully and optimized via Box–Behnken experimental design. The International Council for Harmonization (ICH) guidelines were employed to validate the suggested method and the obtained results proved the appropriate method performance. The method was efficiently utilized to determine PCP in pure form, pharmaceutical tablets and spiked urine samples with no interferences from the surrounding matrices. Furthermore, the greenness of the suggested procedure was confirmed using different green metric approaches.
1. Introduction
Prucalopride (PCP) is a selective agonist for 5-hydroxytryptamine receptors (especially 4), which normalizes bowel function in patients with constipation.1 The documented IUPAC name for PCP (Fig. 1) is 4-amino-5-chloro-N-[1-(3-methoxypropyl)piperidin-4-yl]-2,3-dihydro-1-benzofuran-7-carboxamide; butanedioic acid. The medication is employed for the therapeutic management of constipation through stimulation of high amplitude propagated contraction in the colon, the enhancement of colonic propulsion and the acceleration of right colon emptying.2 PCP is orally active and well tolerated. It is more efficient and safer for the treatment of patients with severe chronic constipation compared with its predecessors (e.g. cisapride and tegaserod).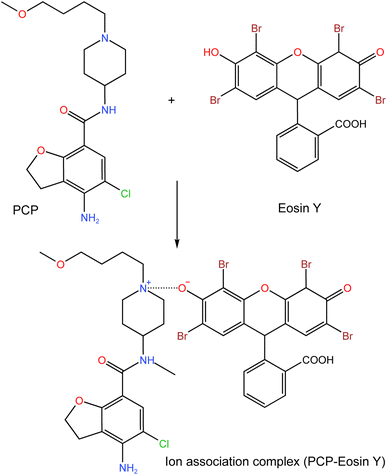 | ||
| Fig. 1 The suggested ion association reaction between PCP and eosin Y in buffered acidic medium (pH 3.5). | ||
According to the literature, the quantification of PCP was accomplished through the utilization of separation methodologies, specifically high-performance liquid chromatography (HPLC).3–6 Electro-analytical techniques, such as voltammetry7 and potentiometry8 were also employed for its estimation. The reported chromatographic and electrochemical methods required tedious sample pretreatment steps, less green and expensive solvents and sophisticated instruments. On the other hand, few spectroscopic techniques were reported, including UV spectrophotometry9–13 and luminescence-based reaction.14–16 The spectrophotometric methods suffered from limited sensitivity. While, the procedure of the first spectrofluorimetric method14 was tedious, lengthy, utilized costly reagent (terbium chloride) and an environmental contaminating one (8-hydroxyquinoline). Although the second method15 had simple procedure, its sensitivity was less than the proposed method. The linear range of the reported method15 was 0.75–5.5 μg mL−1 with 0.75 μg mL−1 as a lower limit of quantitation. Meanwhile these values for the proposed method were 150–2000 and 125 ng mL−1, respectively. Thus, the present method is 6 times more sensitive. The third spectrofluorimetric method16 was utilized for simultaneously determination of PCP and empagliflozin.
The analytical strategy based on Resonance Rayleigh Scattering (RRS) is gaining prominence due to its combination of high sensitivity and simplicity, making it an essential analytical approach. This technique has been applied in the analysis of various chemical and therapeutically active agents,17 a diverse range of biological macromolecules, such as nucleic acids18 and proteins,19 in addition trace metal ions.20
A variety of chemical dyes and pigments were employed as probes in the development of RRS approaches.17 These dyes have either acidic or basic nature, and some of them have highly conjugated system with rigid structures that naturally emit light. At the optimal pH, the dye is ionized, then complexed with the analyte. This process causes the RRS spectrum of the dye to be augmented with appearance of a new band. The observed phenomenon has the potential to be utilized for the determination of very low concentration of the desired analyte down to a few nano-grams.17
The dye known as eosin Y (Fig. 1) is a compound belonging to the xanthene family which is chemically described as 2,4,5,7-tetrabromo-fluoresceine. This dye was utilized in the chemical analysis relied on forming an ion-coupling complexes between the dye and basic chemicals. Eosin Y, has been employed for the purpose of protein identification and investigation,21 as well as for the analysis of numerous medicinal substances.22–26
There is a growing demand for an environmentally sustainable, efficient, rapid, user-friendly, and highly responsive technique for the analysis of the PCP. The previously mentioned objectives can be effectively tackled through the utilization of the RRS method. This method entails the reaction of the targeted pharmaceutical compound with self-fluorescent dyes within an acidic solution. In terms of environmental sustainability and sensitivity, the designed approach exhibited more positive results than the previously reported spectroscopic methods. Thus, the present article provides a new sensitive, rapid and feasible method for the determination of PCP based on measuring the RRS intensity of the ion association complex formed between the cited drug and the dye in buffered acidic medium.
2. Experimental
2.1. Apparatus
The RRS measurements were done utilizing FS-2 SCINCO spectrofluorometer with a 150 W Xe-arc as a light source lamp (Korea). ADWA AD11 pH meter was utilized for pH adjustments (Hungary).2.2. Statistical methods and software
Microsoft Excel 365 and GraphPad Instat software (version 3.05) were exploited for statistical calculations. Linear regression models were adopted for PCP calibration. Design expert software (version 13) was used for producing Box–Behnken experimental design model and calculating its statistical parameters. Student's t-test and F test were utilized for comparison between the proposed and reported methods.2.3. Materials and reagents
PCP succinate was obtained generously from Al Andalous Company for Pharmaceutical Industries (Cairo, Egypt), and the drug was used without pretreatment. Eosin Y (Merck, Darmstadt, Germany) was prepared as 0.024% w/v (3.47 × 10⁻⁴ M) aqueous solution. Sodium acetate and acetic acid were purchased from ElNasr Company for Chemicals (Cairo, Egypt) and both were prepared as 0.2 M solution then mixed in adequate amounts to prepare acetate buffer (pH 3.5). The main solvent utilized throughout the work was distilled water. The grade of all used chemicals was analytical.2.4. Pharmaceutical tablets
The analysed commercial tablets were Prucasoft® (Delta Grand Pharma, Cairo, Egypt) that was labelled to contain 2.64 mg PCP succinate per tablet (equivalent to 2 mg PCP).2.5. Standard drug solutions
A stock solution of PCP succinate (100 μg mL−1) was obtained by dissolving 10.0 mg of the drug with distilled water into 100.0 mL calibrated flask. Then further dilutions were done with the same solvent to produce working solutions of PCP in the concentration ranges of 1.5–20.0 μg mL−1. Finally, 1.0 mL of the prepared working solutions was taken in the general procedure.2.6. Procedures
3. Results and discussion
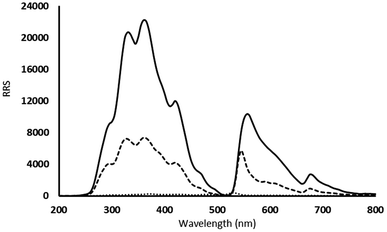
Rayleigh scattering is a type of elastic light scattering that have the same wavelength to that of the incident light. RRS is special type that happens if the wavelength of Rayleigh scattering is equal or close to the molecular absorption wavelength. It could be measured using synchronous spectrofluorimetry when λexcitation = λemission (Δλ = 0 nm). This analytical technique acquired much attention due to its sensitivity and simplicity. It was utilized widely for the analysis of many types of compounds including pharmaceutical agents, metal ions, anions, surfactants, proteins, biological samples. Many pharmaceutical compounds could react in weak acidic solutions with acidic xanthene dyes such as erythrosine B, eosin Y and Rose Bengal to produce ion-pair associates. These associates attain significant enhancement in the RRS intensity which could be measured and exploited for the analysis of the target analytes.17It was reported that forming of association complexes (binary or ternary types) between eosin Y dye and many pharmaceutical compounds causes significant enhancement of RRS spectrum and the emerging of new RRS bands. This augmentation was ascribed to the enlarged molecular volume and molecular weight, the increased rigidity and planarity of the molecule, and improvement of the hydrophobicity because of complex formation.26 This increase in the RRS intensity was in direct proportion with the analyte concentrations. In the suggested method, PCP reacted with eosin Y in weak acidic medium pH 3.5 resulting in ion association binary complex (Fig. 1) that caused high augmentation of the RRS intensity compared to either eosin Y or PCP alone in the same pH (Fig. 2). By observing the produced spectra, the wavelength 365 nm was chosen for measurements as it provided the greatest enhancement.
When the pH is sufficiently acidic, the tertiary amino group of PCP will undergo protonation, forming dye anion. At the same pH, PCP was fully ionized in the cationic form. The two oppositely charged ions interact with each other resulting in an ion-pair complex formation. The PCP-dye system exhibited augmentation in the RRS spectral bands, providing a way for the quantification of the drug. Due to the low pricing of the reagents and the widespread availability of the required equipment in quality control laboratories, this method is regarded as cost-effective.
3.1. Optimization of experimental parameters
Different experimental parameters were investigated and adjusted to attain maximum sensitivity. The parameters were the pH and volume of acetate buffer, volume of eosin Y and the diluting solvents. Experimental design using Box–Behnken surface response design27 was adopted for optimization.Box–Behnken design is considered as a highly fractionalized three-level factorial design, with the treatment combinations being the centre point and the midpoints of the factor levels' edges. These designs require three levels of each factor being studied and are rotatable, or almost rotatable. Box–Behnken designs have advantages over other designs as it requires fewer tests than the central composite design with only three levels. It is also simpler to arrange and interpret than other designs. Furthermore, it can be expanded, contracted, or even translated; and since midpoints of factor edges are always used, it avoids combined factor extremes and can suit full quadratic response surface models.28
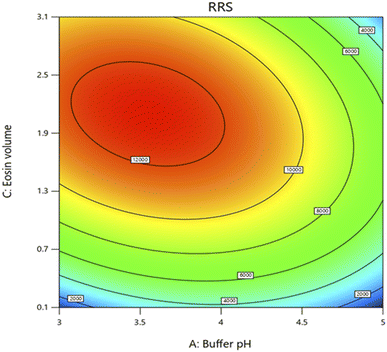
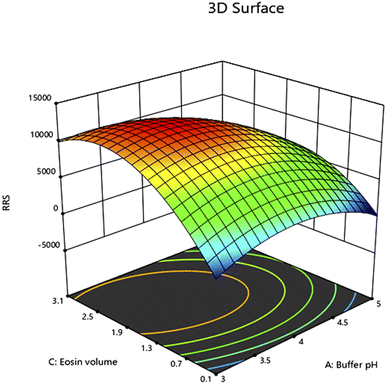
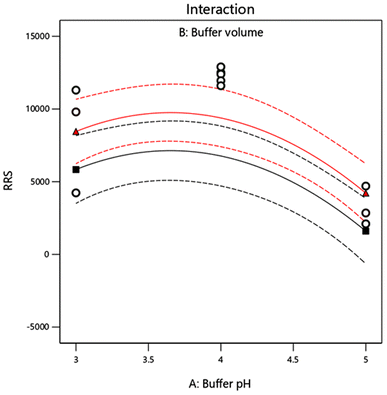
The design was exploited for the optimization of pH of acetate buffer solution, the volume of the buffer and the volume of eosin Y solution. The chosen levels of the evaluated variables are described in Table 1. The number of runs were 15 and they were augmented by additional five runs with central points. The quadratic fit was found to get the optimal response. Analysis of Variance (ANOVA) was used to confirm all proposed models with 95.0% confidence limits. In models with quadratic terms, ANOVA was run first, and then insignificant variables were eliminated backwards (α to remove = 0.5). This resulted in the creation of a “basic” model that only included the significant variables and the terms required to keep the model harmonious. The following equation summarized the response surface derived using Box–Behnken design which is displayed in Fig. 3–5 by contour plot, 3D response surface plot and interaction plot, respectively.
| RRS = 11700.77 − 2118.85 × A + 1307.68 × B + 2671.98 × C − 1922.86 × AC − 3048.98 × A2 − 3624.45 × B2 − 5323.77 × C2 |
| Variable | Coded variable | ||
|---|---|---|---|
| (+1) | (0) | (−1) | |
| pH of acetate buffer | 5 | 4 | 3 |
| Volume of acetate buffer (mL) | 1.2 | 0.7 | 0.2 |
| Volume of eosin (mL) | 3.1 | 1.6 | 0.1 |
ANOVA for quadratic models proved the validity of the model through the obtained statistical data. The lack of fit F-value was 8.43 indicating that there was a 5.31% chance of lack of fit which could be due to noise and non-significant. The adjusted and predicted R2 values were >0.8 and the difference between them was less than 0.2 and the adequate precision values was greater than 4 confirming the validity of the models (Table 2).
| Source | Sum of squares | df | Mean square | F-Value | p-Value | |
|---|---|---|---|---|---|---|
| Block | 9.830 × 10⁶ | 1 | 9.830 × 10⁶ | |||
| Model | 4.341 × 10⁸ | 7 | 6.201 × 10⁷ | 27.84 | <0.0001 | Significant |
| A-Buffer pH | 4.694 × 10⁷ | 1 | 4.694 × 10⁷ | 21.07 | 0.0006 | |
| B-Buffer volume | 1.447 × 10⁷ | 1 | 1.447 × 10⁷ | 6.50 | 0.0255 | |
| C-Eosin volume | 6.322 × 10⁷ | 1 | 6.322 × 10⁷ | 28.39 | 0.0002 | |
| AC | 1.659 × 10⁷ | 1 | 1.659 × 10⁷ | 7.45 | 0.0183 | |
| A2 | 4.756 × 10⁷ | 1 | 4.756 × 10⁷ | 21.35 | 0.0006 | |
| B2 | 5.647 × 10⁷ | 1 | 5.647 × 10⁷ | 25.35 | 0.0003 | |
| C2 | 1.341 × 10⁸ | 1 | 1.341 × 10⁸ | 60.21 | <0.0001 | |
| Residual | 2.673 × 10⁷ | 12 | 2.227 × 10⁶ | |||
| Lack of fit | 2.571 × 10⁷ | 9 | 2.857 × 10⁶ | 8.43 | 0.0531 | Not significant |
| Pure error | 1.017 × 10⁶ | 3 | 3.389 × 10⁵ | |||
| Cor total | 4.707 × 10⁸ | 20 |
| R2 | 0.9420 |
| Adjusted R2 | 0.9082 |
| Predicted R2 | 0.8024 |
| Adeq. precision | 14.1588 |
To determine the optimum factors, the numerical optimization was performed and individual desirability was studied. The target was to maximize the RRS response. The best factorial blend was shown by a desirability value that is ∼1.0000 that was achieved using pH of 3.5, volume of buffer 0.8 mL and volume of eosin Y 2.1 mL (Fig. 6) and the highest response was practically confirmed.
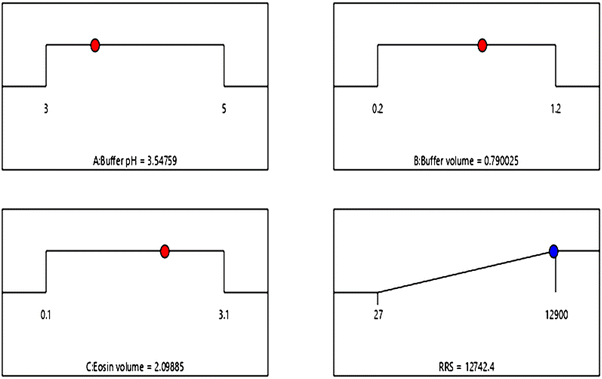 | ||
| Fig. 6 The ramp view numerical optimization for solutions. Red points show optimal factor settings while blue points show optimal response prediction values. | ||
3.2. Causes for RRS augmentation
3.3. Validation of the proposed method
After optimization of the experimental parameters, the suggested approach was validated according to the guidelines of the International Council for Harmonization31 regarding linearity, range, precision, accuracy, robustness, limits of detection and quantitation.| Parameter | Value |
|---|---|
| Linear range (ng mL−1) | 150–2000 |
| Slope | 5.368 |
| Standard deviation of slope (Sb) | 0.0638 |
| Intercept | 8000 |
| Standard deviation of the intercept (Sa) | 5.568 |
| Correlation coefficient* | 0.9995 |
| Standard deviation of residuals (Sy,x) | 124.77 |
| Limit of detection (LOD, ng mL−1) | 37.916 |
| Limit of quantitation (LOQ, ng mL−1) | 126.388 |
| LOD = 3.3σ/S and LOQ = 10σ/S |
Precision of the suggested method was validated by testing intraday and inter-day precision where the relative standard deviation was calculated in both cases. Three replicate determinations at three levels of concentration (700, 1000 and 1200 ng mL−1) were done using the assay procedure within the same day and in three successive days for intraday and interday precision levels, respectively. The resulting values of % RSD (0.96–1.90) were lower than 2% proving the suggested method's high precision (Table 5).
| Optimization factor | Value | % recovery a | SD | % RSD |
|---|---|---|---|---|
| a the value is a mean of three determinations. | ||||
| pH of acetate buffer | 3.3 | 95.13 | 0.95 | 1.00 |
| 3.5 | 98.65 | 0.57 | 0.58 | |
| 3.7 | 99.65 | 1.16 | 1.16 | |
| Volume of acetate buffer | 0.7 | 95.24 | 0.84 | 0.88 |
| 0.8 | 97.44 | 1.11 | 1.14 | |
| 0.9 | 96.98 | 1.74 | 1.79 | |
| Volume of eosin Y | 2.0 | 97.85 | 0.55 | 0.56 |
| 2.1 | 101.89 | 1.14 | 1.12 | |
| 2.2 | 103.84 | 1.53 | 1.47 | |
3.4. Application of the method
3.5. Assessment of the sustainability and greenness of the method
| Item | Parameter | Word sign | PP score |
|---|---|---|---|
| a LSH for the less severe hazard, and TPPs for the total penalty points. | |||
| Instrument | Spectrofluorimeter | LSHa | 1 |
| Reagent (s) | Erythrosine B | LSHa | 1 |
| Amount of reagent | >10 mL | 1 | |
| Solvent (s) | Water (for dilution) | LSHa | 1 |
| Heating | No heating | 0 | |
| Temperature | Ambient temperature | 0 | |
| pH | 3.5 | 1 | |
| Cooling | No cooling | 0 | |
| Energy (kW h per sample) | >1.0 | 0 | |
| Waste | 1–10 mL | 3 | |
| Occupational hazards | 0 | ||
| (TPPs)a | 8 | ||
| Eco-scale total score = 100 − TPP | 92 | ||
4. Conclusion
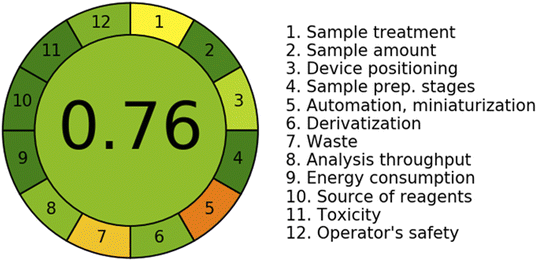
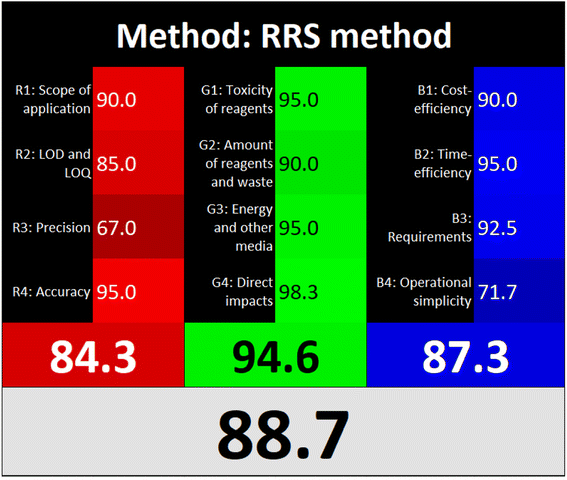
The suggested method presented a highly sensitive, green, rapid and simple method for the determination of PCP based on RRS measurements. The method had higher sensitivity than spectrophotometric methods. It is also simpler and greener compared with chromatographic methods that employ expensive and hazardous organic solvents and require sophisticated instruments. Furthermore, the method was successfully applied on pharmaceutical tablets and with no errors from the added excipients proving the method's high selectivity and allowing its utilization in quality control laboratories. Moreover, spiked urine samples were analyzed successfully using the suggested approach with no significant interferences from the surrounding matrix. In addition, three green analytical chemistry metrics were employed to ensure the sustainability of the proposed method.Conflicts of interest
There are no conflicts to declare.References
- H. Wang, K. Lane, Z. Lou, S. Parker and M. Placke, Regul. Toxicol. Pharmacol., 2020, 112, 104586 CrossRef CAS.
- G. Coremans, Core Evidence, 2008, 3, 45–54 Search PubMed.
- Z. Sun, L. Zuo, J. Kang, L. Zhou, M. Jia, Z. Li, Z. Yang, X. Zhang and Z. Zhu, J. Chromatogr. B, 2016, 1033, 328–333 CrossRef.
- B. S. Mahamuni, A. Jajula, A. Awasthi, P. D. Kalariya and M. K. Talluri, J. Pharm. Biomed. Anal., 2016, 125, 219–228 CrossRef CAS.
- S. Kanthale, S. Thonte, S. Pekamwar and D. Mahapatra, Int. J. Pharm. Sci. Drug Res., 2020, 12, 166–174 CrossRef CAS.
- C. Sreedhar, K. Manogna, H. Akkamma and B. J. K. Boruah, RGUHS J. Pharm. Sci., 2021, 11, 39–43 Search PubMed.
- R. T. Eleryan, M. Salem and R. Tony, Egypt. J. Chem., 2023, 66, 15–24 Search PubMed.
- M. S. Elshahed, S. S. Toubar, A. A. Ashour and R. T. El-Eryan, Measurement, 2022, 204, 112071 CrossRef.
- A. Bhosale, V. Bhagat, V. Kunjir, D. Kardile and R. Shete, Res. J. Pharm. Technol., 2021, 14, 4189–4191 Search PubMed.
- V. N. Akhani, K. Patel, K. Patel, L. Prajapati and C. Patel, World J. Pharm. Res., 2020, 1568–1576 CAS.
- G. Bojja and M. A. Mukthinuthalapati, Acta Sci. Pharm. Sci., 2020, 4, 78–81 Search PubMed.
- D. Venkateswarlu and I. E. Chakravarthy, J. Emerg. Technol. Innov. Res., 2019, 6, 743–753 Search PubMed.
- M. M. A. Goutham Dev Ashish Bojja, Acta Sci. Pharm. Sci., 2020, 4, 74–77 Search PubMed.
- M. S. Elshahed, S. S. Toubar, A. A. Ashour and R. T. El-Eryan, BMC Chem., 2022, 16, 1–11 CrossRef.
- M. T. Saad, H. E. Zaazaa, T. A. Fattah and S. A. Boltia, J. Fluoresc., 2023, 1–9 Search PubMed.
- I. M. Nour, A. R. Mohamed, M. A. Hasan and M. Badrawy, Spectrochim. Acta, Part A, 2023, 296, 122715 CrossRef CAS.
- S. M. Derayea, M. A. Abdel-Lateef, B. S. Mohammed, A. A. Hamad and E. Samir, Microchem. J., 2023, 191, 108774 CrossRef CAS.
- Y. F. Li, C. Z. Huang, X. H. Huang and M. Li, Anal. Chim. Acta, 2001, 429, 311–319 CrossRef CAS.
- S. P. Liu and Q. Liu, Anal. Sci., 2001, 17, 239–242 CrossRef CAS.
- S. P. Liu, Z. F. Liu and H. Q. Luo, Anal. Chim. Acta, 2000, 407, 255–260 CrossRef CAS.
- X. Zhu, J. Sun and Y. Hu, Anal. Chim. Acta, 2007, 596, 298–302 CrossRef CAS.
- A. A. Hamad, R. Ali and S. M. Derayea, RSC Adv., 2022, 12, 7413–7421 RSC.
- A. A. Hamad, R. Ali, H. R. H. Ali, D. M. Nagy and S. M. Derayea, RSC Adv., 2018, 8, 5373–5381 RSC.
- S. M. Derayea, Anal. Methods, 2014, 6, 2270–2275 RSC.
- S. M. Derayea, H. F. Askal, O. H. Abdel-Megeed and M. A. El Hamd, J. Appl. Pharm. Sci., 2012, 84–89 Search PubMed.
- S. M. Derayea and D. M. Nagy, Rev. Anal. Chem., 2018, 37, 20170020 CAS.
- K. H. Esbensen, D. Guyot, F. Westad and L. P. Houmoller, Multivariate Data Analysis: in Practice : an Introduction to Multivariate Data Analysis and Experimental Design, CAMO, 2002 Search PubMed.
- E. F. Elkady, M. A. Fouad and A. N. Mozayad, BMC Chem., 2022, 16, 114 CrossRef CAS PubMed.
- S. Liu, H. Luo, N. Li, Z. Liu and W. Zheng, Anal. Chem., 2001, 73, 3907–3914 CrossRef CAS.
- S. Liu and L. Kong, Anal. Sci., 2003, 19, 1055–1060 CrossRef CAS.
- Validation of Analytical procedures: methodology International Conference on Harmonization (ICH) of Technical Requirements for the Registration Pharmaceuticals for Human Use, 1996.
- A. Gałuszka, Z. M. Migaszewski, P. Konieczka and J. Namieśnik, TrAC, Trends Anal. Chem., 2012, 37, 61–72 CrossRef.
- F. Pena-Pereira, W. Wojnowski and M. Tobiszewski, Anal. Chem., 2020, 92, 10076–10082 CrossRef CAS.
| This journal is © The Royal Society of Chemistry 2024 |

