DOI:
10.1039/D3RA07426A
(Paper)
RSC Adv., 2024,
14, 5851-5862
Effect of a novel drying method based on supercritical carbon dioxide on the physicochemical properties of sorghum proteins
Received
31st October 2023
, Accepted 5th February 2024
First published on 15th February 2024
Abstract
The aim of this research was to use supercritical carbon dioxide (SC-CO2) drying as a novel approach for generating sorghum protein concentrates/isolates with enhanced functional properties. Sorghum protein extracts were obtained from white whole-grain sorghum flour and were dried by two methods, namely, freeze-drying and SC-CO2 drying. The collected proteins were characterized for their morphology, color, crystallinity, surface hydrophobicity, emulsifying activity index (EAI), creaming index (CI), foaming capacity (FC), foaming stability (FS), protein solubility, chemical interactions, and viscosity. The SC-CO2-dried proteins exhibited higher porosity compared to the freeze-dried ones with smaller particle sizes (∼5.1 vs. 0.4 μm, respectively). The XRD patterns indicated that the SC-CO2-dried proteins had a lower crystallinity than the freeze-dried proteins. However, the surface hydrophobicities of the freeze-dried and SC-CO2-dried proteins were similar. The EAI results showed that the emulsifying activity of freeze-dried protein powder (40.6) was better than that of SC-CO2-dried protein powder (29.8). Nevertheless, the solubility of SC-CO2-dried proteins was higher than that of freeze-dried proteins in most of the pHs investigated. Overall, the proposed SC-CO2 drying method has the potential to generate porous protein powders with improved solubility that can be used in developing functional foods.
1 Introduction
Modern food systems are facing several challenges due to the deterioration of freshwater sources, habitable land, arable areas, and the emission of greenhouse gases.1 Therefore, the demand for green and sustainable food systems is rising rapidly. Plant proteins possess great potential to substitute animal proteins in promoting sustainable sourcing while providing the essential phytochemicals and fibers in the human diet at the same time.2 In addition, plant proteins are expected to reduce the intake of saturated fat and cholesterol.3 Furthermore, plant-based meat alternatives are suggested to reduce the negative environmental impacts of the current animal-based protein sourcing practices.4
Sorghum (Sorghum bicolor L.) is a staple crop for almost half a billion people and is used as a major human food, animal feed, and bioenergy production.5 It is the fifth most-produced cereal crop in the world after maize, rice, wheat, and barley.6 It is mostly used as animal feed in the US, while in Africa and Asia, it is grown for direct human consumption.7 Sorghum has the potential to grow in semi-arid and arid climates as it is more drought-resistant than other cereals, making it a potential crop that can withstand climate change. Moreover, sorghum can be a staple crop for people with celiac disease due to its gluten-free nature.8 The major component of sorghum protein is called kafirin, which is a prolamin.9 Although prolamins are the main protein components of the other cereals in general, kafirin has distinctive physiochemical properties in several ways.10 They are classified into four classes, namely α-, β-, γ-, and δ-kafirins. Kafirin is slowly digestible and is one of the most hydrophobic prolamins,10 limiting the full potential of sorghum proteins.
Drying is one of the most common and effective food-preserving methods to prevent microbial growth by reducing water activity.11 Some of the current protein drying methods are convective drying, freeze drying, and spray drying. Convective drying is a commercial method utilized for drying proteins as it is more cost-effective than freeze drying.12 Nonetheless, prolonged heat exposure during the convective drying processes leads to protein denaturation and loss of functionality.13 Freeze drying or lyophilization consists of freezing, primary drying, and secondary drying.14 Freeze-drying is usually considered as a gentle drying method.15 However, freeze-drying is a time and money-consuming process, and it is considered the most expensive drying process because of the high operation and maintenance costs.14,16 In the spray-drying process, on the other hand, the fluid is directly atomized, and hot air comes directly in contact with the spray of droplets.17 Despite some advantages,18 there are some drawbacks, such as high temperature application, high energy consumption, work scale dependent yield, and the need for excipients.19,20 Thus, there is a critical need for a green approach to dry proteins that maximizes functionality while minimizing energy consumption.
SC-CO2 utilizes CO2 that is above its critical temperature (31.1 °C) and pressure (7.4 MPa)16 as a solvent, that has both liquid and gas-like properties.21 CO2 is a non-flammable, non-toxic, abundant, recyclable, and low-cost solvent. SC-CO2 shows unique properties, such as diffusivities like gases and densities similar to liquids. SC-CO2, as a green solvent, has received great attention in extracting nonpolar and polar components from various raw materials.22,23 Recently, SC-CO2-assisted extrusion has been used as an alternative method to increase the functionality of milk proteins.24 In addition, SC-CO2 can be used as a promising novel approach for drying foods.25 SC-CO2 has been used to dry carrots, apples, and basil.26–28 For example, SC-CO2-dried carrots retained the original structure better than air-dried carrots.26 However, the research on SC-CO2 as a drying technique for food components is still scarce. Even though SC-CO2 technology is considered a green technology for applications like extraction,29,30 there is limited data on the techno-economic analysis of SC-CO2 dying.
SC-CO2 drying has been used for generating aerogels with ultra-low density, high surface area, and porosity.31 Aerogels from various polymers have recently received a lot of attention for their outstanding properties.31 Owing to their remarkable properties, they have been used for numerous pharmaceutical, food, and non-food applications, such as thermal insulators, filters, fillers, etc.31–33 The unique properties of aerogels, such as lowest density with very high porosity, have increased the attention to their use in the drug delivery systems.34 SC-CO2 drying eliminates surface tension and capillary forces, hence preserving the structure of gels. Compared to freeze and air drying, SC-CO2 generates dried gels with much higher surface area. For example, freeze-dried gels (i.e., cryogels) had a much lower surface area (<1 m2 g−1) compared to aerogels dried with SC-CO2 (47–175 m2 g−1).35 Thus, SC-CO2 can be used to dry sorghum proteins to generate protein concentrates/isolates with porous structures. To the best of our knowledge, there is no study reporting the drying of sorghum proteins using SC-CO2.
Therefore, the goal of this study was to dry sorghum proteins from white whole-grain sorghum flour via a novel approach based on SC-CO2 drying. The specific objectives were to (1) dry sorghum proteins with SC-CO2 and freeze drying, and (2) compare the properties of freeze-dried and SC-CO2-dried sorghum proteins in terms of their hydrophobicity, morphology, color, EAI, CI, FC, FS, water solubility, and chemical structure.
2 Experimental
2.1 Materials
White whole grain sorghum flour was kindly provided by Nu Life Market (KS, USA). The liquid CO2 (99.99% purity) with a dip tube was purchased from Airgas, Inc. (AR, USA). Sodium azide, sodium meta bisulfate, sodium hydroxide, sodium phosphate dibasic anhydrous, and hexane were obtained from ThermoFisher Scientific (MI, USA). Coomassie brilliant blue was purchased from MP Biomedicals (CA, USA), and ethanol was supplied from Decon Labs (PA, USA).
2.2 Lipid analysis with Soxhlet method
Total lipids in white sorghum flour were extracted by a Soxhlet apparatus following the method of Wang.36 Sorghum flour (5 g) was wrapped in a filter paper (Whatman #4; 125 mm diameter), which was placed in a cellulose extraction thimble and fit in a Soxhlet apparatus attached to a flask containing 175 mL of hexane. The solvent was refluxed for 6 h to recover all the lipids in the sample. After 6 h of extraction, the residue solvent was evaporated at 50 °C until dryness.
2.3 Defatting of sorghum flour
The sorghum flour was defatted using the method of Kundu and Sethi.37 Hexane (300 mL) was added with 100 g of sorghum flour and stirred with a magnetic stirrer for 1.5 h, and the mixture was left undisturbed for 30 min. Then, hexane was siphoned off, and the defatting process was repeated two more times. Finally, the flour was left under a fume hood overnight after removing hexane with filtration to remove all the solvent residues. The dry-defatted flour was used for the protein extraction.
2.4 Extraction of proteins
Proteins were extracted from the defatted sorghum flour following the method of Li et al.38 with slight modifications from Bean et al.39 Defatted sorghum flour was mixed with 70% (v/v) ethanol with 0.5% (w/v) sodium meta bisulfate and 0.35% (w/v) sodium hydroxide. The solid-to-solvent ratio was 1![[thin space (1/6-em)]](https://www.rsc.org/images/entities/char_2009.gif) :4. The solution was placed for ultrasonication with 70% amplitude at 20 °C for 4 min (Probe sonication Branson Ultrasonic, CT, USA). The pulsation cycle, ultrasonic power, and frequency were 5 s, 300 W, and 20 kHz, respectively. Then, the mixture was placed on a magnetic stirrer at 50 °C with continuous stirring for 1 h. Next, the solvent was centrifuged at 4000 rpm for 10 min. The supernatant was pooled off. The extraction process was repeated three times. After collecting the supernatant, the ethanol-to-water ratio was adjusted to 50% (v/v). The pH of the supernatant was adjusted to 2.5 with 1 M HCl and kept in the refrigerator overnight to allow protein precipitation. The precipitate was collected the next day by centrifugation at 4000 rpm for 10 min. The collected precipitate was used for drying.
:4. The solution was placed for ultrasonication with 70% amplitude at 20 °C for 4 min (Probe sonication Branson Ultrasonic, CT, USA). The pulsation cycle, ultrasonic power, and frequency were 5 s, 300 W, and 20 kHz, respectively. Then, the mixture was placed on a magnetic stirrer at 50 °C with continuous stirring for 1 h. Next, the solvent was centrifuged at 4000 rpm for 10 min. The supernatant was pooled off. The extraction process was repeated three times. After collecting the supernatant, the ethanol-to-water ratio was adjusted to 50% (v/v). The pH of the supernatant was adjusted to 2.5 with 1 M HCl and kept in the refrigerator overnight to allow protein precipitation. The precipitate was collected the next day by centrifugation at 4000 rpm for 10 min. The collected precipitate was used for drying.| |
 | (1) |
2.5 SC-CO2 drying of proteins
SC-CO2 drying was performed using a lab-scale SC-CO2 extractor (Fig. 1) (SFT-120, Supercritical Fluid Technologies, Inc., DE, USA). The sorghum protein extract (∼15 mL) was put into the cylindrical stainless-steel vessel and covered with filter paper (Whatman #4). To eliminate air in the vessel, the system was flushed with CO2 for 5 s before drying. The temperature of the vessel was set to 50 °C, and the temperatures of the needle and micro-metering valves were set to 80 °C to prevent freezing due to the Joule-Thomson effect. The pressure and flow rate were set to 10 MPa and 1 L min−1 (measured at ambient conditions), respectively. The drying was carried out at 10 MPa and 50 °C for 4 h using pure SC-CO2 based on our previous study.35 The ethanol from the protein extract was continuously collected in a 40 mL brown glass vial kept in an ice bath. After 4 h, the dried protein powder was collected from the stainless-steel vessel and kept in airtight containers in the refrigerator for future characterization.
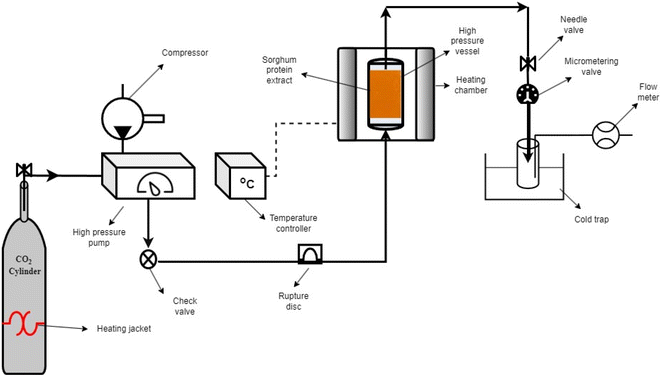 |
| | Fig. 1 Schematic diagram of the SC-CO2 drying system. | |
2.6. Freeze-drying of proteins
Sorghum protein extracts were freeze-dried at −43 °C and 0.0056 MPa (LABCONCO, MO, USA) following the method of Ahmadzadeh and Ubeyitogullari.40 The protein extract was left in the freezer (−80 °C) for 24 h prior to placing it in the freeze-dryer. The samples were freeze-dried for 48 h, and kept in airtight containers in the refrigerator until further characterization.
2.7 Characterization of proteins
2.7.1 Protein content. The protein content in the dried proteins was measured by the AOAC official method 968.0.6 using a Fisons NA2000 Carbon Nitrogen Analyzer (NJ, USA). The nitrogen content was converted into crude protein content with a 6.25 conversion factor.
2.7.2 Moisture content. The moisture contents of the protein powders were determined following the method of Tuhanioglu, Lafontine and Ubeyitogullari.41 The protein powders were dried at 105 °C for 12 h in a conventional oven. The moisture content was calculated by the change of mass of the protein samples after drying.
2.7.3 Morphology. The morphology was analyzed using the method described by Kaur and Ubeyitogullari.23 FEI NovaNanolab200 Dual Beam system that was equipped with a 30 kV SEM FEG column and a 30 kV FIB column was used (FEI Company, OR, USA). The samples were coated with a gold layer by the use of a sputter-coater EMITECH (SC7620 Sputter Coater, MA, USA) at a deposition rate of 25 nm min−1. Spot size 4 with a beam current of about 0.6 nA was used with a final aperture of 10 μm. The analysis was conducted at 15 kV and 15 mA with a working distance of 5 mm under low vacuum mode. The SEM images were captured at magnifications ranging between 2000 and 20000×. The size of the particles/aggregates after drying was determined using ImageJ software (public domain, National Institutes of Health, USA).The protein powders in the amount of 3 g were introduced to a graduated measuring cylinder (50 mL), and the bulk volume occupied by the protein powders was noted (V0). Then, the powder was continuously tapped until no further changes in volume occurred. The final volume was recorded (Vf). The densities (g cm−3) were calculated by the ratio of mass to volume.
2.7.4 Color. The color of the proteins was measured using a Minolta CR-300 Chroma Meter with DP-301 Data Processor (NJ, USA). The colors were expressed as lightness/darkness (L*), redness/greenness (a*), and yellowness/blueness (b*). The device was calibrated with a white calibration plate before usage. The total color change (ΔE), chroma, hue angle, and browning index (BI) of the freeze-dried and SC-CO2-dried proteins were calculated by the following equations (Mohammadi et al.42):| |
 | (2) |
| |
 | (3) |
| |
 | (4) |
| |
 | (5) |
| |
 | (6) |
2.7.5 X-ray diffraction. The XRD patterns of sorghum proteins were recorded following the method of Ahmadzadeh and Ubeyitogullari.40 A PW3040X'PertMRD High-Resolution X-ray diffractometer (Philips, Almelo, Netherlands) was used for the data collection. Scanning was performed at 45 kV and 40 mA from 6 to 86° (2θ).The crystallinity index (also called relative crystallinity) was estimated using OriginPro 2021 (OriginLab Corporation, MA, USA). To determine crystallinity, the area under the crystalline peaks was divided by the overall area under the curve, which is the sum of the amorphous region and crystalline peaks.
2.7.6 Surface hydrophobicity. Protein surface hydrophobicity was measured using the Coomassie brilliant blue binding method described by Li, Lin and Bean38 with slight modifications. The sample (20 mg) was mixed with 4.8 mL of 20 mM sodium phosphate buffer. Then, 1.2 mL of the solution was taken and mixed with 300 μL Coomassie brilliant blue G-250 (CBBG) at a concentration of 0.1 mg mL−1. The solution was vortexed at 4000 rpm for 20 min. After vortexing, the supernatant was used to measure the absorbance at 585 nm wavelength using a spectrophotometer (Milton Roy Spectronic 1201, PA, USA). Also, 1.2 mL of 20 mM sodium phosphate buffer and 300 μL Coomassie brilliant blue were mixed to prepare the control. The amount of CBBG bound was measured using the following formula:| |
 | (7) |
where Acontrol is the absorbance of the control, and Asample is the absorbance of the sample.
2.7.7 Emulsifying activity index and creaming index. The EAI and CI were determined following the method of Gopirajah et al.43 For EAI, protein dispersions (3%, w/w) were made from sorghum protein with sodium azide (0.02%), which acts as an antimicrobial agent. Canola oil and protein dispersions were mixed in a ratio of 1:3 to make an oil-in-water emulsion. The oil and protein dispersion were mixed at 13000 rpm for 3 min with a high-shear mixer (VWRVDI 25 S41 Adaptable Homogenizer, MA, USA) at room temperature (23 °C). The pH of the emulsions of freeze-dried and SC-CO2-dried proteins was 6.45. Next, 4.95 mL of sodium dodecyl solution (0.1 g/100 mL) was added to 50 μL of the emulsion. Then, the absorbance was measured with a spectrophotometer at 500 nm wavelength with sodium phosphate buffer as blank. The turbidity of the emulsion was determined by:where T = turbidity, l = cuvette path length (1 cm) and A = absorbance.The EAI (m2 g−1) was calculated by:
where
T = turbidity,
Ø = volume fraction of oil, and
C = amount of protein per unit volume of the aqueous phase before the formation of the emulsion.
For CI, 10 mL of emulsions were placed in glass vials and left in static condition for 7 days at room temperature (23 °C). The CI was determined using the following equation:
| |
 | (10) |
where
Hs and
Ht are the serum height and total height of the emulsion, respectively.
2.7.8 Foaming capacity and stability. FC and FS were determined following the method of Amoura et al.44 Suspensions were made with 0.2% (w/v) protein in 9.0 mM sodium phosphate buffer containing 35 mM NaCl at pH 7.0. Suspensions (100 mL) were placed in a beaker and mixed at 2000 rpm for 100 s at room temperature (23 °C). FS is the percentage of foam volume remaining after 30 min at room temperature (23 °C) per the initial foam volume. FC and FS were calculated as follows:| |
 | (11) |
| |
 | (12) |
where v and v0 are the total volumes before and after whipping, respectively, and vt is the foam volume remaining after 30 min.
2.7.9 Protein solubility. The solubility of the sorghum proteins was measured following the method of Afizah et al.45 Protein dispersions (1 g/100 g) were first prepared in deionized water. The solubility was measured for both freeze-dried protein and SC-CO2-dried proteins in the pH range of 2, 4, 6, 8, and 10, where the pH was adjusted with 0.1 N NaOH and HCl solutions. Then, the dispersions were centrifuged at 4000 rpm for 15 min at 20 °C. Protein content in the supernatant was analyzed by the bicinchoninic acid (BCA) protein assay kit (Pierce™ BCA Protein Assay Kit, IL, USA). The protein solubility was expressed as the weight percentage of protein in the supernatant to total protein in the initial dispersion.
2.7.10 Fourier transform infrared spectroscopy. The infrared spectra of all protein samples were collected using an FTIR spectrometer (IRAfinity IS Fourier transform infrared spectrometer, SHIMADZU Corp, Japan) equipped with attenuated total reflectance (ATR) accessory (Spepac Company, Orpington, UK). The spectra were recorded in the range of 4000 to 400 cm−1 with 64 scans.38 The amide I peaks were further analyzed using the Gaussian peak fitting tool of OriginLab 2021 (OriginLab Corporation, MA, USA).
2.7.11 Viscosity. The viscosity of the freeze-dried and SC-CO2-dried protein samples was measured with a controlled stress rheometer equipped with a Peltier Plate system to control the temperature (AR 2000 Rheometer, TA Instruments, DE, USA), using a parallel-plate geometry with a diameter of 40 mm. Protein samples were dispersed in deionized water at 20% (w/w) concentration with a magnetic stirrer for 1 h. The dispersion was mixed at 13000 rpm for 3 min with a high-shear mixer (VWRVDI 25 S41 Adaptable Homogenizer, MA, USA) at room temperature (23 °C). The pH of the dispersions was adjusted to 12 using HCl and NaOH.46 The flow behavior of the sorghum protein samples was determined by steady shear rates between 1 to 100 s−1 at 20 °C.
2.8 Statistical analysis
The collected data were presented as mean ± standard deviation based on three replications. Tukey's multiple comparison test was employed to conduct multiple comparison of the means at a significance level of α = 0.05, and principal component analysis was performed to reduce dimensionality using JMP Pro (Version 16.0.0 SAS Software Institute, NC, USA) software.
3 Results and discussion
3.1 Protein extraction and drying
Proteins were extracted from white whole-grain sorghum flour through ethanol extraction with isoelectric precipitation. The sorghum flour contained 11.06 ± 0.06% (w/w) proteins, and the protein extraction yield was ∼50% (w/w). The moisture contents of the freeze-dried and SC-CO2-dried proteins were not statistically different (p > 0.05). Freeze-drying, as one of the conventional drying methods, and SC-CO2 drying of sorghum proteins were compared. The protein contents of the protein extracts dried with freeze-drying and SC-CO2 drying were statistically insignificant, as 88.5 ± 1.4 and 85.9 ± 0.4% (w/w), respectively (p > 0.05). Similarly, sorghum protein extractions made with the isoelectric precipitation method had sorghum protein concentrates with purities of 78–83%.47
The isoelectric point is defined as the pH of a protein solution, at which point the net charge of a protein becomes zero. The isoelectric point also indicates the point where the protein's solubility is minimum. Through isoelectric precipitation, the protein's solubility is reduced at acidic pH at or close to the PI point, and it causes the protein to aggregate, leading to the separation of proteins from the solution.48 The pH was maintained at 2.5 for the sorghum protein precipitation in the extraction process.38 The protein content in sorghum grain is typically in the range of 7 to 15%.49 In whole-grain sorghum flour, prolamins (kafirins), which are alcohol-soluble proteins, consist of up to 75% of the total protein. Previously, it was reported that freeze-drying yielded 54% of the total amount of kafirin from white whole-grain sorghum flour, where the extraction method was isoelectric precipitation.50 Another study, which followed the isoelectric precipitation extraction method, yielded 4.7–5.6% (w/w) proteins from sorghum flour.47 After extraction, the protein precipitates were dried using freeze-drying and SC-CO2 drying. SC-CO2 drying of sorghum proteins was conducted at 50 °C and 10 MPa, following the drying conditions described by Ahmadzadeh and Ubeyitogullari,35 where nanoporous starch aerogels were formed using SC-CO2 drying.32 In that study, air-dried alcogels (i.e., xerogels) had a high shrinkage rate due to capillary pressure gradient and high surface tension and resulted in a nonporous structure.32 The BET surface area of air-dried gels was lower than 0.05 m2 g−1, while the surface area of the gels dried via SC-CO2 drying had a high surface area of 59.7 m2 g−1, where the starch gels were obtained by gelatinization of 10% wheat starch at 120 °C and 600 rpm. In another study, SC-CO2 drying was compared with freeze-drying in generating starch beads.35 The aerogels had average pore diameters ranging between 14 and 16 nm and total pore volumes of 0.2–0.7 cm3 g−1. The cryogels obtained by freezing had a very low surface area (<1 m2 g−1) compared to aerogels (175 m2 g−1). Compared to air or freeze drying, SC-CO2 drying preserved the porous structure of the hydrogels, which in turn resulted in aerogels with higher surface areas. In addition, when producing egg white protein powder through phosphorylation with improved functional properties, it was found that freeze-drying is a better method compared to spray drying. Specifically, freeze-dried protein powder showed better emulsion stability, solubility, oil and water absorption capacity, and water holding capacity.51 Rice dreg protein isolate dried with both spray-drying and freeze-drying found that spray-dried rice protein isolates had higher solubility, foaming capacity, and emulsifying activity, while freeze-dried rice protein isolates had higher thermal stability and higher oil/water holding capacity.52
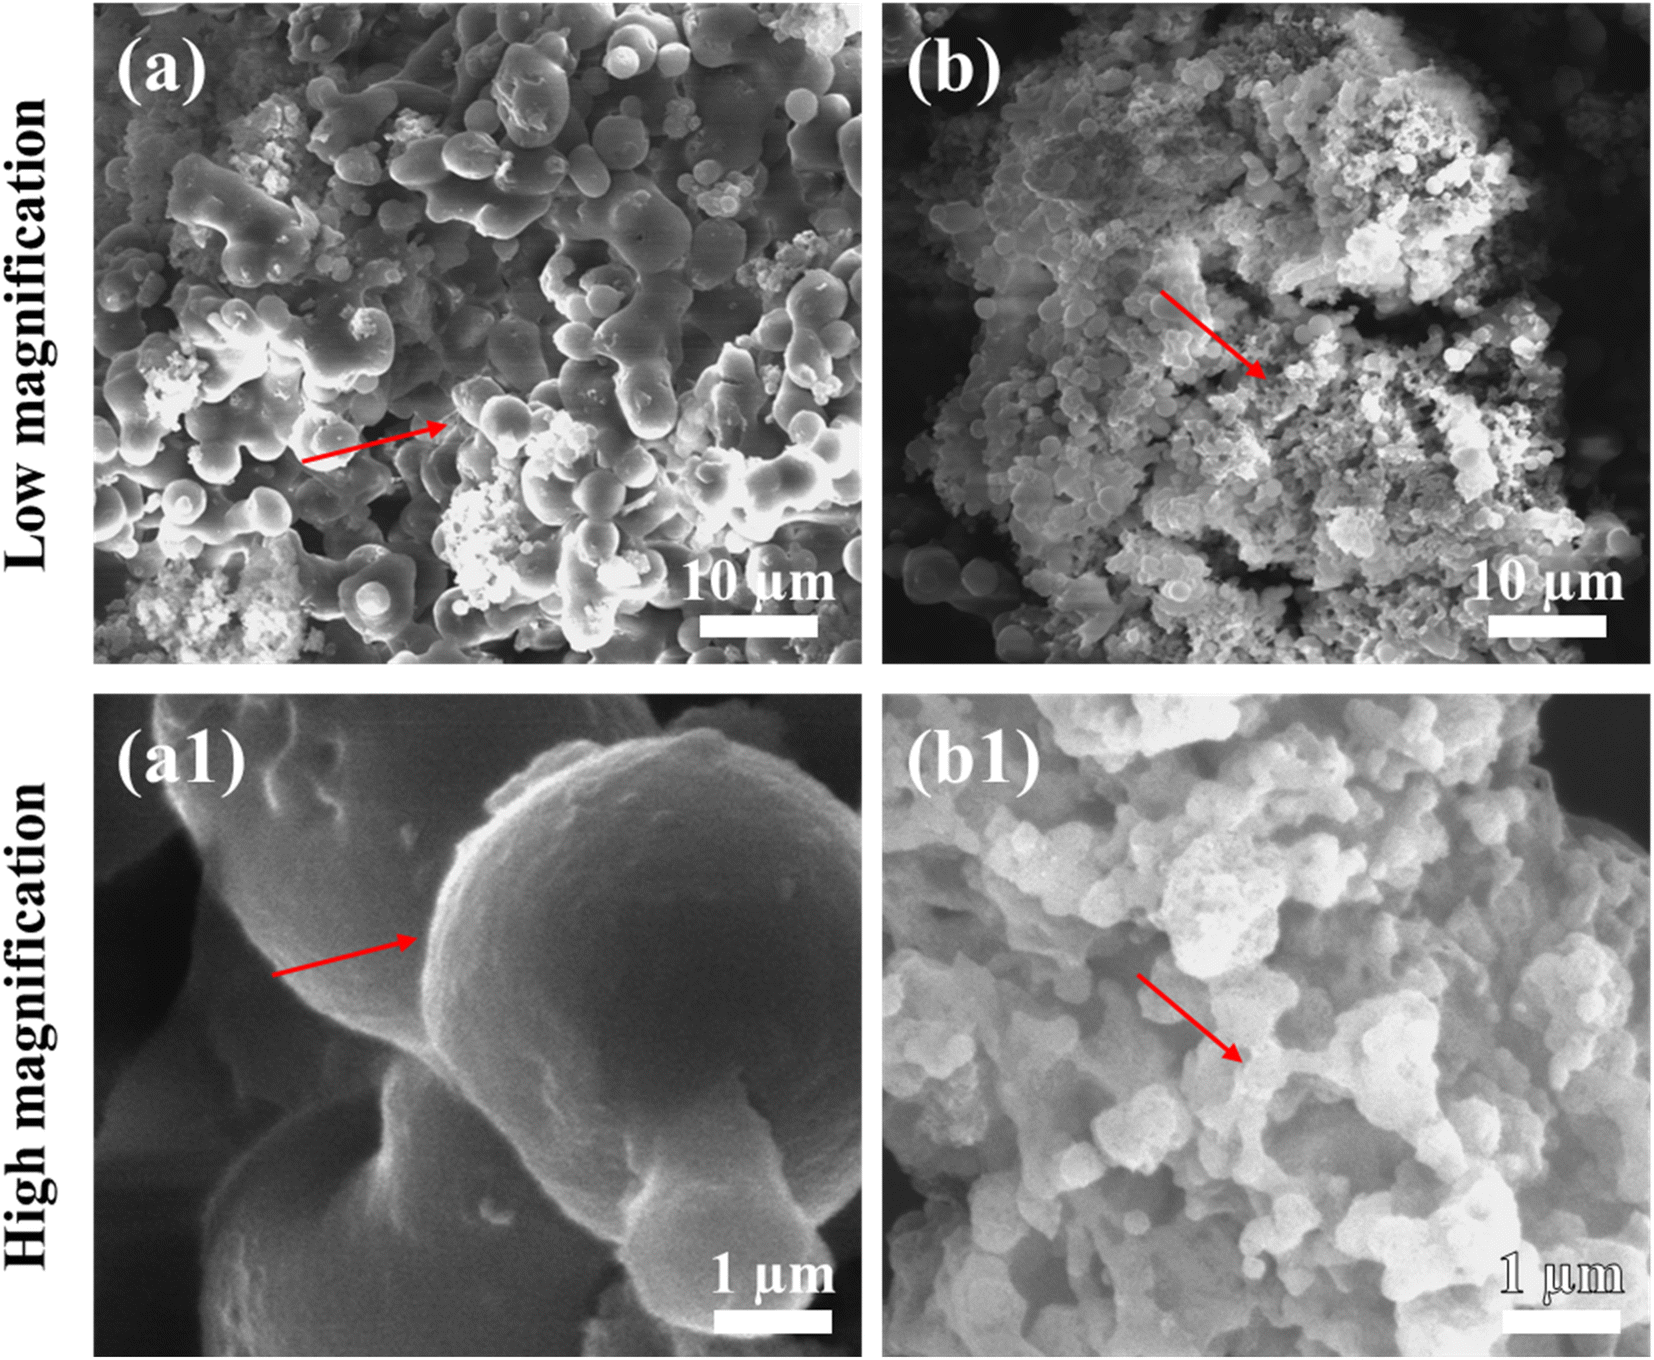
3.2 Morphology of dried proteins
Fig. 2 depicts the morphology of freeze-dried and SC-CO2-dried sorghum proteins. As seen in the images, the freeze-dried sorghum proteins had a denser and less porous structure than SC-CO2-dried sorghum proteins. Spherical globules with rough surfaces were observed for the freeze-dried sorghum proteins, while a more porous structure was observed for the SC-CO2-dried sorghum proteins. SC-CO2 drying at 10 MPa and 50 °C was able to reduce shrinkage and collapse of the structure during drying, resulting in a more porous structure (Fig. 2b and b1). Freeze-drying consists of freezing and sublimation under low vacuum. During freezing, ice crystal formation results in shrinkage and the formation of large macropores.35 As discussed in Section 3.1, the collapse of the structure leads to lower surface areas when dried via freeze-drying. Therefore, the open porous structure of the SC-CO2-dried proteins with smaller particles compared to the freeze-dried ones can provide improved solubility due to their higher surface area. In addition, this porous structure can be utilized in the encapsulation and delivery of bioactive compounds with improved bioaccessibility.
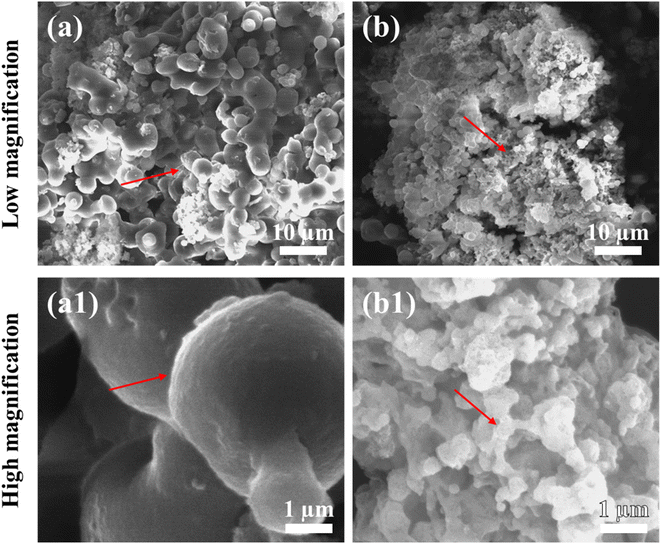 |
| | Fig. 2 SEM images of (a) and (a1) freeze-dried sorghum proteins, and (b) and (b1) SC-CO2-dried sorghum proteins. | |
Previously, when extracted with ethanol, kafirins had small microparticles with very few or no pores and smooth spheres, while larger microparticles had internal holes.53 It was found that the presence of sodium hydroxide during extraction increased solubility and improved yield during extraction of kafirin but made it less soluble.54 For kafirins extracted with acetic acid, SEM images showed porous internal holes and rough surfaces.55 Kafirin microparticles by phase separation from an organic acid and using freeze-drying where SEM images of kafirin microparticles ranging from 1 to 10 μm were taken. The images depicted microparticles as having rough surfaces with pores and numerous vacuoles, and they were spherical or irregular in shape.56 Compared with these studies, the freeze-dried sorghum protein showed similarity according to having rough surfaces and larger globules (5.09 ± 1.33 μm). On the other hand, the SC-CO2-dried aerogels had a more homogeneous porous structure with smaller particle sizes (0.44 ± 0.17 μm).
The microstructure observed in the SEM images also supports the bulk and tapped densities of the protein powders (Table 1). The bulk density of SC-CO2-dried sorghum proteins (0.20 ± 0.01 g cm−3) was significantly lower than that of freeze-dried proteins (0.30 ± 0.01 g cm−3) (p < 0.05). Similarly, SC-CO2 drying (0.29 g cm−3) resulted in significantly lower tapped density compared to freeze drying (0.40 g cm−3). As discussed above, the porous structure of the SC-CO2-dried sorghum proteins explains the lower bulk and tapped densities obtained.
Table 1 Density, moisture content, color, surface hydrophobicity, EAI, and CI of sorghum proteins dried with freeze-drying and SC-CO2 dryinga
| Characterization |
Freeze-dried |
SC-CO2-dried |
| Data are given as means ± standard deviations. Values in the same row with different superscript letters are significantly different (p < 0.05). CBBG: Coomassie brilliant blue G-250. EAI: Emulsifying activity index. CI: Creaming index. |
| Bulk density (g cm−3) |
0.30 ± 0.01A |
0.20 ± 0.01B |
| Tapped density (g cm−3) |
0.40 ± 0.01A |
0.29 ± 0.01B |
| Moisture content (wet basis, %) |
4.83 ± 0.89A |
4.89 ± 0.02A |
| Color |
L* |
96.32 ± 0.06A |
95.30 ± 0.28B |
| a* |
−0.74 ± 0.05B |
−0.37 ± 0.01A |
| b* |
5.75 ± 0.30B |
8.57 ± 0.09A |
| Chroma |
5.76 ± 0.30B |
8.60 ± 0.09A |
| Hue angle |
−86.25 ± 0.11B |
−85.02 ± 0.36A |
| Browning index |
5.78 ± 0.33A |
8.52 ± 0.11B |
| Surface hydrophobicity (CBBG bound μg) |
24.48 ± 0.48A |
25.39 ± 0.35A |
| EAI (m2 g−1) |
40.61 ± 2.71A |
29.83 ± 1.64B |
| CI (%) |
58.53 ± 2.73A |
45.99 ± 2.02B |
3.3 Color
The color of the protein powders obtained via freeze-drying and SC-CO2 drying was determined for their potential food applications (Table 1), where the color could play an important role in consumer acceptability. The brightness (L*) of the freeze-dried proteins was 96.32, while the L* value was slightly lower for the SC-CO2-dried sorghum proteins (95.30), indicating less brightness of the SC-CO2-dried sorghum proteins compared to the freeze-dried ones. The redness (a*) value for the freeze-dried proteins was −0.74, while it was −0.37 for the SC-CO2-dried sorghum proteins. The b* value of SC-CO2-dried sorghum proteins (8.57) was significantly higher than the freeze-dried ones (5.75). Based on the freeze-dried protein samples, the ΔE* was calculated as 3.03 ± 0.26, where ΔE* above 3 color differences can be detected by the human eye.57 Moreover, the chroma values for freeze-dried and SC-CO2-dried proteins were 5.76 and 8.60, respectively, suggesting that the SC-CO2-dried proteins have a more saturated color (p < 0.05). The hue angle of the freeze-dried proteins was −86.25, and it was −85.02 for the SC-CO2-dried proteins. Finally, the browning index of the SC-CO2-dried proteins (8.52) was significantly higher than that of freeze-dried ones (5.78) (p < 0.05). The higher degree of browning in SC-CO2 dried proteins could be due to the higher drying temperature, contributing to the browning reactions.
3.4 Crystallinity
Fig. 3 depicts the XRD patterns of SC-CO2-dried and freeze-dried sorghum proteins. The freeze-dried sorghum proteins exhibited two major peaks at 2θ = 10° and 20°. Even though the SC-CO2-dried proteins had the same peaks, their intensity was lower than that of freeze-dried sorghum proteins. The crystallinity indexes of the SC-CO2-dried and freeze-dried proteins were 5.3 and 8.1, respectively. The porous structure observed in SC-CO2-dried proteins (Fig. 2) could have contributed to their reduced crystallinity due to the limited packing of the proteins. Similarly, in a previous study, freeze-dried fibers had a greater crystallinity index and crystal size than the SC-CO2-dried cellulose fibers.58 Amorphous materials can have enhanced functional properties, such as solubility, compressibility, and water retention.12 Therefore, SC-CO2 drying of sorghum proteins could enhance their functional properties due to the higher amorphous structure.
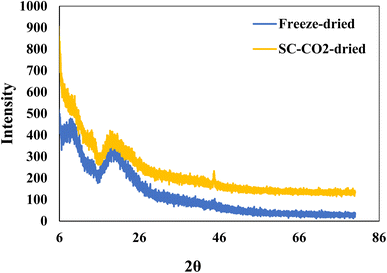 |
| | Fig. 3 XRD patterns of freeze-dried and SC-CO2-dried sorghum protein powders. | |
3.5 Surface hydrophobicity
Table 1 includes the surface hydrophobicity of the sorghum proteins dried with freeze-drying and SC-CO2. The amounts of CBBG bound per mg of protein were similar in freeze (24.5 ± 0.5 μg) and SC-CO2-(25.4 ± 0.4 μg) dried proteins (p < 0.05). Previously, sorghum proteins had much higher surface hydrophobicity (∼25 μg CBBG bound) when compared with soy (∼15 μg CBBG bound) and canola (∼15 μg CBBG bound) proteins.38 Proteins tend to fold into their globular structures because of hydrophobic interactions, affecting their surface hydrophobicity.59 Surface hydrophobicity of protein influences the wetting of proteins because of the surface tension caused by unbalanced molecular forces at the water/solids interface.60 Proteins have four different structure types, namely, primary, secondary, tertiary, and quaternary. The interactions between the hydrophobic region of the protein are related to the tertiary structure, which helps to sustain the structure.61 Therefore, the drying method did not impact the tertiary structure of the sorghum proteins significantly since the surface hydrophobicity of protein is directly related to the tertiary structure (p < 0.05).
3.6 EAI, CI, FC, and FS
Emulsion systems are commonly used in various foods, where proteins are utilized as emulsifiers to create emulsions with higher protein contents.62 During emulsification, proteins make protective coatings and reduce the interfacial tension. The emulsifying properties of proteins are related to their solubility and surface hydrophobicity. Milk protein concentrates functionalized by supercritical fluid extrusion showed improved heat stability and potential to be used in making functional protein-enriched foods.63 The EAI of SC-CO2-dried proteins (29.8 ± 1.6 m2 g−1) was significantly lower than that of the freeze-dried proteins (40.6 ± 2.7 m2 g−1) (p < 0.05). The important properties of making stable food emulsions are surface hydrophobicity, charge, molecular flexibility, and particle size.64 The emulsifying properties of proteins also depend on the solubility of proteins: the more protein would be in the interface between the oil and continuous phase during emulsion, the more protein dissolves in that emulsion system.65
Emulsions have tendencies to separate in distinctive fractions over time.66 Their stability can be determined by the CI, where the lower the value is, the higher the emulsion stability is. The CI of the freeze-dried sorghum proteins (59%) was higher than that of SC-CO2-dried proteins (46%) (p < 0.05). The higher emulsion stability provided by the SC-CO2-dried proteins could be due to the differences in their water solubility (see Section 3.7), secondary structure (see Section 3.8), porous structure, and particle size.67 Creaming is a direct result of the coalescence of oil droplets, providing critical information about emulsion stability. The CI highly depends on the oil concentration as it relates to the viscosity and movement of the oil droplets, affecting the creaming rate.67
Foam formation is one of the key characteristics of proteins. The FC of both the freeze-dried and SC-CO2-dried sorghum proteins were negligible (<1%), which could be due to their relatively low water solubility and hydrophobic nature. Therefore, it was not possible to determine the FS. Similar results were reported for sorghum proteins by Amoura et al.44 and Teklehaimanot and Emmambux.68
3.7 Water solubility
Fig. 4 depicts the protein solubility of the freeze-dried and SC-CO2-dried sorghum proteins at different pH values. Protein solubility is an important characteristic that affects the functional properties, which depend on temperature, pH, salts, solvents, and the presence of additives.69 Increased solubility of protein helps to get desirable qualities of foods such as beverages. The freeze-dried and SC-CO2-dried sorghum proteins were tested for their solubility under different pHs (i.e., 2, 4, 6, 8, 10). The original pH point for both the freeze-dried and SC-CO2-dried sorghum protein was 3.12 in the solution. The pH influences the solubility by changing the net charge of the protein molecules.70 The solubility of proteins is minimized in the isoelectric region. The low solubility is due to the balance between the positive and negative charges, leading to the precipitation and aggregation of the protein molecules.71 The solubility of the SC-CO2-dried proteins was significantly higher than that of freeze-dried proteins in most of the pH values (i.e., 4, 6, 8, and 10) investigated (p < 0.05). However, at pH 2.0, the solubility of freeze-dried proteins was significantly higher than that of the SC-CO2-dried proteins (p < 0.05). The increased porosity and reduced crystallinity can help to explain the increased solubility of SC-CO2-dried sorghum proteins. For example, when their crystallinity is reduced, bioactive compounds exhibit an enhanced dissolution rate due to the increased lattice-free energy.72 Furthermore, the solubility of both proteins increased as the pH was increased from 6 to 10. This result corresponds with previous findings for quinoa protein isolate,73 chickpea protein isolate,74 mung bean protein,75 rapeseed protein,76 oat protein concentrate.77
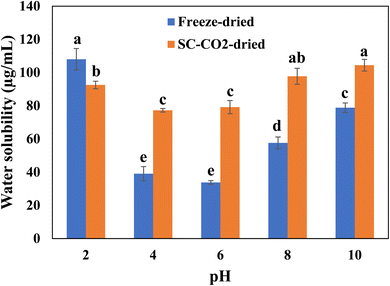 |
| | Fig. 4 Solubility profiles of freeze-dried and SC-CO2-dried sorghum proteins at different pH values. Means with different letters are significantly different (p < 0.05). | |
As there was no significant difference between the surface hydrophobicities of freeze-dried and SC-CO2-dried sorghum proteins, the solubility of the proteins might not be only related to the surface hydrophobicity. An experiment with soy protein isolates, that investigated the relationship between surface hydrophobicity and solubility of the soy proteins, found no exact correlation between them.78 They stated that solubility is not exclusively determined by the degree of exposure of the hydrophobic regions. They indicated industrial processes, such as the addition of salts and phospholipids, drying to a high concentration, and usage of water during extraction, for the reason of breaking the traditional relation between solubility and surface hydrophobicity of proteins.
Comparing the solubility and EAI data with the surface hydrophobicity data obtained for both the freeze-dried and SC-CO2-dried proteins, there was no correlation found between either the EAI and surface hydrophobicity or the solubility and surface hydrophobicity. For example, an experiment was done on enzyme-modified rice endosperm proteins, and no correlation was found between EAI and surface hydrophobicity, as well as between solubility and surface hydrophobicity, and the authors indicated the insoluble nature of rice proteins as the cause.79 Kafirin, the main protein of sorghum, has poor digestibility and low solubility.80 Due to the insoluble nature of sorghum proteins, it may be possible that there were no trends between surface hydrophobicity, solubility, or EAI.
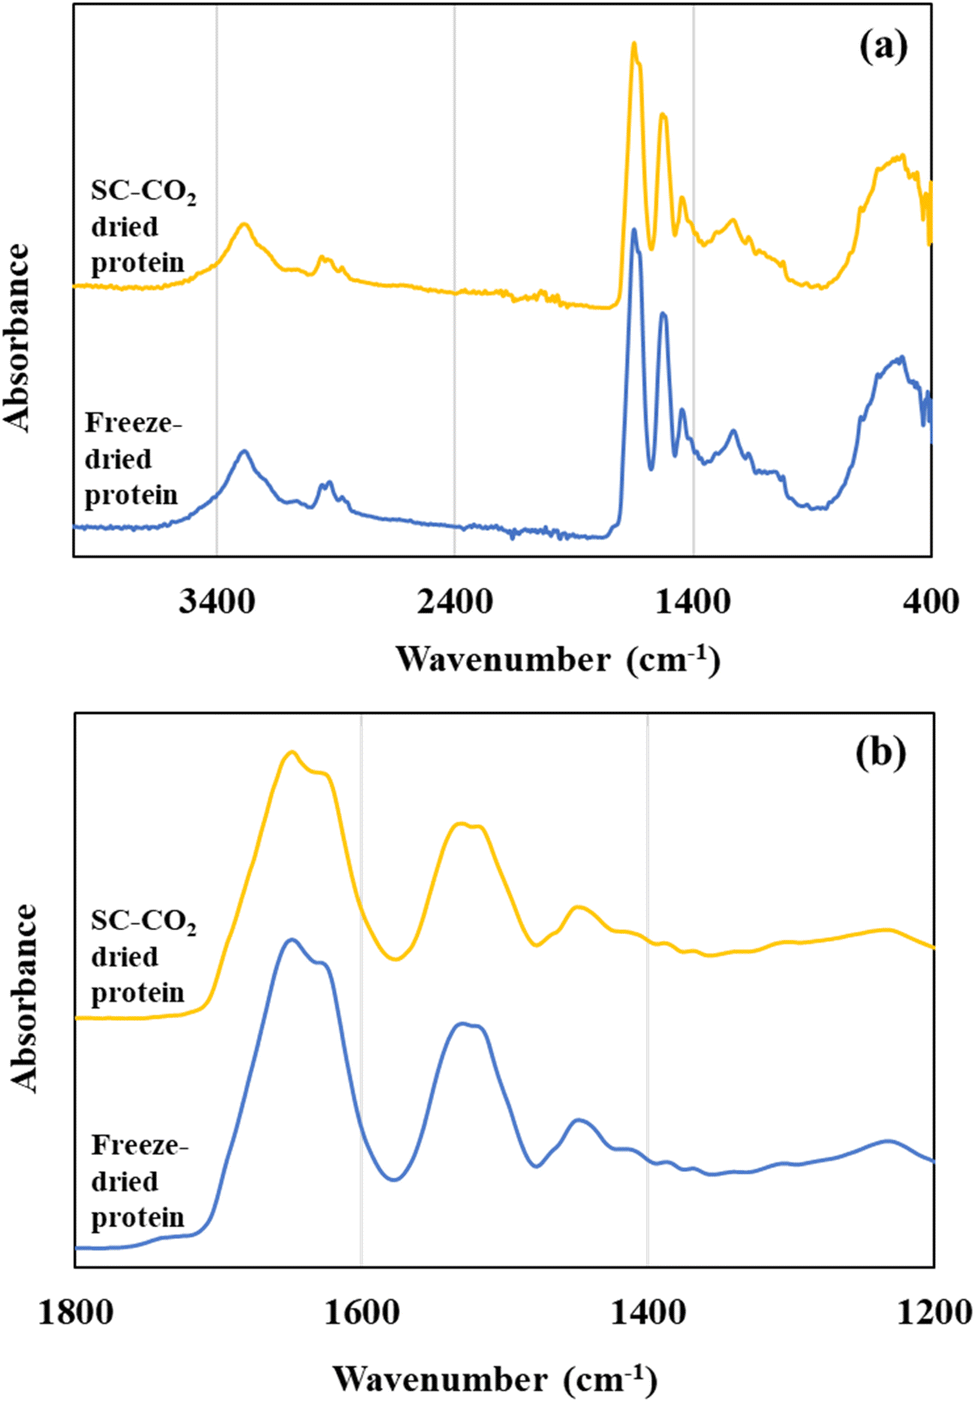
3.8 Fourier transform infrared Spectroscopy
Fig. 5 illustrates the FTIR spectra of the freeze-dried and SC-CO2-dried sorghum proteins. FTIR spectra help to get insights about the secondary structure of proteins. For the protein samples, the major absorbance peaks were in the range of 2000 and 500 cm−1 (Fig. 5a). Two major bands were observed at 1630–1650 cm−1 corresponding to amide I and 1530 cm−1 corresponding to amide II (Fig. 5b). The locations of both the amide I and amide II bands are sensitive to the secondary structure of proteins. For both the SC-CO2-dried and freeze-dried sorghum proteins, the locations of amide I and II bands were similar (Fig. 5b). The amide I band is characterized by C![[double bond, length as m-dash]](https://www.rsc.org/images/entities/char_e001.gif) O stretching (80%) with a minor contribution from C–N stretching, and amide II bands at around 1530 cm−1 are from N–H bending (60%) and C–N stretching with a small contribution from CO stretching.81
O stretching (80%) with a minor contribution from C–N stretching, and amide II bands at around 1530 cm−1 are from N–H bending (60%) and C–N stretching with a small contribution from CO stretching.81
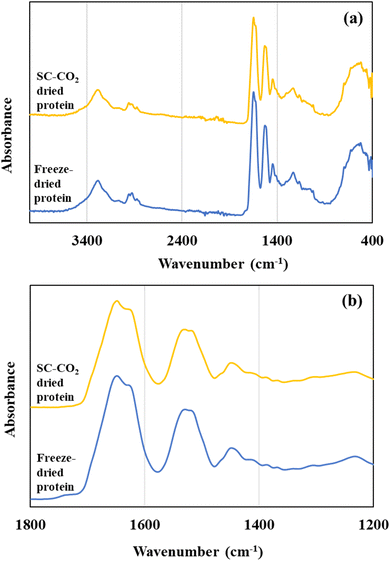 |
| | Fig. 5 (a) FTIR spectra of SC-CO2-dried and freeze-dried sorghum proteins, and (b) FTIR spectra of the samples focusing on the amide I and amide II regions. | |
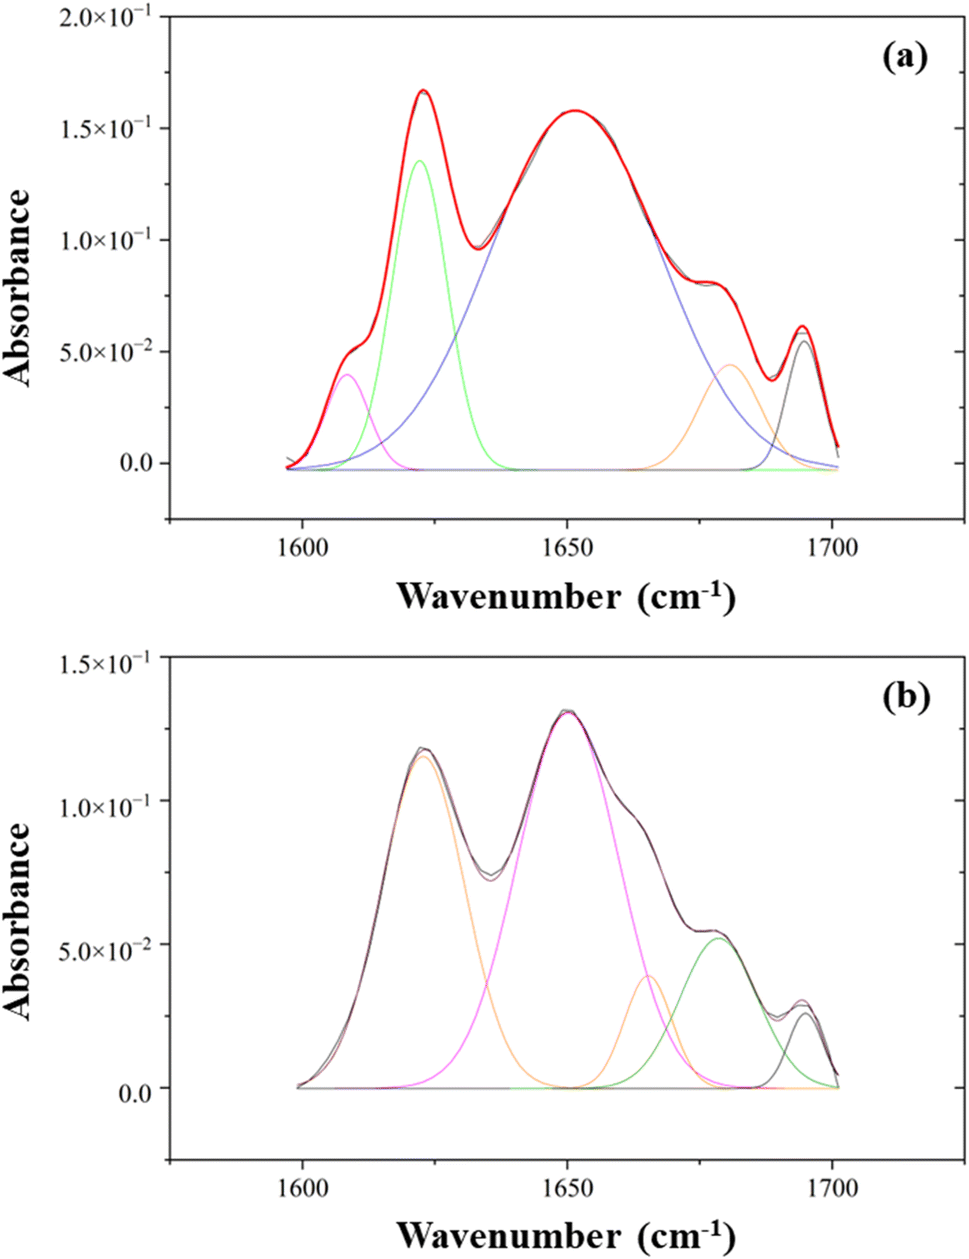
The types of secondary structure include the α-helix, β-sheets, and β-turn, which allow the amides to hydrogen bond effectively with each other. Fig. 6 depicts the peak-fitted spectra of the amide I region of both freeze-dried and SC-CO2-dried proteins. The freeze-dried sorghum proteins showed secondary structures of β-sheet, α-helix, β-turn, and β-sheet at 1622, 1652, 1681, and 1695 cm−1, respectively (Fig. 6a).82 The areas under the curves of these peaks resulted in 23% β-sheet, 66% α-helix, 7% β-turn, and 4% others in the amide I region. Similarly, the SC-CO2-dried proteins exhibited β-sheet, α-helix, β-turn, β-turn, and β-sheet at 1622, 1650, 1665, 1679, and 1695 cm−1, respectively (Fig. 6b). They corresponded to 35% β-sheet, 45% α-helix, and 20% β-turn. As the β-sheet content increases, so does the surface hydrophobicity. In contrast, α-helix content has a negative relationship with surface hydrophobicity.83 The SC-CO2-dried proteins contained a higher ratio of β-sheets (35 vs. 23%) and a lower ratio of α-helix (45 vs. 66%) compared to the freeze-dried proteins, which could have contributed to the differences observed in EAI, CI, and water solubility. The drying at 50 °C with SC-CO2 may have contributed to the decrease in the native α-helix content and the increase in the β-sheet content.84
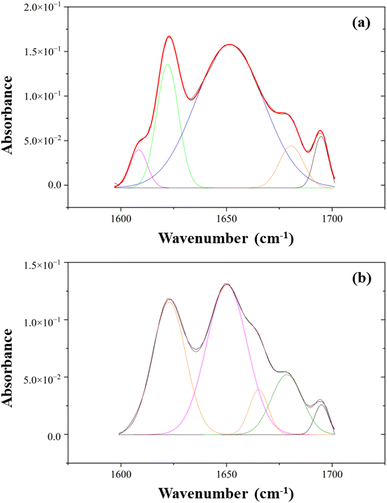 |
| | Fig. 6 The peak-fitted ATR-FTIR spectra of (a) freeze-dried and (b) SC-CO2-dried sorghum proteins in the range of 1600–1700 cm−1. | |
A previous experiment on evaluating the adhesive performance of soy, sorghum, and canola proteins found the major absorbance peaks for sorghum proteins through FTIR, and an amide I band was found at 1652 cm−1, indicating a dominant α-helix secondary structure.38 In a study done on understanding the structure, morphology, and assembly behavior of kafirins, FTIR results indicated that amide I and amide II absorption peaks were located at 1653 and 1541 cm−1, respectively.85 Furthermore, similar ratios of α-helix:β-sheet contents were reported for kafirin-rich protein extracts previously.84
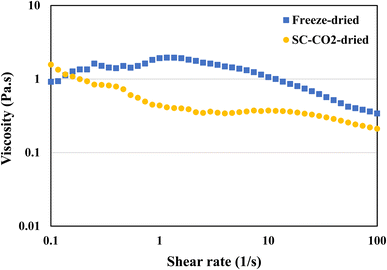
3.9 Viscosity
Viscosity is defined as the measure of a fluid's resistance to flow. Protein's viscosity is affected by various factors, such as surface charge, ionic strength molecule shape, pH, temperature, and shear rate.86 In general, protein viscosity tends to increase with denaturation.87 Furthermore, the concentration of the protein in the solution also has an impact on the viscosity. The viscosity measurements were taken to get a better understanding of the flow behavior of the protein dispersions in water. Fig. 7 is a representation of the viscosities of both freeze-dried and SC-CO2-dried sorghum proteins. The SC-CO2-dried sorghum protein showed a shear thinning behavior, which is similar to the ethanol-extracted sorghum protein adhesive made with 16% concentration.88 On the other hand, freeze-dried sorghum protein exhibited shear thickening behavior at low shear rates (<1 s−1), while shear thinning behavior was observed at higher shear rates (>1 s−1). These observations can be due to the differences in solubilities, crystallinities, particle size, and porosities of the dried proteins.
 |
| | Fig. 7 Viscosity of freeze-dried and SC-CO2-dried sorghum proteins at 20 °C with a pH of 12. | |
3.10 Principle component analysis
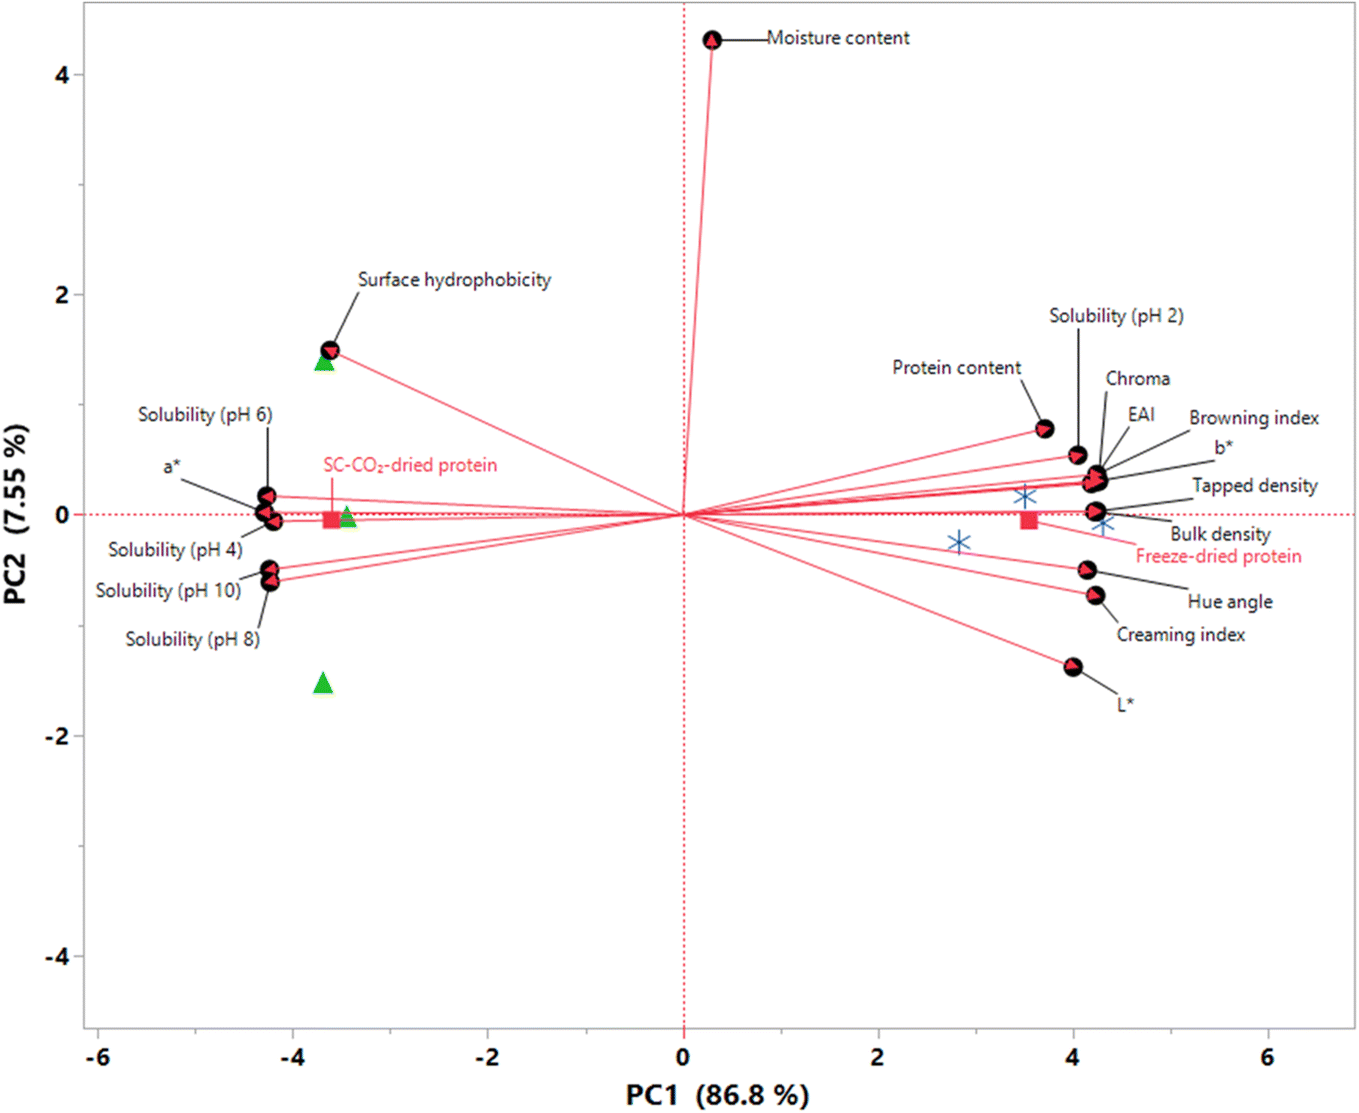
An exploratory PCA was employed to explore the relationships between different quality characteristics, highlighting the key differences between the chemical and physical attributes of the dried protein samples. The results of the PCA are presented as a biplot in Fig. 8, indicating that approximately 94% of the total variability is explained by the first two principal components (PC1 and PC2), which is sufficient to explain the overall variability.89 The samples were clearly separated along the PC1, which explained 86.8% of the total variation. In terms of their PC1 scores, freeze-dried proteins had a score of 3.5518, while SC-CO2-dried proteins showed a score of −3.6027. In other words, all freeze-dried proteins had positive loadings on PC1, whereas those that were SC-CO2-dried showed negative loadings, suggesting that the samples can be grouped based on PC1. On the other hand, both drying methods show almost zero PC2 scores (−0.0529 for freeze-dried and −0.0481 for SC-CO2-dried proteins). Moreover, moisture content had the most significant loading on PC2, along with surface hydrophobicity and L*. Coherently, there were no significant differences in the moisture contents or surface hydrophobicities of the samples, as previously discussed. It is worth highlighting that protein solubilities at different pH values exhibited negative loadings on PC1 except at pH 2.0 since the solubility of freeze-dried proteins was found to be higher than that of SC-CO2-dried ones at this pH value (Fig. 4). It was found that the freeze-dried proteins had a greater bulk and tapped density compared to the SC-CO2-dried proteins, which gave them positive PC1 loads. The color attributes exhibited a similar pattern to the solubilities, where a* was the only color parameter located on the negative side of the PC1 axis. Conversely, b*, L*, hue angle, chroma, and BI exhibited positive PC1 loads.
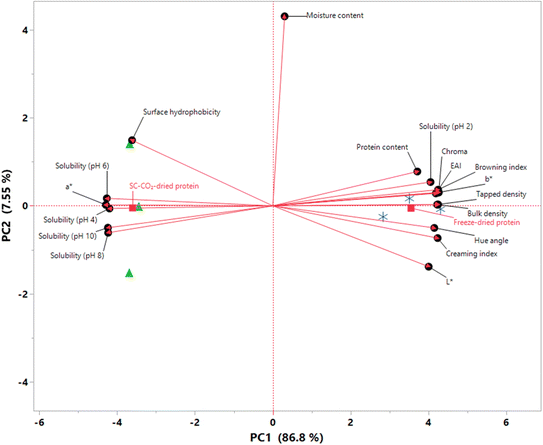 |
| | Fig. 8 PCA score plot (biplot) of SC-CO2-dried ( ) and freeze-dried sorghum proteins ( ) and freeze-dried sorghum proteins ( ) along the first two principal components. ) along the first two principal components. | |
4 Conclusions
The highlight of the research was the development of a novel SC-CO2 drying method to dry sorghum proteins and compare their functional properties with the proteins dried using a conventional drying method, namely freeze-drying. Key properties of both the freeze-dried and SC-CO2-dried sorghum proteins, including morphology, density, crystallinity, surface hydrophobicity, EAI, solubility, chemical structure, and viscosity, were evaluated. Compared to the freeze-dried proteins, the SC-CO2-dried proteins were highly porous and less crystalline (5.3 vs. 8.1%). The bulk and tapped densities of the SC-CO2-dried proteins (0.20 and 0.29 g cm−3, respectively) were significantly lower than that of freeze-dried ones (0.30 and 0.40 g cm−3, respectively). The surface hydrophobicities of the proteins dried with freeze-drying and SC-CO2 were similar (p > 0.05). The EAI of the freeze-dried protein powder (40.6) was higher than that of SC-CO2-dried protein powder (29.8). However, the SC-CO2-dried sorghum proteins showed higher solubility than freeze-dried sorghum proteins at most of the pH values investigated (pHs 4–10). At higher shear rates (>1 s−1), both freeze-dried and SC-CO2-dried proteins exhibited shear-thinning properties. The FTIR data revealed a reduction in the α-helix content and an increase in the β-sheets content of the proteins after SC-CO2 drying. The developed SC-CO2 drying approach has the potential to be used on an industrial scale for generating proteins with better functionality. More in-depth characterizations, such as digestibility and amino acid analysis of the SC-CO2-dried sorghum proteins, may be useful to reveal the whole potential of the SC-CO2 drying.
Author contributions
Nafisa Sadaf: methodology, validation, formal analysis, writing – original draft, visualization. Arda Tuhanioglu: methodology, formal analysis, writing – original draft. Navam Hettiarachchy: methodology, writing – review & editing. Ali Ubeyitogullari: conceptualization, methodology, supervision, validation, writing – review & editing, project administration, funding acquisition, resources.
Conflicts of interest
The authors declare no competing financial interest.
Acknowledgements
We appreciate the financial support by the United Sorghum Checkoff Program. This work was also supported in part by the USDA National Institute of Food and Agriculture, Multistate Project NC1023, Accession number 1025907. We thank Dr Safoura Ahmadzadeh for her help with the SEM and FTIR analyses.
References
- P. Pöri, H. Aisala, J. Liu, M. Lille and N. Sozer, LWT, 2023, 173, 114345 CrossRef.
- S. Langyan, P. Yadava, F. N. Khan, Z. A. Dar, R. Singh and A. Kumar, Front. nutr., 2021, 8, 772573 CrossRef PubMed.
- D. J. A. Jenkins, C. W. C. Kendall, D. Faulkner, E. Vidgen, E. A. Trautwein, T. L. Parker, A. Marchie, G. Koumbridis, K. G. Lapsley, R. G. Josse, L. A. Leiter and P. W. Connelly, Metabolism, 2002, 51, 1596–1604 CrossRef CAS PubMed.
- F. U. Akharume, R. E. Aluko and A. A. Adedeji, Compr. Rev. Food Sci. Food Saf., 2021, 20, 198–224 CrossRef CAS PubMed.
- O. S. Stamenković, K. Siliveru, V. B. Veljković, I. B. Banković-Ilić, M. B. Tasić, I. A. Ciampitti, I. G. Đalović, P. M. Mitrović, V. Š. Sikora and P. V. V. Prasad, Renew. Sust. Energ. Rev., 2020, 124, 109769 CrossRef.
- N. Mtelisi Dube, F. Xu and R. Zhao, Grain Oil Sci. Technol., 2020, 3, 164–171 CrossRef.
- E. M. Shinde, D. B. Gajmal and S. A. Giri, Curr. Res. Food Sci., 2022, 3, 104–108 Search PubMed.
- M. Marchini, A. Marti, C. Folli, B. Prandi, T. Ganino, P. Conte, C. Fadda, M. Mattarozzi and E. Carini, Foods, 2021, 10, 407 CrossRef CAS PubMed.
- J. M. Shull, J. J. Watterson and A. W. Kirleis, J. Agric. Food Chem., 1991, 39, 83–87 CrossRef CAS.
- J. Taylor and J. R. N. Taylor, J. Am. Oil Chem. Soc., 2018, 95, 969–990 CrossRef CAS.
- M. Vetralla, G. Ferrentino, A. Zambon and S. Spilimbergo, Int. J. Food Eng., 2018, 4, 186–190 CrossRef.
- A. M. Ghribi, I. M. Gafsi, C. Blecker, S. Danthine, H. Attia and S. Besbes, J. Food Eng., 2015, 165, 179–188 CrossRef CAS.
- M. Amdadul Haque, A. Putranto, P. Aldred, J. Chen and B. Adhikari, Dry. Technol., 2013, 31, 1532–1544 CrossRef CAS.
- F. Emami, M. Keihan Shokooh and S. J. Mostafavi Yazdi, J. Pharm. Investig., 2023, 53, 35–57 CrossRef CAS PubMed.
- I. Roy and M. N. Gupta, Biotechnol. Appl. Biochem., 2004, 39, 165–177 CrossRef CAS PubMed.
- X. Duan, X. Yang, G. Ren, Y. Pang, L. Liu and Y. Liu, Dry. Technol., 2016, 34, 1271–1285 CrossRef.
- I. Filková and A. S. Mujumdar, in Handbook of Industrial Drying, CRC Press, 2020, pp. 263–307 Search PubMed.
- Y. Shen, X. Tang and Y. Li, Food Chem., 2021, 339, 127823 CrossRef CAS PubMed.
- J. W. Sim, H. Lee, S. Jo, S. Oh, S. Kim and D. R. Kim, Case Stud. Therm. Eng., 2023, 49, 103218 CrossRef.
- J. T. Pinto, E. Faulhammer, J. Dieplinger, M. Dekner, C. Makert, M. Nieder and A. Paudel, Dry. Technol., 2021, 39, 1415–1446 CrossRef CAS.
- R. Span and W. Wagner, J. Phys. Chem. Ref. Data, 1996, 25, 1509–1596 CrossRef CAS.
- A. Tuhanioglu and A. Ubeyitogullari, ACS Food Sci. Technol., 2022, 2, 1879–1887 CrossRef CAS.
- S. Kaur and A. Ubeyitogullari, Heliyon, 2023, 9(3), e14196 CrossRef CAS PubMed.
- A. Ubeyitogullari and S. S. H. Rizvi, Food Funct., 2020, 11, 10506–10518 RSC.
- N. Smigic, I. Djekic, N. Tomic, B. Udovicki and A. Rajkovic, Br. Food J., 2019, 121, 815–834 CrossRef.
- Z. K. Brown, P. J. Fryer, I. T. Norton, S. Bakalis and R. H. Bridson, Innovative Food Sci. Emerging Technol., 2008, 9, 280–289 CrossRef CAS.
- I. Djekic, N. Tomic, S. Bourdoux, S. Spilimbergo, N. Smigic, B. Udovicki, G. Hofland, F. Devlieghere and A. Rajkovic, LWT, 2018, 94, 64–72 CrossRef CAS.
- A. Bušić, A. Vojvodić, D. Komes, C. Akkermans, A. Belščak-Cvitanović, M. Stolk and G. Hofland, Food Res. Int., 2014, 64, 34–42 CrossRef PubMed.
- L. Fiori, Chem. Eng. Process.: Process Intensif., 2010, 49, 866–872 CrossRef CAS.
- E. Khalati, P. Oinas and L. Favén, J. CO2 Util., 2023, 74, 102547 CrossRef CAS.
- A. Ubeyitogullari, S. Ahmadzadeh, G. Kandhola and J.-W. Kim, Compr. Rev. Food Sci. Food Saf., 2022, 21, 4610–4639 CrossRef CAS PubMed.
- A. Ubeyitogullari and O. N. Ciftci, Carbohydr. Polym., 2016, 147, 125–132 CrossRef CAS PubMed.
- A. Ubeyitogullari, S. Brahma, D. J. Rose and O. N. Ciftci, J. Agric. Food Chem., 2018, 66, 9490–9497 CrossRef CAS PubMed.
- Z. Ulker and C. Erkey, J. Controlled Release, 2014, 177, 51–63 CrossRef CAS PubMed.
- S. Ahmadzadeh and A. Ubeyitogullari, Carbohydr. Polym., 2023, 301, 120296 CrossRef CAS PubMed.
- L. Wang, C. L. Weiler and K. T. Hwàng, ASAE Annual International Meeting, 2005, 057054 Search PubMed.
- R. Sahu, P. Kundu and A. Sethi, LWT, 2021, 146, 111376 CrossRef CAS.
- J. Li, H. Lin, S. R. Bean, X. S. Sun and D. Wang, Ind. Crops Prod., 2020, 157, 112898 CrossRef CAS.
- S. Bean, B. Ioerger, S. Park and H. J. Singh, Cereal Chem., 2006, 83, 99–107 CrossRef CAS.
- S. Ahmadzadeh and A. Ubeyitogullari, Carbohydr. Polym., 2023, 301, 120296 CrossRef CAS PubMed.
- A. Tuhanioglu, S. Lafontaine and A. Ubeyitogullari, Future Foods, 2023, 8, 100253 CrossRef CAS.
- A. Mohammadi, S. Rafiee, Z. Emam-Djomeh and A. Keyhani, World j. agric. sci., 2008, 4, 376–383 Search PubMed.
- R. Gopirajah, P. Singha, S. Javad and S. Rizvi, J. Food Process. Preserv., 2020, 44, e14754 CAS.
- H. Amoura, H. Mokrane and B. Nadjemi, J. Food Sci. Technol., 2020, 57, 1100–1109 CrossRef CAS PubMed.
- M. N. Afizah and S. Rizvi, LWT, 2014, 57, 290–298 CrossRef.
- A. E. O. Elkhalifa and R. Bernhardt, Food Chem., 2010, 121, 387–392 CrossRef CAS.
- P. Musigakun and M. J. A. Thongngam, N. Resources, 2007, 41, 313–318 Search PubMed.
- C. K. Gehring, J. C. Gigliotti, J. S. Moritz, J. C. Tou and J. Jaczynski, Food Chem., 2011, 124, 422–431 CrossRef CAS.
- S. R. Bean, J. D. Wilson, R. A. Moreau, A. Galant, J. M. Awika, R. C. Kaufman, S. L. Adrianos and B. P. Ioerger, in Sorghum, 2019, pp. 173–214, DOI:10.2134/agronmonogr58.c9.
- C. Gao, J. Taylor, N. Wellner, Y. B. Byaruhanga, M. L. Parker, E. C. Mills and P. S. Belton, J. Agric. Food Chem., 2005, 53, 306–312 CrossRef CAS PubMed.
- L. Lili, W. Huan, R. Guangyue, D. Xu, L. Dan and Y. Guangjun, Int. J. Agric. Biol. Eng., 2015, 8, 116–123 Search PubMed.
- Q. Zhao, H. Xiong, C. Selomulya, X. D. Chen, S. Huang, X. Ruan, Q. Zhou and W. Sun, Food Bioprocess Technol., 2013, 6, 1759–1769 CrossRef CAS.
- J. Taylor, J. R. Taylor, P. S. Belton and A. Minnaar, J. Cereal Sci., 2009, 50, 99–105 CrossRef CAS.
- C. Gao, J. Taylor, N. Wellner, Y. B. Byaruhanga, M. L. Parker, E. N. C. Mills and P. S. Belton, J. Agric. Food Chem., 2005, 53, 306–312 CrossRef CAS PubMed.
- J. Xiao, Y. Chen and Q. J. F. Huang, Food Funct., 2017, 8, 1402–1413 RSC.
- J. Taylor, J. R. Taylor, P. S. Belton and A. Minnaar, J. Agric. Food Chem., 2009, 57, 7523–7528 CrossRef CAS PubMed.
- P. Quintanilla, M. C. Beltrán, A. Molina, I. Escriche and M. P. Molina, J. Dairy Sci., 2019, 102, 2941–2953 CrossRef CAS PubMed.
- W. Mo, F. Kong, K. Chen and B. Li, Wood Sci. Technol., 2022, 56, 867–882 CrossRef CAS.
- S. Tang, J. Li, G. Huang and L. Yan, Protein Pept. Lett., 2021, 28, 938–944 CAS.
- S. Hyde, B. W. Ninham, S. Andersson, K. Larsson, T. Landh, Z. Blum and S. Lidin, in The Language of Shape, ed. S. Hyde, B. W. Ninham, S. Andersson, K. Larsson, T. Landh, Z. Blum and S. Lidin, Elsevier Science B.V., Amsterdam, 1997, pp. 87–140, DOI:10.1016/B978-044481538-5/50004-6.
- L. Jiang, Z. Wang, Y. Li, X. Meng, X. Sui, B. Qi and L. Zhou, Int. J. Food Prop., 2015, 18, 1059–1074 CrossRef CAS.
- D. G. Dalgleish, Food Hydrocolloids, 2006, 20, 415–422 CrossRef CAS.
- A. Ubeyitogullari and S. Rizvi, Food Funct., 2020, 11, 10506–10518 RSC.
- T. Zhang, B. Jiang, W. Mu and Z. Wang, Food Hydrocolloids, 2009, 23, 146–152 CrossRef CAS.
- M. Qi, N. Hettiarachchy and U. Kalapathy, J. Food Sci., 1997, 62, 1110–1115 CrossRef CAS.
- J. D. Firebaugh and C. R. Daubert, Int. J. Food Prop., 2005, 8, 243–253 CrossRef CAS.
- S. Javad, R. Gopirajah and S. S. H. Rizvi, J. Food Process Eng., 2019, 42, e13183 CrossRef.
- W. H. Teklehaimanot and M. N. Emmambux, Food Hydrocoll., 2019, 97, 105221 CrossRef CAS.
- J. E. Wohlt, C. J. Sniffen and W. H. Hoover, J. Dairy Sci., 1973, 56, 1052–1057 CrossRef CAS.
- T.-H. Mu, S.-S. Tan, J.-W. Chen and Y.-L. Xue, J. Sci. Food Agric., 2009, 89, 337–342 CrossRef CAS.
- N. T. T. Ngo and F. Shahidi, Food Prod. Process. Nutr., 2021, 3, 31 CrossRef CAS.
- A. Ubeyitogullari and O. N. Ciftci, Sci. Rep., 2019, 9, 19112 CrossRef CAS PubMed.
- S. A. Elsohaimy, T. M. Refaay and M. A. M. Zaytoun, Ann. Agric. Sci., 2015, 60, 297–305 CrossRef.
- İ. Tontul, Z. Kasimoglu, S. Asik, T. Atbakan and A. Topuz, Int. J. Biol. Macromol., 2018, 109, 1253–1259 CrossRef PubMed.
- M. Du, J. Xie, B. Gong, X. Xu, W. Tang, X. Li, C. Li and M. Xie, Food Hydrocolloids, 2018, 76, 131–140 CrossRef CAS.
- X.-Y. Dong, L.-L. Guo, F. Wei, J.-F. Li, M.-L. Jiang, G.-M. Li, Y.-D. Zhao and H. Chen, J. Sci. Food Agric., 2011, 91, 1488–1498 CrossRef CAS PubMed.
- M. Immonen, J. Myllyviita, T. Sontag-Strohm and P. Myllärinen, Foods, 2021, 10, 3050 CrossRef CAS PubMed.
- J. R. Wagner, D. A. Sorgentini and M. C. Añón, J. Agric. Food Chem., 2000, 48, 3159–3165 CrossRef CAS PubMed.
- I. Paraman, N. S. Hettiarachchy, C. Schaefer and M. I. Beck, Cereal Chem., 2007, 84, 343–349 CrossRef CAS.
- N. J. De Mesa-Stonestreet, S. Alavi and S. R. Bean, J. Food Sci., 2010, 75, R90–R104 CrossRef PubMed.
- A. A Bunaciu, S. Fleschin and H. Y. Aboul-Enein, Curr. Anal. Chem., 2014, 10, 132–139 CrossRef.
- H. Yang, S. Yang, J. Kong, A. Dong and S. Yu, Nat. Protoc., 2015, 10, 382–396 CrossRef CAS PubMed.
- C. Wang, L. Jiang, D. Wei, Y. Li, X. Sui, Z. Wang and D. Li, Procedia Eng., 2011, 15, 4819–4827 CrossRef CAS.
- J. Espinosa-Ramírez and S. O. Serna-Saldívar, J. Cereal Sci., 2016, 70, 57–65 CrossRef.
- J. Xiao, Y. Li, J. Li, A. P. Gonzalez, Q. Xia and Q. Huang, J. Agric. Food Chem., 2015, 63, 216–224 CrossRef CAS PubMed.
- Z. Zhang and Y. Liu, Curr. Opin. Chem. Eng., 2017, 16, 48–55 CrossRef.
- M. L. Anson and A. E. Mirsky, J. Gen. Physiol., 1932, 15, 341–350 CrossRef CAS PubMed.
- N. Li, Y. Wang, M. Tilley, S. R. Bean, X. Wu, X. S. Sun and D. Wang, J. Polym. Environ., 2011, 19, 755–765 CrossRef CAS.
- I. D. Boateng, D. A. Soetanto, X.-M. Yang, C. Zhou, F. K. Saalia and F. Li, J. Food Process Eng., 2021, 44, e13655 CrossRef CAS.
|
| This journal is © The Royal Society of Chemistry 2024 |

 Open Access Article
 This Open Access Article is licensed under a Creative Commons Attribution-Non Commercial 3.0 Unported Licence
 *ab
*ab


 ) and freeze-dried sorghum proteins (
 ) along the first two principal components.