
 Open Access Article
 This Open Access Article is licensed under a Creative Commons Attribution-Non Commercial 3.0 Unported Licence
Solute-particle separation in microfluidics enhanced by symmetrical convection†
Yurou Yaoa,
Yao Lina,
Zerui Wua,
Zida Li b,
Xuemei Hec,
Yun Wuc,
Zimin Sun*c,
Weiping Ding*d and
Liqun He*a
b,
Xuemei Hec,
Yun Wuc,
Zimin Sun*c,
Weiping Ding*d and
Liqun He*a
aDepartment of Thermal Science and Energy Engineering, University of Science and Technology of China, Hefei 230026, China. E-mail: heliqun@ustc.edu.cn
bDepartment of Biomedical Engineering, Medical School, Shenzhen University, Shenzhen 518060, China
cDepartment of Hematology, The First Affiliated Hospital of University of Science and Technology of China, Hefei 230001, China. E-mail: zmsun@ustc.edu.cn
dDepartment of Electronic Engineering and Information Science, University of Science and Technology of China, Hefei 230026, China. E-mail: wpdings@ustc.edu.cn
First published on 8th January 2024
Abstract
The utilization of microfluidic technology for miniaturized and efficient particle sorting holds significant importance in fields such as biology, chemistry, and healthcare. Passive separation methods, achieved by modifying the geometric shapes of microchannels, enable gentle and straightforward enrichment and separation of particles. Building upon previous discussions regarding the effects of column arrays on fluid flow and particle separation within microchips, we introduced a column array structure into an H-shaped microfluidic chip. It was observed that this structure enhanced mass transfer between two fluids while simultaneously intercepting particles within one fluid, satisfying the requirements for particle interception. This enhancement was primarily achieved by transforming the originally single-mode diffusion-based mass transfer into dual-mode diffusion-convection mass transfer. By further optimizing the column array, it was possible to meet the basic requirements of mass transfer and particle interception with fewer microcolumns, thereby reducing device pressure drop and facilitating the realization of parallel and high-throughput microfluidic devices. These findings have enhanced the potential application of microfluidic systems in clinical and chemical engineering domains.
Introduction
In fields such as biology, medicine, and chemical engineering, the separation and purification of target particles or cells from complex mixtures are essential.1,2 Traditional particle separation, focusing, and sorting methods, such as centrifugation, magnets, filters, etc., offer real-time control and high reliability but are time-consuming and operationally complex.3–5 Microfluidic technology possesses advantages such as miniaturization, high efficiency, and low energy consumption.6–8 It enables the handling of liquid samples ranging from nanoliters to milliliters.Microfluidic sorting technology can be classified into active systems and passive systems. Active systems rely on external force fields and are primarily categorized into electrical9–11 (high reliability), acoustic12–15 (rapid and precise spatial control), optical16–18 (precise manipulation, low power consumption), and magnetic19–21 (strong specificity, fast response). However, these active systems suffer from drawbacks such as low throughput, large footprint of external instruments, complex operation, and high costs.22 Moreover, their efficacy depends on the magnitude of the applied force,23 which can potentially impact the functionality and structure of cells.
Passive systems, on the other hand, eliminate the need for bulky external devices and rely on the geometric shapes of microchannels and the characteristics of microfluidics. Examples include inertial focusing,24–26 hydrodynamic focusing,27 deterministic lateral displacement (DLD),28–30 microfiltration,31,32 and others. These passive systems offer simplicity of operation and low energy consumption.33–36 By utilizing the designed microchannel structures, cells are not affected by chemical components or subjected to physical damage, thereby preserving their viability. Furthermore, the miniaturized operating platform facilitates chip parallelization,37,38 leading to increased throughput and improved efficiency.
Some literature has discussed the columnar structures within microchips, highlighting their high throughput, efficiency, and ease of fabrication. For instance, H. M. Ji et al.39 compared the capabilities of weir-type, column-type, cross-flow, and membrane-based microfilters for separating white blood cells and red blood cells in whole blood. They found that the columnar structure exhibited higher throughput, while the adoption of cross-flow reduced the issue of cell clogging. Zheng et al.40 studied the wake shape of fluid flowing through different shaped microcolumns and found that a cell-free layer formed near the microcolumn structure, which helped to intercept the flow of cells on one side of the flow path.
Fluid flow in microchannels typically occurs in a laminar manner, and mass transfer primarily relies on diffusion.41 By introducing complex structures within the channels, it is possible to overcome the limitations imposed by diffusion on mass transfer.42,43 H. Amini et al.44 analyzed the complex flow patterns made by stream deformation about a series of single cylinders in a microfluidic channel. Compared to other shapes, cylindrical bodies facilitate the recombination of fluid after splitting, thereby promoting transverse mass transfer.
In this study, we incorporated a column array into an H-shaped microfluidic chip and observed that compared to the column-free configuration, the column array enhanced convective mass transfer between two fluids while simultaneously capturing particles within one fluid, thereby enabling particle collection and purification. By further optimizing the positions and quantities of the columns, it was possible to reduce the number of microcolumns while still satisfying the requirements of mass transfer and particle interception, thereby lowering device pressure drop and promoting stable operation. Finally, experimental validation was conducted to assess the optimized column array's mass transfer capability and particle interception performance. Building upon the concept of incorporating column arrays, the construction of a multichannel parallel microfluidic network has the potential to further enhance device throughput, thus expanding the application prospects of microfluidic systems in clinical and chemical engineering domains.
Theory and model
In a common H-type microfluidic chip, two fluids with high and low concentrations flow in from the two inlets of the chip. The flow state of the fluid is determined by the Reynolds number,45 which is a dimensionless parameter and is calculated by the ratio of inertia force to viscous force.
 | (1) |
Diffusive mass transfer follows Fick's law and for the transport of component 1 in a binary mixture of solutions 1 and 2 there are:
 | (2) |
 | (3) |
The concentration difference between the two fluid interfaces drives the diffusive mass transfer, with a larger concentration difference favoring more efficient mass transfer. However, as flow and mass transfer proceed, the concentration difference between the two fluids gradually decreases, resulting in a decline in the level of mass transfer. The addition of a column array at the interface of the two fluids causes the flow of the two fluids to produce a lateral component, and the mass transfer mode changes from a single diffusion mode to a binary mode involving diffusion and convection. The basic equation for convection mass transfer is:
| n1 = kc1ΔC1 | (4) |
To examine the impact of a column on the mass transfer of two fluids, two models were employed: one with a column present in the mass transfer section and one without. The dimensions of the mass transfer section and the positioning of the column in the model are illustrated in Fig. S1(a).† Comsol Multiphysics was utilized to simulate the flow and mass transfer of the two fluids in the models with/without a column, respectively. For consistency, a concentration of 10 mol m−3 and 0 mol m−3 solution were used as the inputs for the sample solution and pure water, respectively, at a flow rate of 10 μl min−1. The diffusion coefficient of solute was set to 1.2 × 10⁻⁹ m2 s−1 (standard condition). Uniform velocity and concentration boundary conditions were applied to the inlets, while static pressure conditions were used for the two outlets. By coupling the laminar flow physical field with the dilute matter transfer physical field, the concentration distributions in the transfer section of the two models were obtained using a very fine triangular mesh division, as depicted in Fig. 1(b).
 | ||
| Fig. 1 Facilitation of mass transfer using one column. (a) Schematic diagram of the chip. (b) Simulation results of the concentration distribution in the mass transfer section without/with a column. (c) The variation of the sample-side solute concentration with the mass transfer length for different models. | ||
The intersection point of the two fluids in the mass transfer section was set as the zero point, with the length and width of the mass transfer section serving as the horizontal and vertical coordinates, respectively. The positive x-axis direction represented the flow direction of the fluid, while the positive y-axis direction indicated the direction from the sample side to the water side. Multiple transverse intercepts were taken at the sample side of the mass transfer section, and the average concentration of the intercept was calculated to obtain the variation of the sample-side solute concentration with the length of the mass transfer section, as shown in Fig. 1(c).
For the model without a column in Fig. 1(c), the removal rate of small molecules initially increases and then decreases with the length of the flow channel, and the position of the turning point is 0.6 mm. This phenomenon is attributed to the greater concentration difference between the two fluids in the inlet section, which results in a stronger driving force for diffusion,48 leading to a higher removal rate of small solute molecules. However, as diffusive mass transfer progresses, the concentration difference between the two fluids near the flow interface gradually diminishes, thereby weakening the mass transfer driving force and causing a decline in the removal rate of small solute molecules.
As demonstrated in Fig. 1(c), the removal of small molecules from the outlet sample is 24.53% in the model without a column. However, after adding a column in the middle of the flow channel, the removal of small molecules increases to 27.65%, representing a 3.12% improvement. The presence of the column creates a perturbation at the fluid interface, which drives the lateral migration of small molecules from the sample to the water.49
The column divides the two fluids and the two fluids increase the flow rate due to the constriction of the flow channel, as shown in Fig. S2(c).† The two fluids increased the velocity component in the lateral direction after passing through the column, resulting in the lateral migration of small solute molecules towards the water side. Compared with the model without column, the convection flux (y-component) of solute moving from sample side to water side before and after the column is significantly increased, as shown in Fig. S2(d).† Fig. S3(b)† shows the concentration distribution in the y direction at the outlet of the mass transfer section of the two models. It can be seen that the slope of the curve becomes smaller and the mass transfer effect becomes better after the addition of the column.
Further, the diffusion coefficient was increased by a factor of ten or decreased by a factor of one-tenth to obtain the removal rates of small molecules in the effluent samples from the model without column and with one column, as shown in Table 1.
| Diffusion coefficient | Clearance rate | |
|---|---|---|
| W/0 column | W/1 column | |
| D = 1.2 × 10⁻⁸ | 45.50% | 45.61% |
| D = 1.2 × 10⁻⁹ | 24.24% | 27.36% |
| D = 1.2 × 10⁻¹⁰ | 19.67% | 23.67% |
The results indicate that a higher diffusion coefficient leads to improved mass transfer efficiency. The impact of diffusion coefficient variation is more significant in the columnless model, primarily due to the longer diffusion length in this model. A smaller diffusion coefficient highlights the more pronounced promoting effect of the column array on mass transfer, indicating a higher contribution of convective mass transfer.
Effect of column spacing on mass transfer
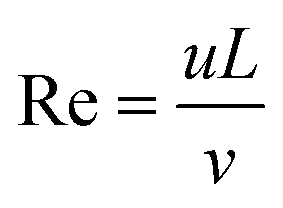
Enhancing convective mass transfer is a fundamental approach to improve mass transfer efficiency. The addition of a column array with equal spacing in the mass transfer section can periodically perturb the flow interface and significantly enhance mass transfer between the two fluids. Fig. 2(a) illustrates the mass transfer section with different numbers of columns, with detailed dimensions provided in Fig. S1(b).† The solute concentration distribution near the outlet of each model was obtained via numerical simulation, as depicted in Fig. 2(b).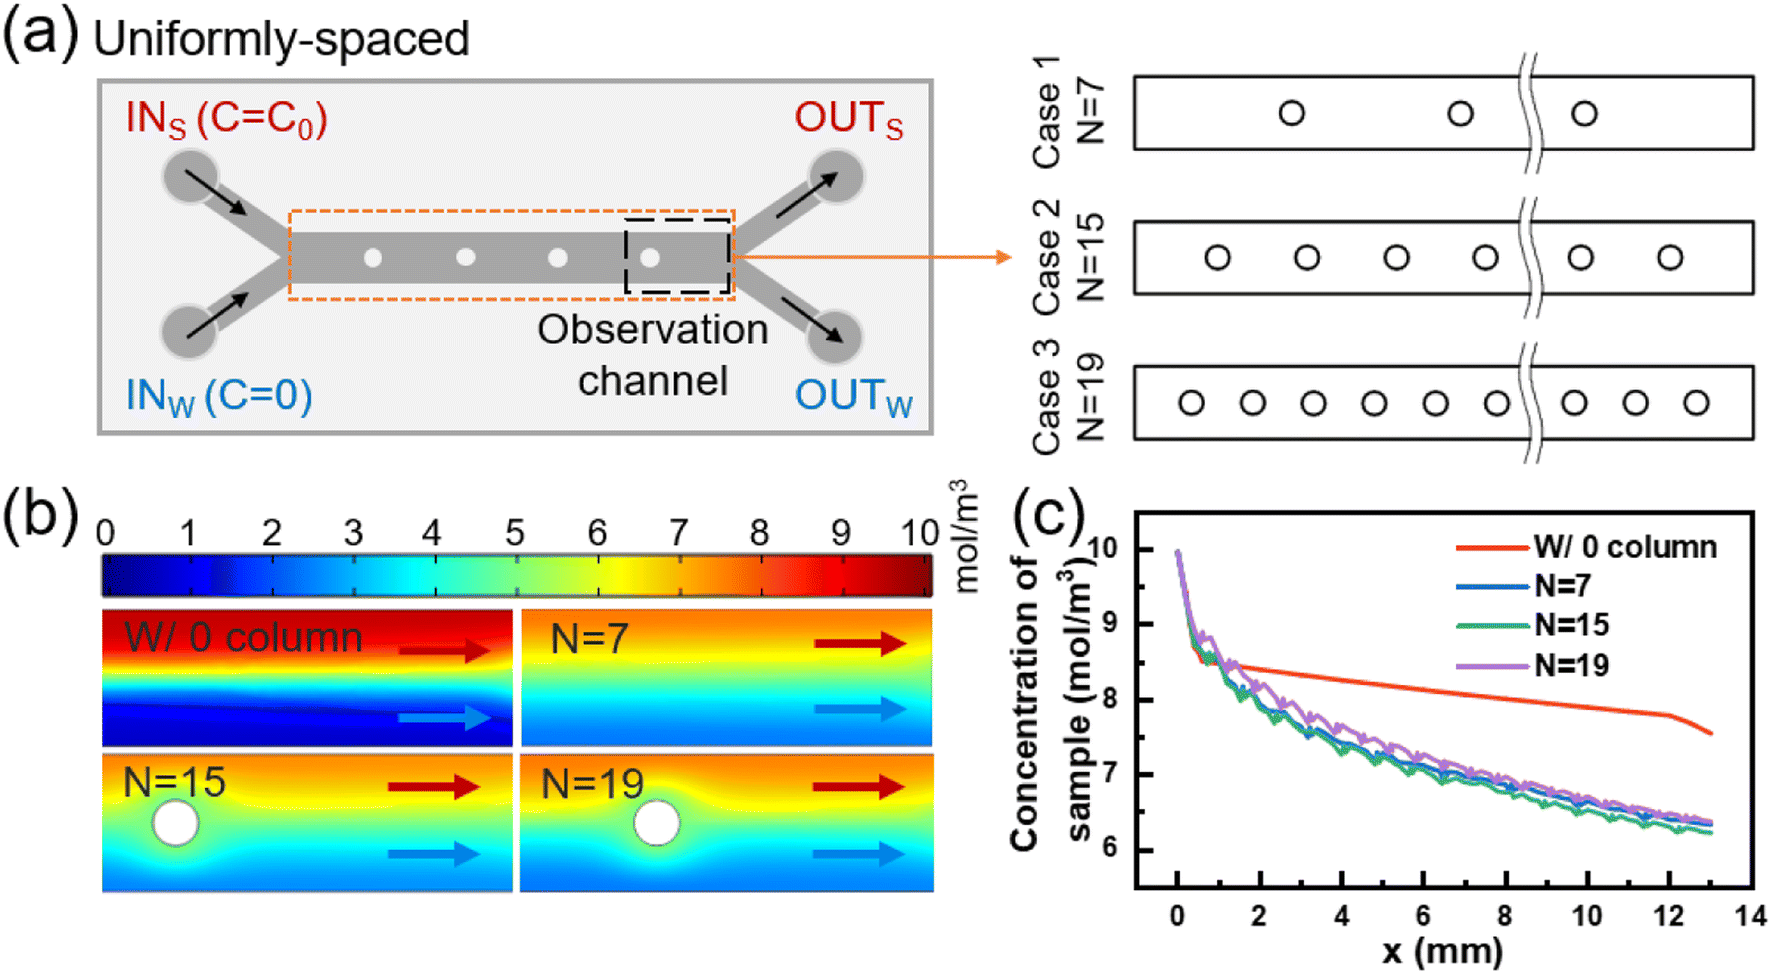 | ||
| Fig. 2 Effect of column spacing on mass transfer. (a) Schematic diagram of the chip. (b) Simulation results of the concentration distribution near the model outlet for different column spacing. (c) Variation of the sample-side solute concentration with mass transfer length for different column spacing. | ||
Fig. 2(c) displays the variation of sample-side solute concentration along the mass transfer section with different column spacings. For column spacings of 1537.5 μm, 718.75 μm, and 555 μm, the number of columns in the array was 7, 15, and 19, respectively. Compared with the model without a column, the small molecule clearance of sample at the outlet increased by 12.15%, 13.21%, and 11.74%, respectively. In Fig. S3(c),† it is also obvious that the longitudinal distribution of concentration at the model outlet becomes smoother after the column array is added. The incorporation of a column array reduces the effective length of solute diffusion and sacrifices a portion of the diffusive mass transfer. However, it increases convective mass transfer and ultimately enhances mass transfer efficiency.
However, reducing the column spacing does not always result in an increase in mass transfer efficiency. When the column spacing is reduced from 1537.5 μm to 718.75 μm, the number of columns increases from 7 to 15, and the removal of small molecules from the outlet sample only increased by 1.06%. This is mainly due to the fact that all columns are located after the start of diffusive mass transfer deterioration, resulting in a limited reduction in the length of diffusion, and the gain from convective mass transfer is greater than the loss from diffusive mass transfer, leading to an overall increase in mass transfer. Further reducing the column spacing from 718.75 μm to 555 μm and increasing the number of columns from 15 to 19, the small molecule removal from the outlet sample decreased by 1.47% instead. This is because the first column in the equal column spacing model with d = 555 μm (n = 19) is located at 605 μm, which interferes with the two fluids upstream in the efficient section of diffusive mass transfer. Compared to the model with n = 15, the additional four columns could not provide sufficient incremental convective mass transfer to compensate for the diffusive mass transfer loss caused by the first column.
In conclusion, adding a column array behind the efficient diffusive mass transfer section (1–0.6 mm) can significantly enhance convective mass transfer between the two fluids and reduce the loss of diffusive mass transfer. However, varying the column spacing in the column array with equal column spacing has a limited impact on the mass transfer results. Furthermore, regardless of the column spacing, both diffusive and convective mass transfer between the two fluids gradually decrease over time, implying that the promoting effect of subsequently added columns on mass transfer is gradually weakened. Thus, it is essential to redefine the position and number of columns in order to fully leverage their potential and maximize their impact on mass transfer efficiency.
Optimization of column position
At the initial contact between the two fluids, the concentration difference near the interface is significant, resulting in a high mass transfer rate where small molecules can easily diffuse from the sample side to the water side. As the concentration difference near the interface decreases, the mass transfer rate through diffusion of small molecules decreases as well. At this point, adding a column at the interface can create a lateral velocity component after fluid flows through the column, thereby enhancing mass transfer efficiency.As shown in Fig. 1(c), the diffusive mass transfer effect begins to deteriorate significantly at a mass transfer section length of 0.6 mm in the model without a column. Since the presence of columns interferes with the diffusive mass transfer of the two upstream fluids (e.g., the first column of Case 3 in Fig. 2(c)), the center position of the first column circle was set as (0.8, 0) (unit: mm).
Using a similar approach, the positions of columns in the mass transfer section were determined one by one. Eventually, the transverse coordinates of the five circle centers were obtained as 0.8, 1.9, 5.2, 6, and 6.8 mm, respectively, resulting in an optimized model with different column spacing (Fig. 3(a)). The detailed dimensions of the optimized model are presented in Fig. S1(c).† Simulation was conducted to obtain the concentration distributions near the inlet of the mass transfer section and each column of the optimized model, as depicted in Fig. 3(b).
 | ||
| Fig. 3 Effect of column position on mass transfer. (a) Schematic diagram of the optimized column model. (b) Simulation results of the sample-side solute concentration distribution within the optimized column model. (c) Variation of the sample-side solute concentration along the mass transfer length after adding columns one by one. (d) Variation of the total mass transfer flux along the mass transfer length after adding columns one by one. | ||
Fig. 3(c) presents the changes in sample-side solute concentration along the length of channel after sequentially adding five columns. The removal of small molecules from sample at the outlet of the optimized model is 33.69%, which represents a 9.16% increase compared to the model without column (24.53%). Compared with the model with medium column spacing in Fig. 2, the optimized model with different column spacing only reduces the removal rate of molecules in the sample by 2–4%. The results show that the pressure drops of the 15- and 19-column equal column spacing models are 126 Pa and 136 Pa, respectively, and the pressure drop of the optimized model with different column spacing is 99 Pa, which is 21.43% and 27.21% lower than the previous two models, respectively. Therefore, by redesigning the column positions, the number of columns contained in the column array can be reduced, and the pressure drop within the model can be reduced while meeting the mass transfer requirements to ensure the safe operation of the device.
Fig. 3(d) illustrates the changes in total mass transfer flux between the two fluids with the length of the channel after adding five columns sequentially. The mass transfer flux increases rapidly after each column is added, which belongs to the increment of convective mass transfer flux. The total diffusion flux from sample to water in the mass transfer section without columns is 61.98 mol (m2 s)−1. The addition of the 1st to 5th columns in the optimized column array results in increments of total mass transfer flux of 2.61, 3.11, 2.09, 2.79, and 1.8 mol (m2 s)−1, respectively. As shown in Fig. 3(c), the optimized column array exhibits incremental removal of small molecules of 1.92%, 3.87%, 1.29%, 1.8%, and 0.28% caused by the 1st to 5th columns, respectively. The corresponding longitudinal concentration distribution at the outlet is shown in Fig. S3(d).†
The first column in the optimized column array disturbs the flow interface of the two fluids and enhances the convective mass transfer flux between them, but does not cause strong mixing of the two fluids. As the fluids continue to flow through the 2nd, 3rd, and 4th columns, the perturbations of the column array superimpose and the mass transfer flux continues to increase. However, the fifth column did not significantly promote solute migration, because the concentration interface between the two fluids becomes increasingly blurred with the mass transfer process, and the driving force of diffusion mass transfer decreased. At the same time, after passing through the column, in addition to the solute of the sample side will move laterally to the water side, similarly, a part of the solute originally entered the water side will also enter the sample side. In other words, the promotion of solute migration from the high concentration side to the low concentration side by the columns is only apparent when convection between the two fluids occurs at the high and low concentration boundary. Continuing to increase the number of columns would not significantly promote convective mass transfer and would sacrifice diffusion area. Therefore, the number of columns in the optimized column array is determined to be five.
Effect of column array on particle interception
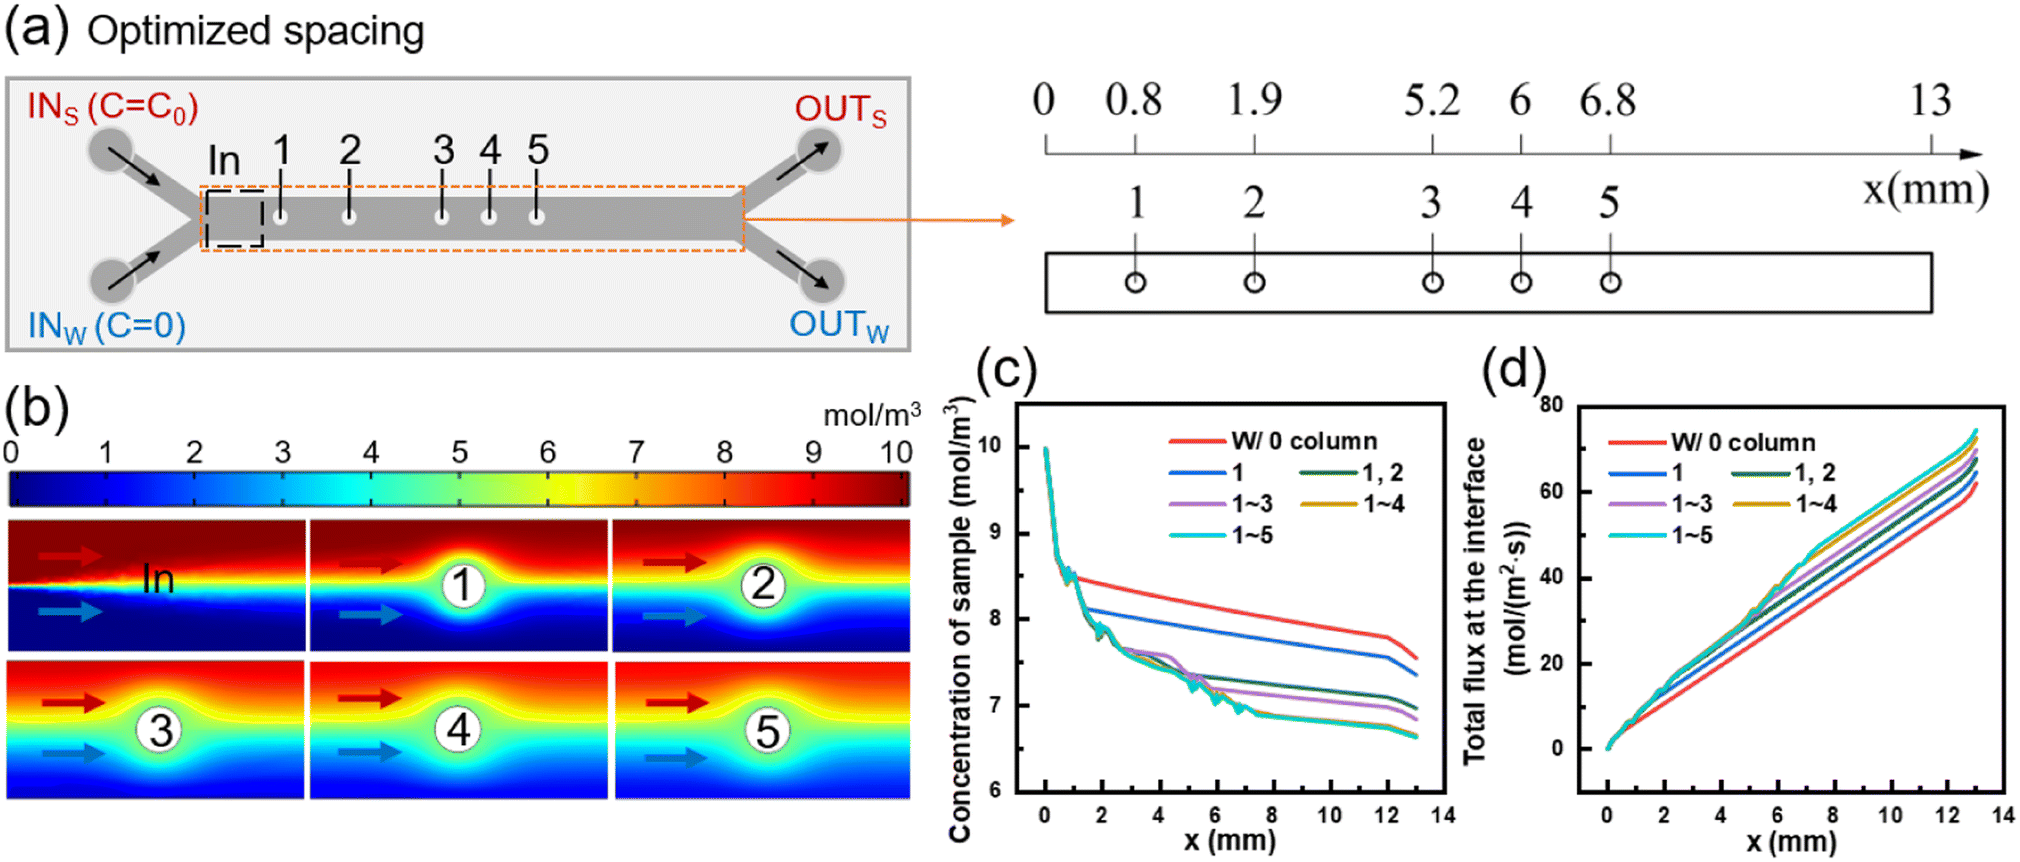
The flow of particles in both the columnless and optimized models was simulated using COMSOL Multiphysics. In the simulation, spherical particles with a diameter of 10 μm (5 particles released every 0.05 s from 0 to 5 s) were introduced into one inlet, while pure water was introduced into the other inlet. The particle distribution in the two models was obtained by simulation, as shown in Fig. 4(b). In the columnless model, particles gradually move towards the center of the flow channel after entering the main flow channel with the fluid and converging with another fluid. This results in some particles being easily lost to the fluid on the other side and ultimately being lost from the outlet. Near the inlet of the optimized model, when particles flow through the columns, particles near the center of the flow channel collide with the columns and are bounced back towards the sidewall. Other particles are gathered by the constricted flow channel, causing them to move towards the sidewall as a whole. From 3 to 5 s, five pictures were superimposed to obtain a composite picture of particle distribution in the optimized model, as shown in Fig. 4(c). | ||
| Fig. 4 Particle interception by column arrays. (a) Chip diagram. (b) Simulation results of particle flow near the inlet and outlet of the columnless model and optimized model at 3 s. (c) Simulation results of particle distribution at the inlet, outlet and behind each column of the optimized model (superimpose five pictures in 3–5 s). (d) Particle number percentage vs. time of different model. (e) Distribution of particles at the outlet of the two models. (f) Distribution of particles along the main channel of the optimized model. | ||
The number of particles was counted at the outlet of the sample side of two models, respectively, and their percentage of the total number of particles flowing out of the mass transfer section was obtained as a function of time, as shown in Fig. 4(d). When the flow was stable, the percentage of particles flowing out from the sample side in the columnless model ranged from 62.5% to 65.3%. After adding the column array to the main flow channel, the percentage of particles flowing out from the sample side increased to approximately 95.5%.
Fig. 4(e) shows the distribution of particles at the outlet of the main flow channel of two models, with the density profile of particles along the flow channel width direction (y-axis) shown in the margins. For the columnless chip, the peak density of particles is located at 39.93 μm (y-direction), and the distribution range of particles is −24.13–143.71 μm. After adding the column array, the peak density is located at 111.96 μm, which is shifted 72.03 μm toward the sidewall, and the distribution range of particles is reduced to 86.3–137.67 μm. These results indicate that the column array effectively intercepted the particles.
Fig. 4(f) displays the distribution of 10 μm particles near the inlet and outlet of the optimized model and 500 μm after each column. The peak density of particles distribution near the inlet is located at 74.8 μm, with a distribution range of 1.61 to 133.87 μm. After passing through the five columns in sequence, the peak density of particles distribution is shifted towards the sidewall by 14.67, 12.2, 3.48, 2.67 and 5.69 μm, and is located at 89.47, 101.67, 105.15, 107.82, and 113.51 μm, respectively. The main distribution ranges of particles are 20.97–133.87, 58.11–131.1, 70.41–131.63, 85.71–137.76, 89.58–143.75 μm, respectively. The peak density of particle distribution near the final outlet is located at 117.3 μm, which is shifted towards the sidewall by 42.5 μm compared to the inlet. The distribution range of particles is narrowed to 93.33–131.67 μm. After the interception and convergence of the five columns, the particles gradually move to the outer wall and finally flow out from the same side.
Materials and methods
Fabrication of the microfluidic chips
The microfluidic chips were fabricated using soft-lithography techniques.50 The design process mainly includes lithography and pouring (ESI Fig. S4†), and the lithography part was done at the Micro- and Nano- Processing Centre of the University of Science and Technology of China (Hefei, Anhui, China). First, the columnless model and the improved columnar model with different column spacing (hereinafter referred to as optimized model) required by the experiment were drawn on the drawing software (CleWin 5.2 Layout Editor). Then, a desktop mask-less laser direct writing lithography machine (MicroWriter ML®3, Durham Magneto Optics, UK) was used to lithograph microfluidic channels on a silicon wafer uniformly covered with a layer of photoresist (Micro Chem, SU-8 2050). The height of the channels used in this experiment was 0.1 mm. The photo-patterned silicon wafer was subsequently rinsed in a developer (Micro Chem, SU-8) to obtain the male mold required for pouring.A mixture of polydimethylsiloxane (PDMS, Sylgard®184 Silicone Elastomer) and curing agent (Sylgard®184 Silicone Elastomer Curing Agent) with a mass ratio of 10![[thin space (1/6-em)]](https://www.rsc.org/images/entities/char_2009.gif) :1 was poured onto the mold. The mixture was de-aerated using a vacuum and then cured in an oven (DB-2A, China) at 80 °C for at least one hour. The cured PDMS film was peeled from the mold, the inlet and outlet were punched using a 0.5 mm punch. The surface of the PDMS film with the patterns and the flat PDMS film were activated using a plasma cleaner (PDC-MG, China), and then bonded together to form the final microfluidic chip.
:1 was poured onto the mold. The mixture was de-aerated using a vacuum and then cured in an oven (DB-2A, China) at 80 °C for at least one hour. The cured PDMS film was peeled from the mold, the inlet and outlet were punched using a 0.5 mm punch. The surface of the PDMS film with the patterns and the flat PDMS film were activated using a plasma cleaner (PDC-MG, China), and then bonded together to form the final microfluidic chip.
Experimental solution preparation
For the small molecule mass transfer experiment, 70 kDa FITC-Dextran (X10927, XYbio, Hangzhou, China) was used, which exhibits yellow-green fluorescence with an excitation wavelength of 493 nm. FITC-labeled dextran is a widely used fluorescent tracer in small molecule mass transfer experiments due to its advantageous properties such as good permeability, stability, and easy accessibility. A fluorescence solution with a concentration of 0.15 mg ml−1 was prepared by dissolving FD70 powder in pure water. The FD70 solution and pure water were introduced into two inlets, and the diffusion of small molecules in the microchannel could be observed by a fluorescence microscope in dark field.In the particle interception experiment, the polymethyl methacrylate (PMMA) microspheres (FANU003O, Rigor, Wuxi, China) with diameters of 3 and 10 μm were used, and the concentration of solid dispersion is both 1 wt%. Their SEM images are shown in Fig. S5.† The particle sizes of both 3 μm and 10 μm microspheres in the dispersions are highly uniform. For 10 μm microspheres, the dispersion was mixed with pure water at a ratio of 4:6 to prepare the particle suspension. Due to the small diameter of the 3 μm microspheres and their high concentration in the dispersion solution, they were mixed with pure water at a ratio of 1:10. In the experiment, the particle suspension and pure water were respectively introduced into two separate inlets. To distinguish the two fluids, red food dye was added to the particle suspension and blue food dye was added to the pure water. The flow of particles was observed under bright-field microscopy.
Experimental process
For the mass transfer experiment, the FD70 solution and pure water were introduced into the microfluidic chip using an injected syringe (LSP02-2B Dual Channels Syringe Pump) at a flow rate of 10 μl min−1. In the dark field, the movement of small molecules in the mass transfer section from high concentration side to low concentration side was observed with a camera (OLYMPUS DP72, Japan) under an inverted fluorescence microscope (OLYMPUS IX81, Japan). Image were acquired using the built-in software (CellSens Dimension software with an accuracy of 0.01 μm) after the flow had stabilized. Image analysis and post-processing were performed with ImageJ software.For the microsphere interception experiment, the 10 μm microsphere suspension and pure water were introduced into the microfluidic chip at a flow rate of 10 μl min−1, while the 3 μm microsphere suspension and pure water were introduced at a flow rate of 3 μl min−1 to facilitate clear observation of the microsphere flow trajectory. The flow of microspheres was observed under a microscope (PH100-3A41L-EP, China) with a camera (JT-105, China) in bright-field. Images were captured after the flow had stabilized, and image analysis and post-processing were performed using GetData Graph Digitizer software.
Results and discussion
Verification of the facilitation effect of optimized columns on mass transfer
To evaluate the effectiveness of fluid-to-fluid mass transfer facilitated by the column array, experiments were conducted using a columnless chip and an optimized chip, as shown in Fig. 5(a). One inlet was supplied with a high concentration fluid (0.15 mg ml−1 of FD70 solution), while the other inlet was supplied with a low concentration fluid (pure water). The two solutions were introduced into the microfluidic chip at a flow rate of 10 μl min−1 and converged at the inlet of the mass transfer section, flowing along the length of the section. Fluorescent small molecules diffused from the high concentration side to the low concentration side, and the waste fluid was collected in a container. After the flow reached stability, fluorescence images of the inlet and outlet of both the columnless chip and the optimized chip were captured, as shown in Fig. 5(c). Fig. 5(d) shows the fluorescent substances near the five columns in the optimized chip. It was observed that when the two fluids flowed through the column, a greater amount of fluorescent substances entered the low concentration side from the high concentration side. | ||
| Fig. 5 Experimental validation of the effect of the columns on mass transfer. (a) Schematic diagram of the mass transfer experiment. (b) Simulation results of the concentration distribution at the inlet and outlet of the mass transfer section of the columnless chip and the optimized chip. (c) Fluorescence pictures of the inlet and outlet of the mass transfer section of the two chips. The scale bars denote 200 μm. (d) Fluorescence pictures near each column in the optimized chip in the experiment. The scale bars denote 200 μm. (e) The average concentration of the sample side of the two chips with the mass transfer length. | ||
Multiple intercept lines parallel to the y-axis were taken at the high concentration side in the mass transfer section. The grayscale average of each intercept line was obtained by ImageJ processing and scaled into the concentration average to determine the variation of sample concentration along the channel in both the columnless and optimized chips.
The experimental results in Fig. 5(e) demonstrate a similar trend to the simulation results, where the mass transfer efficiency between the two fluids is high and the sample concentration decreases rapidly near the inlet of both the columnless and optimized chips (approximately 0–0.6 mm, before the position of the first column). However, with the inclusion of columns, the mass transfer efficiency of the two chips differs.
Due to the diffusive mass transfer of the two fluids at the flow interface, the concentration difference between the two sides of the interface gradually decreases, resulting in a weak mass transfer driving force and slow sample concentration drop. In the optimized chip, when the mass transfer efficiency between the two fluids begins to decrease, the added column diverts the two fluids, and the shrinking flow channel increases the flow velocity of the two fluids. They meet again at a certain angle after passing through the column. Some small molecules in the sample migrate to the pure water side following the lateral flow velocity generated by the fluid, resulting in a significant decrease in the sample concentration after passing through each column. In the optimized chip, the removal amount of small molecules at the outlet of the sample side increased by 9.16% (SIM) and 15.06% (EXP) compared to the columnless chip. These results indicate that the presence of the column array effectively enhanced the mass transfer between the two fluids.
Verification of particle interception effect by optimized columns
To verify the interception effect of the optimized column, 10 μm PMMA microspheres were passed into the sample side of the chip, as shown in Fig. 6(a). After a period of time, the microsphere distributions at the inlet and outlet of two chips were obtained, as shown in Fig. 6(c). The distribution of microspheres near each column in the optimized chip is shown in Fig. 6(d). The position information of the microspheres in the images was obtained using GetData. | ||
| Fig. 6 Interception of 10 μm particles by column arrays. (a) Schematic diagram of the particle experiment. (b) Simulation results of particle flow near the inlet and outlet of the columnless chip and the optimized chip at 3 s. (c) Distribution of 10 μm microspheres near the inlet and outlet of the two chips in the experiment. The scale bars denote 200 μm. (d) The distribution of 10 μm microspheres around each column of the optimized chip in the experiment. The scale bars denote 200 μm. (e) Particle number percentage vs. time of different models (simulation results). (f) Distribution pattern of 10 μm microspheres around the outlet of the two chips (experimental results). (g) Distribution pattern of 10 μm microspheres along the main channel of the optimized chip (experimental results). | ||
Fig. 6(f) shows the distribution of microspheres at the outlet of the main flow channel of two chips, with the density profile of microspheres along the flow channel width direction (y-axis) shown in the margins. For the columnless chip, the peak density of microspheres is located at 20.15 μm (y-direction), and the distribution range of microspheres is −64.16–134.05 μm. After adding the column array, the peak density is located at 120.16 μm, which is shifted 100.01 μm toward the sidewall, and the distribution range of microspheres is reduced to 48.1–144.76 μm. The column array converged the microspheres near the outer wall surface, thereby maintaining the flow on the sample side and avoiding loss from the pure water side.
Fig. 6(g) displays the distribution of 10 μm microspheres near the inlet and outlet of the optimized chip and 300 μm after each column. The peak density of microsphere distribution near the inlet is located at 51.13 μm, with a distribution range of −30.63 to 135.21 μm. After passing through the five columns in sequence, the peak density of microsphere distribution is shifted towards the sidewall by 7.01, 20.82, 7.2, 7.46, and 10.92 μm, and is located at 58.14, 78.96, 86.16, 93.62, and 104.54 μm, respectively. The main distribution ranges of microspheres are −16.9–138.38, 21.59–139.18, 22.89–135.34, 58.88–129.01, 62.77–120.8 μm, respectively. The peak density of microsphere distribution near the final outlet is located at 108.5 μm, which is shifted towards the sidewall by 57.37 μm compared to the inlet. The distribution range of microspheres is narrowed to 51.56–138.8 μm. Thus, it can be observed that microspheres accumulate towards the sidewall due to the contraction of the flow channel and the collision with the column during each flow through the column.
The results obtained by replacing the sample with a solution of 3 μm microspheres are presented in ESI Fig. S6.† It is worth noting that the total diffusion coefficient has a linear relationship with particle concentration.51 The 3 μm microspheres have a smaller diameter and a higher concentration, making them more prone to lateral spreading. Although the aggregation and interception effect of the column array is not as significant as that of 10 μm microspheres, it can still effectively reduce the loss of microspheres.
Effect of flow rate on mass transfer
The inlet flow rates of the two solutions were varied to 5, 10, and 15 μl min−1, and the flow interface of the two fluids remained stable. Numerically simulated concentration distribution and fluorescence experimental images near the outlet of two models were obtained, as shown in Fig. 7(b) and (c), respectively. | ||
| Fig. 7 Effect of column array on mass transfer effect at different flow rates. (a) Schematic diagram of the experimental setup. (b) Simulation results of the concentration distribution near the outlet of the columnless chip and the optimized chip. (c) Fluorescence pictures near the outlet of the two chips. The scale bars denote 200 μm. (d) Simulation results of the change in sample-side solute concentration at different flow rates for the two chips. (e) Fluorescence experimental results of the variation of concentration along the flow channel on the sample side within the two chips at different flow rates. | ||
In the columnless chip, the transfer of small molecules between the two fluids depends solely on diffusion. In contrast, there are both diffusion and convection between the two fluids in the optimized chip. Fig. 7(d) shows the numerical results of the sample-side solute concentration variation with mass transfer length in two models at different flow rates. With an increase in the inlet flow rate, the small molecule removal from the sample at the outlet of the optimized model increases by 6.83%, 9.16%, and 10.09%, respectively, compared to the columnless chip.
Fig. 7(e) presents the experimental results, which indicate that with an increase in the inlet flow rate, the small molecule removal within the sample in the optimized chip increases by 10.91%, 15.06%, and 12.33%, respectively, compared to the columnless chip. The numerical simulations and experimental results both demonstrate that the presence of the column array significantly enhances the convective mass transfer from the sample side to the pure water side. However, the change in flow rate does not significantly affect the facilitation effect of the column array on the mass transfer of the two fluids.
To investigate the effect of flow rate on diffusive mass transfer, the variation of small molecule scavenging in the columnless chip was analyzed at different flow rates (indicated by dashed lines). With an increase in flow rate, the small molecule removal on the sample side decreased, with values of 29.30%, 24.53%, and 22.70% in the numerical simulation results shown in Fig. 7(d), and 29.92%, 25.34%, and 21.82% in the experimental results shown in Fig. 7(e), respectively. This indicates that flow rate has a significant effect on diffusive mass transfer, and low flow rates are more favorable for diffusive mass transfer. This trend is consistent with the results obtained by other researchers.52
Conclusions
The incorporation of a column array in microfluidic chips plays a crucial role in enhancing the mass transfer between two fluids as well as enriching the particles. In this study, we introduced a column array along the centerline of the channel in an H-type filter. Through numerical simulations, it was observed that the addition of the column led to a reduction in the effective diffusion area of the solute. However, the presence of the column induced a lateral fluid flow component, resulting in a shift from a single diffusion mode to a binary mode of diffusion and convection between the two fluids. This transition facilitated the migration of solute from the sample to the pure solution. By adjusting the position of the column to the point where the mass transfer between the two fluids starts to deteriorate, the inhibitory effect of the column on diffusion mass transfer was minimized, thereby maximizing the mass transfer efficiency. The optimized column array, with fewer columns, fulfills the requirements for enhanced mass transfer and particle interception, resulting in reduced device pressure drop and facilitating the preparation of parallelized devices.The fabrication of both a columnless chip and an optimized chip with five columns was accomplished using soft lithography techniques. Experimental investigations were conducted using FD70 fluorescent small-molecule mass transfer experiments and PMMA microsphere interception experiments. The results demonstrated that the incorporation of column arrays in the chip effectively enhanced the movement of small molecules from the high-concentration side to the low-concentration side, with lower flow rates exhibiting a higher propensity for diffusive mass transfer. Furthermore, the microsphere interception experiments revealed that smaller microsphere diameters and higher concentrations increased the likelihood of microspheres crossing the centerline of the flow channel and being lost to the opposite fluid side. However, the introduction of column arrays effectively intercepted the microspheres, redirecting them towards the sidewalls of the flow channel and preventing their loss.
Although this paper presents simulation and experimental results demonstrating the enhanced mass transfer capabilities of the column array, further investigations are warranted to explore the impact of column array parameters such as shape, size, and other factors on device performance. Additionally, the optimization method for determining column positions offers a means to achieve high mass transfer efficiency while reducing device pressure drop, providing valuable insights for constructing microfluidic chip networks based on the flow channel units with column arrays. Through continuous adjustment and refinement, the device can be used to accelerate chemical reactions, achieve efficient and portable membraneless dialysis, and facilitate the removal of protective agents prior to the infusion of cryopreserved stem cells.
Author's contributions
YRY developed the design methodology and created the model for numerical simulations and experimental validation. YL assisted with numerical simulations. ZRW made data curation. ZDL supported fruitful discussions. XMH and YW assisted in the experimental verification. ZMS assisted with editing the paper. LQH and WPD planned and supported the work.Conflicts of interest
There are no conflicts of interest to declare.Acknowledgements
This work was supported by the National Natural Science Foundation of China (No. 31970754 and 82072018).References
- P. Li, Z. Mao, Z. Peng, L. Zhou, Y. Chen, P.-H. Huang, C. I. Truica, J. J. Drabick, W. S. El-Deiry, M. Dao, S. Suresh and T. J. Huang, Proc. Natl. Acad. Sci. U. S. A., 2015, 112, 4970–4975 CrossRef CAS PubMed.
- Y. Song, D. Li and X. Xuan, Electrophoresis, 2023, 44, 910–937 CrossRef CAS PubMed.
- V. Plaks, C. D. Koopman and Z. Werb, Science, 2013, 341, 1186–1188 CrossRef CAS PubMed.
- X. Li, W. Chen, G. Liu, W. Lu and J. Fu, Lab Chip, 2014, 14, 2565–2575 RSC.
- A. Dalili, E. Samiei and M. Hoorfar, Analyst, 2019, 144, 87–113 RSC.
- N. Nam-Trung, M. Hejazian, C. H. Ooi and N. Kashaninejad, Micromachines, 2017, 8, 186 CrossRef.
- J. Charmet, P. Arosio and T. P. J. Knowles, J. Mol. Biol., 2018, 430, 565–580 CrossRef CAS PubMed.
- J. Zhou, P. Mukherjee, H. Gao, Q. Luan and I. Papautsky, APL Bioeng., 2019, 3, 041504 CrossRef PubMed.
- J. Y. Chan, A. B. A. Kayani, M. A. M. Ali, C. K. Kok, B. Y. Majlis, S. L. L. Hoe, M. Marzuki, A. S.-B. Khoo, K. Ostrikov, M. A. Rahman and S. Sriram, Biomicrofluidics, 2018, 12, 011503 CrossRef PubMed.
- R. S. W. Thomas, P. D. Mitchell, R. O. C. Oreffo, H. Morgan and N. G. Green, Electrophoresis, 2019, 40, 2718–2727 CrossRef CAS PubMed.
- H. Zhang, H. Chang and P. Neuzil, Micromachines, 2019, 10 CAS.
- Y. Q. Fu, J. K. Luo, N. T. Nguyen, A. J. Walton, A. J. Flewitt, X. T. Zu, Y. Li, G. McHale, A. Matthews, E. Iborra, H. Du and W. I. Milne, Prog. Mater. Sci., 2017, 89, 31–91 CrossRef CAS.
- K. Wang, W. Zhou, Z. Lin, F. Cai, F. Li, J. Wu, L. Meng, L. Niu and H. Zheng, Sens. Actuators, B, 2018, 258, 1174–1183 CrossRef CAS.
- D. Vallejo, A. Nikoomanzar, B. M. Paegel and J. C. Chaput, ACS Synth. Biol., 2019, 8, 1430–1440 CrossRef CAS PubMed.
- P. Zhang, H. Bachman, A. Ozcelik and T. J. Huang, in Annual Review of Analytical Chemistry, ed. P. W. Bohn and J. E. Pemberton, 2020, vol. 13, pp. 17–43 Search PubMed.
- D. Gao, W. Ding, M. Nieto-Vesperinas, X. Ding, M. Rahman, T. Zhang, C. Lim and C.-W. Qiu, Light: Sci. Appl., 2017, 6, e17039 CrossRef CAS PubMed.
- L. Lin, X. Peng, X. Wei, Z. Mao, C. Xie and Y. Zheng, ACS Nano, 2017, 11, 3147–3154 CrossRef CAS PubMed.
- T. Yang, Y. Chen and P. Minzioni, J. Micromech. Microeng., 2017, 27, 123001 CrossRef.
- Y. Zhang and N. Nam-Trung, Lab Chip, 2017, 17, 994–1008 RSC.
- J. Gomez-Pastora, I. H. Karampelas, E. Bringas, E. P. Furlani and I. Ortiz, Sci. Rep., 2019, 9, 7265 CrossRef PubMed.
- H. G. Kye, B. S. Park, J. M. Lee, M. G. Song, H. G. Song, C. D. Ahrberg and B. G. Chung, Sci. Rep., 2019, 9, 9502 CrossRef CAS PubMed.
- H. Cha, H. Fallahi, Y. Dai, D. Yuan, H. An, N.-T. Nguyen and J. Zhang, Lab Chip, 2022, 22, 423–444 RSC.
- C. W. Shields, C. D. Reyes and G. P. Lopez, Lab Chip, 2015, 15, 1230–1249 RSC.
- P. Paie, J. Che and D. Di Carlo, Microfluid. Nanofluid., 2017, 21 Search PubMed.
- H. Haddadi, H. Naghsh-Nilchi and D. Di Carlo, Biomicrofluidics, 2018, 12, 014112 CrossRef PubMed.
- D. Yuan, Q. Zhao, S. Yan, S.-Y. Tang, G. Alici, J. Zhang and W. Li, Lab Chip, 2018, 18, 551–567 RSC.
- X. Lu and X. Xuan, Anal. Chem., 2015, 87, 6389–6396 CrossRef CAS PubMed.
- J. McGrath, M. Jimenez and H. Bridle, Lab Chip, 2014, 14, 4139–4158 RSC.
- T. Salafi, Y. Zhang and Y. Zhang, Nano-Micro Lett., 2019, 11 Search PubMed.
- A. Hochstetter, R. Vernekar, R. H. Austin, H. Becker, J. P. Beech, D. A. Fedosov, G. Gompper, S.-C. Kim, J. T. Smith, G. Stolovitzky, J. O. Tegenfeldt, B. H. Wunsch, K. K. Zeming, T. Kruger and D. W. Inglis, ACS Nano, 2020, 14, 10784–10795 CrossRef CAS PubMed.
- X. Chen and J. Shen, J. Chem. Technol. Biotechnol., 2017, 92, 271–282 CrossRef CAS.
- N. Xiang, Q. Li and Z. Ni, Anal. Chem., 2020, 92, 6770–6776 CrossRef CAS.
- C. Y. Lee, W.-T. Wang, C.-C. Liu and L. M. Fu, Chem. Eng. J., 2016, 288, 146–160 CrossRef CAS.
- R. Wang, B. Lijin, D. Shi and Z. Zhu, Sens. Actuators, B, 2017, 249, 395–404 CrossRef CAS.
- H. Zhang, K. Anoop, C. Huang, R. Sadr, R. Gupte, J. Dai and A. Han, Sens. Actuators, B, 2022, 354 CAS.
- H. Jeon, B. Jundi, K. Choi, H. Ryu, B. D. Levy, G. Lim and J. Han, Lab Chip, 2020, 20, 3612–3624 RSC.
- Y. Zhang, T. Zheng, L. Wang, L. Feng, M. Wang, Z. Zhang and H. Feng, Rev. Adv. Mater. Sci., 2021, 60, 313–324 Search PubMed.
- T. Chen, C. Huang, Y. Wang and J. Wu, Chin. Chem. Lett., 2022, 33, 1180–1192 CrossRef CAS.
- H. M. Ji, V. Samper, Y. Chen, C. K. Heng, T. M. Lim and L. Yobas, Biomed. Microdevices, 2008, 10, 251–257 CrossRef PubMed.
- W.-C. Zheng, R. Xie, L.-Q. He, Y.-H. Xi, Y.-M. Liu, Z.-J. Meng, W. Wang, X.-J. Ju, G. Chen and L.-Y. Chu, Biomicrofluidics, 2015, 9, 044112 CrossRef PubMed.
- P. Arosio, T. Mueller, L. Rajah, E. V. Yates, F. A. Aprile, Y. Zhang, S. I. A. Cohen, D. A. White, T. W. Herling, E. J. De Genst, S. Linse, M. Vendruscolo, C. M. Dobson and T. P. J. Knowles, ACS Nano, 2016, 10, 333–341 CrossRef CAS PubMed.
- K. Chen, H. Lu, M. Sun, L. Zhu and Y. Cui, Chem. Eng. Res. Des., 2018, 132, 338–345 CrossRef CAS.
- L. Zou, Y. Gong, L. Chen, X. Yi and W. Liu, Chem. Eng. Sci., 2021, 244 Search PubMed.
- H. Amini, E. Sollier, M. Masaeli, Y. Xie, B. Ganapathysubramanian, H. A. Stone and D. Di Carlo, Nat. Commun., 2013, 4, 1826 CrossRef PubMed.
- H. Xie, Y. Yang, C. Xia, T.-C. Lee, Q. Pu, Y. Lan and Y. Zhang, TrAC, Trends Anal. Chem., 2022, 146 Search PubMed.
- J. Zhang, S. Yan, D. Yuan, G. Alici, N. Nam-Trung, M. E. Warkiani and W. Li, Lab Chip, 2016, 16, 10–34 RSC.
- J. Marschewski, S. Jung, P. Ruch, N. Prasad, S. Mazzotti, B. Michel and D. Poulikakos, Lab Chip, 2015, 15, 1923–1933 RSC.
- N. D. M. Raimondi, L. Prat, C. Gourdon and J. Tasselli, Chem. Eng. Sci., 2014, 105, 169–178 CrossRef.
- A. Haghighinia, S. M. Tabatabaei and S. Movahedirad, Int. J. Heat Mass Transfer, 2021, 165 Search PubMed.
- J. C. McDonald, D. C. Duffy, J. R. Anderson, D. T. Chiu, H. K. Wu, O. J. A. Schueller and G. M. Whitesides, Electrophoresis, 2000, 21, 27–40 CrossRef CAS PubMed.
- R. Rusconi and H. A. Stone, Phys. Rev. Lett., 2008, 101 Search PubMed.
- S. Hossain, M. A. Ansari and K.-Y. Kim, Chem. Eng. J., 2009, 150, 492–501 CrossRef CAS.
Footnote |
| † Electronic supplementary information (ESI) available. See DOI: https://doi.org/10.1039/d3ra07285a |
| This journal is © The Royal Society of Chemistry 2024 |