 Open Access Article
Influence of organic matters on the adsorption–desorption of 1,2-dichloroethane on soil in water and model saturated aquifer†
Xinhong Huangac,
Yan Liang *abc,
Jinhu Yunac,
Feishu Caobd,
Tian Xiebd,
Hainong Songbd and
Shuangfei Wang
 be
be
aSchool of Resources, Environment and Materials, Guangxi University, Nanning 530004, China. E-mail: liangyan@gxu.edu.cn
bGuangxi Bossco Environmental Protection Technology Co., Ltd, Nanning 530007, China
cKey Laboratory of Environmental Protection (Guangxi University), Education Department of Guangxi Zhuang Autonomous Region, Nanning 530004, Guangxi, China
dGuangxi Key Laboratory of Environmental Pollution Control and Ecosystem Restoration, Nanning 530007, Guangxi, China
eCollege of Light Industry and Food Engineering, Guangxi University, Nanning 530004, China
First published on 18th January 2024
Abstract
1,2-Dichloroethane (1,2-DCA) is a typical organic chlorinated compound largely utilized in chemical manufacturing and industrial production and also a common pollutant in organically contaminated sites. The adsorption of 1,2-DCA on soil grains significantly influences its environmental fate and removal process. This study investigated the influence of fulvic acid (FA) and humic acid (HA) on the adsorption–desorption of 1,2-DCA in solid–liquid interfaces in water or constructed porous media. Experimental findings demonstrated the influence of organic matter on the adsorption of 1,2-DCA at the solid–water interface. 1,2-DCA adsorption increased in the FA or HA-treated soils when organic matter was present on the solid surfaces. The 1,2-DCA adsorption in the mixture of FA and HA was slightly lower than that in single organic acids, depending on the binding of FA and HA to the soil grains/colloids. Basic conditions reduced the adsorption of 1,2-DCA on soils, whereas acidic conditions enhanced adsorption due to the increased interactions via adsorption sites and hydrogen bonds. Conversely, the presence of organic matter in solutions (liquid phase in constructed porous media) will reduce the adsorption of 1,2-DCA on solid surfaces and increase the transport in the model aquifer. The combination of FA, HA, and rhamnolipids is helpful for the removal of 1,2-DCA from solid surfaces. Additionally, because of the enhanced desorption, the risk of 1,2-DCA contamination in groundwater can be increased when the organic matter or surfactant is present in the liquid phase if the eluent is not collected. This study helps to better understand the cooperative interaction of soil organic matter and chlorinated hydrocarbons at solid–water interfaces and the environmental fate and potential removal strategies of chlorinated hydrocarbons in contaminated sites.
1. Introduction
Hydrophobic organic contaminants (HOCs) are distinguished by their high hydrophobicity, low solubility, and limited volatility.1–4 Their persistence in the environment increases concerns for human and environmental health. Hydrophobic organics are potentially toxic because of their high affinity for binding to cellular membranes, which disrupts the integrity of membranes and causes cellular damage. This damage can lead to a range of adverse effects, such as developmental and reproductive defects, cancer, and neurological disorders.2,5 Among HOCs, chlorinated hydrocarbons are often poorly biodegradable and tend to have potent carcinogenic, teratogenic, and mutagenic effects on humans. Short-chain chlorinated hydrocarbons such as 1,2-dichloroethane (1,2-DCA), methylene chloride (DCM), and 1,2-dichloroethylene (1,2-DCE) are also highly soluble in water. 1,2-DCA is commonly used in the production of vinyl chloride (VC) and polyvinyl chloride (PVC) in industry. It has been classified as a probable human carcinogen by the USEPA. It may exist in several physical forms with varying bioavailability in natural waters, such as water-soluble state, associated state with suspended particles, and solubilized state with organics.6–8 The interaction of pollutants and soil grains in the environment is an essential process for their environmental fate and significantly influences their removal from soil. The removal of the hydrophobic organics from soils is rather complex due to their low solubility and inclination to adhere to colloids and organic matter in the soil.9 As an indexing process that affects the transport and retention of pollutants in the subsurface and aquifers environment, the adsorption of contaminants on solids is highly dependent on the particulate fractions, e.g., soil colloids due to their large specific surface area and the associations with minerals and organics that contain various functional groups.Humic substances are prevalent in the environment and are generated from the decay of terrestrial plants and animal biomass via the biological activities of microorganisms.10,11 They are conventionally classified into humin, humic acid (HA), and fulvic acid (FA).12 The charges of HA and FA play an important role in binding contaminants via their carboxylic and phenolic groups.13,14 Due to the large number and complexity of functional groups, humic substances such as FA and HA have high molecular activity and are distributed differently in different types of soils and environmental conditions. The HOCs in contaminated sites tend to show different environmental behaviors due to their incorporation with the organics.15–18 The HA has surfactant-like properties and may disconnect the interactions of organics with solid surfaces via its oil–water interfacial activities.12,19,20 The influence of soil organic matter on the adsorption of HOCs can be attributed to the combination of minerals and humic acids, but the heterogeneity has not been specifically investigated. In this work, the influence of FA and HA on the adsorption–desorption of 1,2-DCA on loamy and sandy soils was investigated by the performance of batch adsorption–desorption experiments and column experiments. Investigations on the influence of humic chemicals on the adsorption–desorption of 1,2-DCA in soil and aquifer will help to understand their environmental fate and their removal from the environmental media.
2. Materials and methods
2.1. Soils and treatments
The sandy loam soil (2.83 N, 108.31 E, Nanning, China) and loamy sand soil (22.68 N, 109.27 E, Nanning, China) were collected from a depth of around 5 m. Soil texture classification was analyzed according to the United States Department of Agriculture (USDA) soil grain classification standard. The soil samples were sieved through 10 mesh to remove stones and debris and then were air-dried at room temperature. In addition, to investigate the influence of organics on the adsorption of 1,2-DCA on soil grains, treatments with high temperature and oxidation were performed for comparisons. Portions of dried soils were taken and treated in a muffle furnace (Thermo Scientific, BF51794C-1, U.S.) at 600 °C for 6–8 hours till constant weight, and then were treated in a 10% H2O2 solution with 5![[thin space (1/6-em)]](https://www.rsc.org/images/entities/char_2009.gif) :
:![[thin space (1/6-em)]](https://www.rsc.org/images/entities/char_2009.gif) 1 V/W for 24 h. Later, the liquid was removed and the samples were dried at 105 °C till constant weights. After treatments, the sandy loam changed from grey–brown to reddish–brown, and the loamy sand from brownish–red to dark–red. The bounding water in the hydrated inorganic colloids in soils can be completely removed and the structure of soil grain became compact after treatment with high temperature. A scanning electron microscope (SEM, ZEISS Sigma 300, Germany) was used to visually characterize the soil surfaces. X-ray diffraction (XRD, Ultima IV 1604828S, Japan) was used to analyze mineralogical crystallographic variations in soils. Fourier transform infrared spectroscopy (FTIR) was used for the observation of functional group changes in soil grains. Ultraviolet-visible spectra (UV spectra, Agilent Cary 3500, USA) were also used to analyze the interactions between FA/HA and 1,2-DCA.
1 V/W for 24 h. Later, the liquid was removed and the samples were dried at 105 °C till constant weights. After treatments, the sandy loam changed from grey–brown to reddish–brown, and the loamy sand from brownish–red to dark–red. The bounding water in the hydrated inorganic colloids in soils can be completely removed and the structure of soil grain became compact after treatment with high temperature. A scanning electron microscope (SEM, ZEISS Sigma 300, Germany) was used to visually characterize the soil surfaces. X-ray diffraction (XRD, Ultima IV 1604828S, Japan) was used to analyze mineralogical crystallographic variations in soils. Fourier transform infrared spectroscopy (FTIR) was used for the observation of functional group changes in soil grains. Ultraviolet-visible spectra (UV spectra, Agilent Cary 3500, USA) were also used to analyze the interactions between FA/HA and 1,2-DCA.
In addition, FA and HA were also used to treat the soils to investigate their influence on the interaction of 1,2-DCA and soils. The FA (AR, 98%) and HA (AR, 95%) were purchased from Guangfu, Co., Ltd, China. The FA was prepared into aqueous solutions using deionized water, and HA was dissolved using 0.01 mol L−1 sodium hydroxide solution to ensure that the solute was almost completely dissolved and that the concentration remained stable over longer storage periods. The FA and HA solutions (1![[thin space (1/6-em)]](https://www.rsc.org/images/entities/char_2009.gif) :
:![[thin space (1/6-em)]](https://www.rsc.org/images/entities/char_2009.gif) 1) were incorporated into the soil (original soil and soil treated with high temperature and oxidation) by diluting the stock solutions to selected concentrations (10, 25, 50, 75 mg L−1) and mixed with the soil. The mixtures were shaken for 24 hours at room temperature and then were dried at a constant temperature in an oven at 60 °C. Once dried, the samples were collected and stored in a cool, dry container.
1) were incorporated into the soil (original soil and soil treated with high temperature and oxidation) by diluting the stock solutions to selected concentrations (10, 25, 50, 75 mg L−1) and mixed with the soil. The mixtures were shaken for 24 hours at room temperature and then were dried at a constant temperature in an oven at 60 °C. Once dried, the samples were collected and stored in a cool, dry container.
2.2. Batch adsorption–desorption experiment
1,2-DCA (99.5%, Aladdin Co., Ltd, China) under concentrations of 20, 30, 40, 50, 75, 100 mg L−1 was mixed with 5.00 g soil (original and treated soils) in 20 mL bottles without the presence of bubbles. The mixing ratios of added FA to HA in soil were 0, 20%, 40%, 60%, 80%, and 100% (0 was with FA only and 100% was with HA only). The ionic strengths were 0, 10 mM, and 50 mM (NaCl or CaCl2), and the pH values were 4, 5.5, 7, 8.5, and 10, respectively.Kinetic adsorption experiments were performed to determine the time for equilibrium. 5.00 g of soil (original loamy sand or sandy loam) was taken in each 20 mL bottle filled with 1,2-DCA solution. After shaking for 3, 6, 12, 18, 24, 36, 48 h at 180 rpm (temperature at 15 °C and 25 °C) in tumbling oscillator (Marit, TS-2012W, China), the liquid component was centrifuged at 4000 rpm for 3 minutes and then extracted with hexane to obtain the organic phase. Extractions were carried out for at least 15 min using a vortex extractor with 500 μL of hexane in a 1 mL centrifuge tube as well as the addition of 100 μL of aqueous phase samples. The 1,2-DCA in extracted samples was determined using gas chromatography equipment (Shimadzu, GC-2010PLUS, Japan) as follows: inlet temperature: 250 °C; injection mode: shunt injection (shunt ratio of 5![[thin space (1/6-em)]](https://www.rsc.org/images/entities/char_2009.gif) :
:![[thin space (1/6-em)]](https://www.rsc.org/images/entities/char_2009.gif) 1); column flow rate (constant flow mode): 1.0 mL min−1; heating procedure: 40 °C for 2 min, increased to 120 °C at a rate of 5 °C min−1, held for 3 min, and then increased to 230 °C at a rate of 10 °C min−1 and held for 5 min. The capillary chromatography column was a specification of 30 m × 0.25 mm and a film thickness of 1.4 μm (6% nitrile propyl phenyl and 94% dimethyl polysiloxane). All the batch experiments were performed in duplicates.
1); column flow rate (constant flow mode): 1.0 mL min−1; heating procedure: 40 °C for 2 min, increased to 120 °C at a rate of 5 °C min−1, held for 3 min, and then increased to 230 °C at a rate of 10 °C min−1 and held for 5 min. The capillary chromatography column was a specification of 30 m × 0.25 mm and a film thickness of 1.4 μm (6% nitrile propyl phenyl and 94% dimethyl polysiloxane). All the batch experiments were performed in duplicates.
After achieving adsorption equilibrium, the liquid and solids were separated via centrifugation (Xiangyi, CLT55, China) and the bottles were refilled with 20 mL of deionized water to investigate the desorption. The bottles were then placed at rest within a constant temperature chamber at 20 °C. The samples were collected at multiple time intervals of 0.5, 1, 2, 3, 4, 6, and 8 days and determined after treatments the same as adsorption experiments.
2.3. Leaching of FA and HA from soils
To investigate the stabilization of soil binding to FA and HA. Soil leaching experiments were carried out. A 5.00 g soil sample (refers to soil samples supplemented with FA and HA, as described in 2.1) was taken in a conical flask and 20 mL of deionized water was added, and then placed in a water bath oscillator at 180 rpm at 20 °C for 12 h. A fluorescence spectrophotometer (Hitachi, F-2700, Japan) was utilized to quantify the FA and HA leaching from soils. Both FA and HA had a detection excitation wavelength (λEX) of 460 nm and a detection emission wavelength (λEM) of 535 nm. Since this method cannot differentiate between FA and HA, a standard curve was created based on the different fluorescence intensities of the two substances to measure the mixed humic acids.2.4. Column experiments
Column experiments were conducted under the methodology outlined by Liang et al. (2013).21 Stainless steel columns with 12 cm in length and 3 cm in diameter were packed with purified quartz sand mixed with original loamy sand or sandy loam in a mass ratio of soil to quartz at 1![[thin space (1/6-em)]](https://www.rsc.org/images/entities/char_2009.gif) :
:![[thin space (1/6-em)]](https://www.rsc.org/images/entities/char_2009.gif) 3. The porosity of the packed columns was determined by comparisons of the solid–water weights. A peristaltic pump was implemented to introduce solutions at varying proportions upward into the vertical columns at a constant Darcy flow rate of 0.06 cm min−1. Before the transport experiment, the column was conditioned with a background electrolyte solution (5 mM KNO3) of at least 30 pore volumes (PVs). 100 mL 1,2-DCA (50 mg L−1) with the presence of FA and HA mixtures (0, 20%, 40%, 60%, 80%, and 100%) in solutions was introduced onto the column and sequentially eluted with 100 mL of background solution. Column effluents were continuously collected using a fraction collector and analyzed for 1,2-DCA concentrations to create breakthrough curves (BTCs). A control was set up using soils without the treatments with FA and HA for comparison. After the completion of transport experiments, elution was carried out using 100 mL of rhamnolipid (200 or 300 mg L−1), FA and HA (50 mg L−1), or the mixtures of rhamnolipid and organic acids, to investigate the desorption/release of 1,2-DCA from columns. The concentrations of 1,2-DCA in column effluents were detected in the same manner as described above.
3. The porosity of the packed columns was determined by comparisons of the solid–water weights. A peristaltic pump was implemented to introduce solutions at varying proportions upward into the vertical columns at a constant Darcy flow rate of 0.06 cm min−1. Before the transport experiment, the column was conditioned with a background electrolyte solution (5 mM KNO3) of at least 30 pore volumes (PVs). 100 mL 1,2-DCA (50 mg L−1) with the presence of FA and HA mixtures (0, 20%, 40%, 60%, 80%, and 100%) in solutions was introduced onto the column and sequentially eluted with 100 mL of background solution. Column effluents were continuously collected using a fraction collector and analyzed for 1,2-DCA concentrations to create breakthrough curves (BTCs). A control was set up using soils without the treatments with FA and HA for comparison. After the completion of transport experiments, elution was carried out using 100 mL of rhamnolipid (200 or 300 mg L−1), FA and HA (50 mg L−1), or the mixtures of rhamnolipid and organic acids, to investigate the desorption/release of 1,2-DCA from columns. The concentrations of 1,2-DCA in column effluents were detected in the same manner as described above.
2.5. Adsorption models
Adsorption kinetics were fitted to the pseudo-first22 and second-order kinetic models.23 Isotherms were fitted using the linear and Freundlich adsorption models. Details are presented in ESI.†3. Results and discussion
3.1. Characterizations of soil
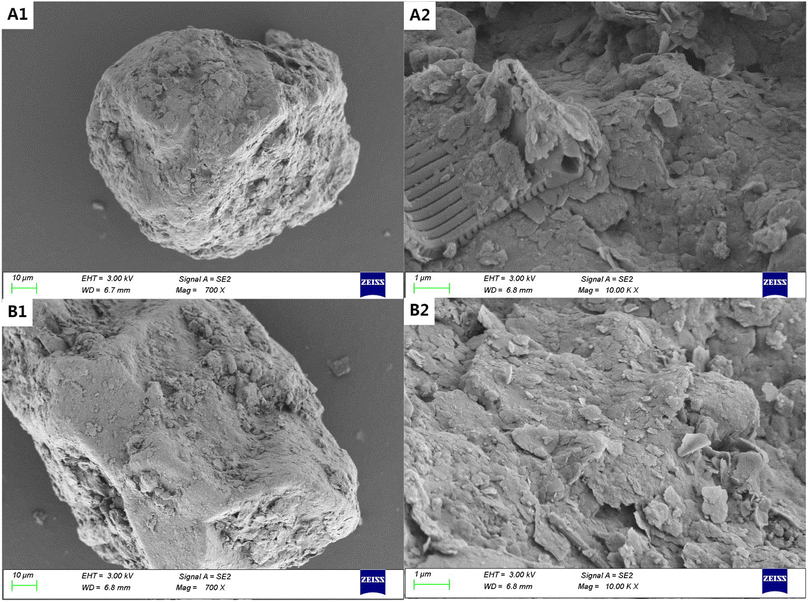
The SEM images of the untreated loamy soil (Fig. 1A(1) and (2)) show that plenty of colloids are uniformly wrapped around the soil grains, while the treated soil after high temperature and oxidation (Fig. 1A(3) and (4)) shows the sintering of soil colloids on the surface and larger grain sizes (Table S1†). High temperatures can induce the pyrolysis and oxidation of both organic and inorganic matter in the soil, e.g., carbon contents in soils were below the detection limit in the elemental analysis after treatments (Table S2 and S3†). This can lead to the development of a more intricate pore structure.24 However, the surface morphological features of sandy soil are almost unchanged before and after treatments (Fig. 2A(1) and B(2)). It is also evident that soil colloids make up a smaller amount of the sandy soil based on the size distributions of soil grains.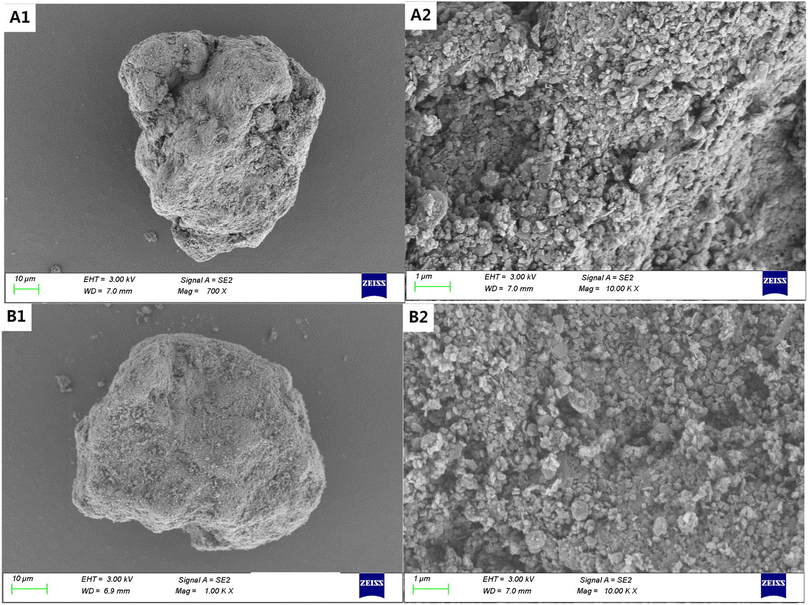 | ||
| Fig. 2 SEM images of original and high temperature and H2O2 oxidation treated sandy soil with rare soil colloid changes in surface, (A and B) correspond to the original sample and treated sample. | ||
3.2. Isotherm and kinetic analysis of 1,2-DCA
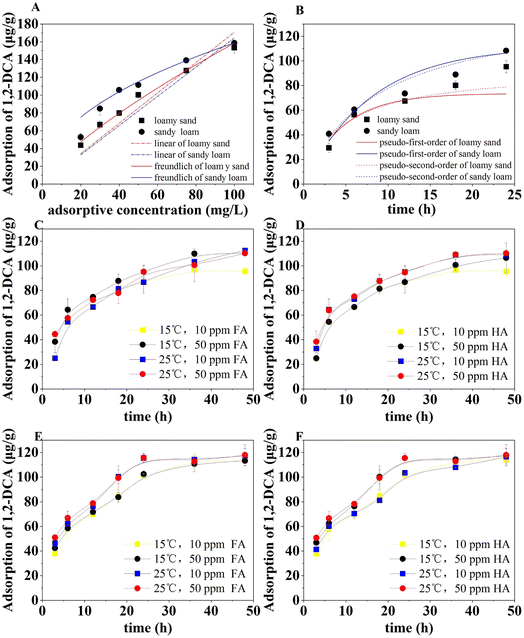
The adsorption isotherms of 1,2-DCA on two untreated soils are shown in Fig. 3A. At 1,2-DCA concentrations of 20 to 100 mg L−1. The adsorption of 1,2-DCA was increased from 43.66 μg g−1 to 153.19 μg g−1 in the original loamy sand and from 52.78 μg g−1 to 158.58 μg g−1 in the original sandy loam. The adsorption on sandy loam was slightly higher probably due to the larger amount of organic matter (Table S2†). The 1,2-DCA adsorption was well described by the Freundlich adsorption model (Fig. 3A), and the adsorption kinetics (Fig. 3B) on the original soil can be better described by the pseudo-second-order kinetic model (according to R2 values in Table 1). This indicates the importance of chemical adsorption, which is consistent with the adsorption of 1,2-DCA and other hydrocarbons (benzene, e.g.) reported in previous studies.7,25 The overall adsorption time is relatively long, which is influenced by the altered conditions of the soil after infiltration. To ensure the adsorption equilibrium, the batch adsorption experiment was chosen to be carried out for 48 h.| Equations of isotherm | Loamy sand | Sandy loam | |
|---|---|---|---|
| a K1 [h−1], pseudo-first-order kinetic rate constant; K2 [g mg−1 h−1], pseudo-second-order kinetic rate constant; Qe1 and Qe2, [mg g−1], equilibrium adsorption capacity; Kd [L kg−1], distribution coefficient; Kf [L kg−1], Freundlich constant; n, the favorability degree of the adsorption process. | |||
| Linear | Kd | 1.707 | 1.642 |
| R2 | 0.998 | 0.989 | |
| Freundlich | Kf | 4.954 | 18.714 |
| 1/n | 1.332 | 2.162 | |
| R2 | 0.996 | 0.990 | |
| Soil | Pseudo-first-order | Pseudo-second-order | ||||
|---|---|---|---|---|---|---|
| Qe1 | K1 | R2 | Qe2 | K2 | R2 | |
| Loamy sand | 73.594 | 0.219 | 0.840 | 93.668 | 2.37 × 10⁻³ | 0.885 |
| Sandy loam | 111.977 | 0.124 | 0.961 | 145.153 | 7.95 × 10⁻⁴ | 0.975 |
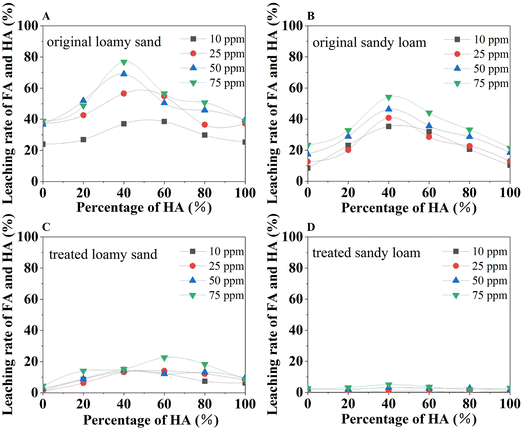
The kinetic changes in 1,2-DCA adsorption in the presence of FA and HA are shown in Fig. 3C–F. The fast adsorption phase of 1,2-DCA was within the first 6 h, followed by a slow adsorption phase from 6 to 24 h. The rate enhancement of 1,2-DCA adsorption by the addition of organic matter (either FA or HA) was approximately equal to that of an increase in temperature. Generally, the presence FA or HA in soil increased 1,2-DCA adsorption. The influence of temperature change (10 °C) on the adsorption capacity was different in the soils. In loamy sand with a low content (10 ppm) of FA or HA for treatment, after 48 hours, the adsorption at 25 °C was higher than that at 15 °C, following a longer time for adsorption equilibrium. In sandy loam, the adsorption was slightly increased at a higher temperature for the same amount of FA addition (10 or 50 ppm), whereas the curves for the same temperature (15 or 25 °C) overlapped (Fig. 3E). In sandy loam with HA, the adsorption at 15 or 25 °C was increased with increased HA concentration (Fig. 3F). In particular, when the FA was added to the loamy sand, the adsorption of 1,2-DCA increased from 24.90 μg g−1 to 44.49 μg g−1 as the amount of added FA raised from 10 mg kg−1 to 50 mg kg−1. The maximum difference in initial 1,2-DCA adsorption after the addition of HA to the loam was 13.3 μg g−1, which was less than the change with the presence of FA. The addition of FA or HA increased 1,2-DCA adsorption by 9.1% in loamy sand but only by 3.9% in sandy loam, in comparison to control samples without added FA and HA. This difference was attributed to the different number and activity of their functional groups such as carboxylic and phenolic groups.26 The adsorption in sandy loam was largely unaffected by changes in humic acid and temperature. A plateau in the adsorption curves for sandy loam can be observed with the addition of 50 mg kg−1 of humic acid to the soil, while the adsorption in loamy soils was slightly slower. Comparing the leaching of FA and HA from soil grains without and with high temperature and H2O2 oxidation treatments, there were around 75% and 90% reduction of the leaching from treated loamy sand and sandy loam, respectively (Fig. 4). When the soil grains were treated with high temperature and H2O2 oxidation, the interaction of FA and HA with soil surfaces was much stronger, according to the leaching of FA and HA from different soils (Fig. 4). Zeta potential measurements indicated that in the presence of FA and HA, the surface of treated loamy sand became more negative while the treated sandy loam became less negative, compared to the untreated sands (Table S1†).
3.3. The adsorption of 1,2-DCA on original and treated soils in the presence of FA and HA
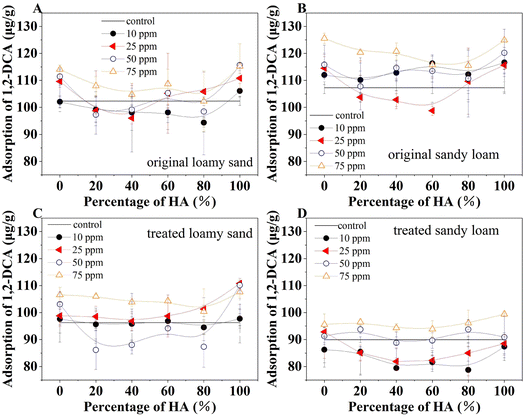
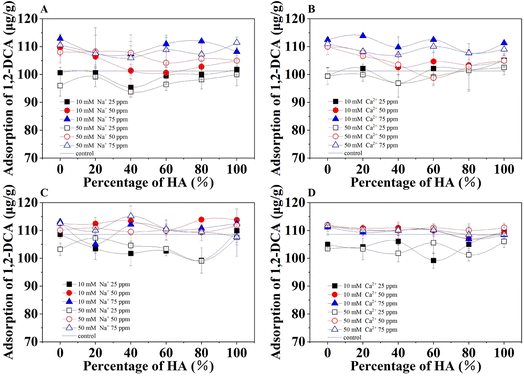
The results of 1,2-DCA adsorption on soils with and without the presence of FA and HA are presented in Fig. 5. Generally, the presence of FA and HA in soils increased the adsorption of 1,2-DCA in both original and the high temperature and H2O2 oxidation treated soils. The adsorption on untreated sandy loam (108.84 μg g−1) was slightly higher than on loamy sand (103.43 μg g−1), while the adsorption on treated loamy sand (95.56 μg g−1) was higher than that of treated sandy loam (89.18 μg g−1). These observations can be partially attributed to the differences in soil organic matter. Original sandy loam (Fig. 5B) had a higher organic matter content and showed higher adsorption than original loamy sand (Fig. 5A). The 1,2-DCA adsorption in the presence of FA (0%) or HA acid (100%) only (Fig. 5A and B) was higher than that of FA and HA mixtures. Adsorption in the presence of FA and HA mixtures showed fluctuations as an increase in HA fractions without a linear relation. This can be attributed to the inherent water–soluble properties of the FA and HA associated with the partitioning equilibrium process between the soil and water.27,28Soil texture is a determinant of water flow and water holding capacity, and therefore affects the leaching of dissolved components from soils.29 The leaching of FA and HA mixtures from the loamy sand was higher than in the sandy loam under all other conditions. In addition, the leaching from both original soils was higher than in the treated soils. In particular, the leaching varied from only 0.1% to 1.3% in treated sandy soils (Fig. 4). These results indicated that the high-temperature and oxidation-treated soils interacted strongly with the FA and HA and this interaction tended to be irreversible.
The partitioning effect of FA and HA mixture between soil and water was balanced toward the aqueous phase and shifted the adsorption equilibrium, thus reducing the adsorption of 1,2-DCA.6 In the original untreated soils, the loamy sand tended to show lower adsorption than the control without the presence of FA or HA, while the sandy soil had higher adsorption than the control (Table S4†). The presence of FA and HA did not cause significant changes in adsorption under different solution pH (Table S5†).
The adsorption of 1,2-DCA in soils treated with different FA and HA mixtures under ionic strength of 10 and 50 mM NaCl or CaCl2 (Fig. 6) further demonstrated the increased adsorption with a larger amount of presented organic acids. However, the ionic strength played a much less important role in the differences in adsorption under these selected experimental conditions. Compared with the fluctuations in adsorptions under different mixtures of organic acid in the presence of NaCl, the adsorption in sandy loam in the presence of CaCl2 was relatively stable. This can be attributed to the stable complexes of Ca2+ with carboxyl groups that are independent of the magnitude of the ionic strength.30,31
The UV spectra of 1,2-DCA in solution before and after the interaction with FA and HA are shown in Fig. S1.† Generally, FA has abundant reactive groups, especially ascribed to C![[double bond, length as m-dash]](https://www.rsc.org/images/entities/char_e001.gif) C and aromatic hydrocarbon structures. The HA has a more complex carbon-containing molecular structure, then the characteristic absorption of UV by FA is more potent (Table S3†). However, the UV absorption intensity of the solution increased after the interaction with 1,2-DCA, compared to the intensity without 1,2-DCA (Table S3†). The interaction of 1,2-DCA with the reactive groups of FA is stronger in the mixture of FA and HA, while the changes in UV spectra before and after the interaction of 1,2-DCA with HA are less pronounced, compared with those with FA. The FTIR results of soil grains treated with FA and HA are shown in Fig. S2A and B†. Three characteristic peaks at 1000, 775, and 700 cm−1 point to the C–H contraction vibration, bending outwards from the plane of the structure of aromatics. The higher strength of the sandy loam indicates the role of hydrophobic properties in the interaction of humic acids with soil colloids. XRD (Fig. S3A and B†) indicates that loamy sand shows better crystallization properties than sandy loam. The inorganic crystals of both soils consist of silicates and calcium oxides, and the loamy sand has higher water affinity. Diffraction peaks at 2θ = 26.7° reflecting the crystalline SiO2 are generally higher in loamy sand than in sandy loam under the same conditions. The intensity of the diffraction peak increases with increasing HA content. The hydrated colloids in loamy sand bind more readily to HA than to FA, and the hydrophobic effect of loamy colloids on 1,2-DCA is weaker. The above analyses combined with the results of leaching of FA and HA from the soil indicate that the stability of the binary system of FA and HA bound to the soil is weaker than the stability of the single FA or HA system bound to the soil.32 Therefore, single FA or HA elevated the adsorption of 1,2-DCA in soil, while the adsorption of 1,2-DCA in soil decreased in the binary system.33
C and aromatic hydrocarbon structures. The HA has a more complex carbon-containing molecular structure, then the characteristic absorption of UV by FA is more potent (Table S3†). However, the UV absorption intensity of the solution increased after the interaction with 1,2-DCA, compared to the intensity without 1,2-DCA (Table S3†). The interaction of 1,2-DCA with the reactive groups of FA is stronger in the mixture of FA and HA, while the changes in UV spectra before and after the interaction of 1,2-DCA with HA are less pronounced, compared with those with FA. The FTIR results of soil grains treated with FA and HA are shown in Fig. S2A and B†. Three characteristic peaks at 1000, 775, and 700 cm−1 point to the C–H contraction vibration, bending outwards from the plane of the structure of aromatics. The higher strength of the sandy loam indicates the role of hydrophobic properties in the interaction of humic acids with soil colloids. XRD (Fig. S3A and B†) indicates that loamy sand shows better crystallization properties than sandy loam. The inorganic crystals of both soils consist of silicates and calcium oxides, and the loamy sand has higher water affinity. Diffraction peaks at 2θ = 26.7° reflecting the crystalline SiO2 are generally higher in loamy sand than in sandy loam under the same conditions. The intensity of the diffraction peak increases with increasing HA content. The hydrated colloids in loamy sand bind more readily to HA than to FA, and the hydrophobic effect of loamy colloids on 1,2-DCA is weaker. The above analyses combined with the results of leaching of FA and HA from the soil indicate that the stability of the binary system of FA and HA bound to the soil is weaker than the stability of the single FA or HA system bound to the soil.32 Therefore, single FA or HA elevated the adsorption of 1,2-DCA in soil, while the adsorption of 1,2-DCA in soil decreased in the binary system.33
3.4. Influence of pH on 1,2-DCA adsorption
As shown in Fig. 7, 1,2-DCA adsorption generally increased as an increase in the total amount of organic acid mixtures. The adsorption of 1,2-DCA at pH 4 was significantly higher than that at pH 10. Under the condition with HA only (100%), the adsorptions under various contents of HA were similar, while the presence of FA only tended to increase adsorption. This indicated that HA played a less important role compared to FA in the 1,2-DCA adsorption. Moreover, in sandy loam (Fig. 7C and D), different proportions of the organic acid mixture did not significantly influence the adsorption. Therefore, hydrophobic adsorption was the important mode of HOC binding on soils. It has been reported that solution pH can change the adsorption capacity of soil with HOC such as anthracene by altering the structure of humic substances and changing the number of adsorption sites.7 The large number of ionizable functional groups generates a significant particle electric field, which influences the interactions with charged ions.11,16 Similarly, polar HOC such as 1,2-DCA has a high water solubility. Thus, its interactions with solid surfaces in the presence of organic acids are complex and specific. Typically, at a low pH, FA and HA tend to interact with the organic in soils via more free groups as adsorption sites and usually bind through hydrogen bonds. Conversely, at high pH conditions, FA and HA tend to form water-soluble free forms that can be transferred to the aqueous phase in the soil and reduce the retention of HOC.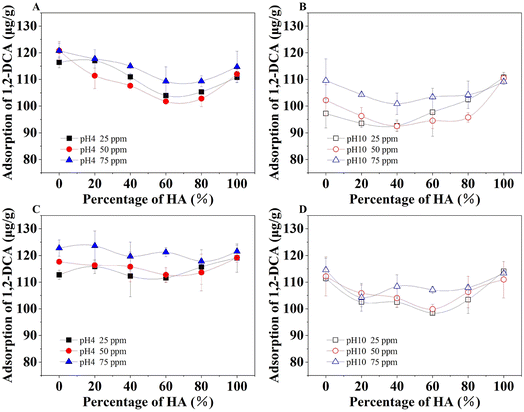 | ||
| Fig. 7 Adsorption of 1,2-DCA in loamy sand (A and B) and sandy loam (C and D) at pH 4 or pH 10 at 20 °C. Total contents of FA and HA mixtures were 25, 50, and 75 ppm, respectively. | ||
3.5. Desorption of 1,2-DCA from soil in water
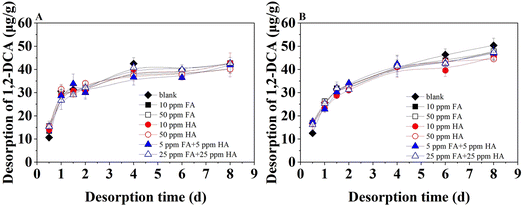
The desorption of 1,2-DCA from the two soils treated with FA and HA mixtures is shown in Fig. 8. Although the original/untreated (control) sandy loam had slightly higher equilibrium adsorption than the loam sand, the hydrophobic binding of 1,2-DCA to sandy loam is less stable. In particular, the 1,2-DCA desorption from loamy sand became stable after 4 days, while the desorption from sandy loam was still increasing after 8 days. Generally, the desorption was slightly higher in the soils without the treatment with organic acids (control) and showed only a minor difference. Within the first 2 days, the desorption rate went through a rapid desorption period. In the first 0.5 h, the desorption from soils treated with HA, FA, or their mixture was stronger compared to the control. This can be caused by the release of organic acids from soils. In the subsequent slow desorption period, desorption from the control was slightly higher and indicated weaker interaction of 1,2-DCA with soils. However, the differences in the desorption from soils in the presence of various concentrations and combinations of organic acids were negligible, and this indicated similar strength of the bindings.5,34 The long aging of 1,2-DCA stabilizes its binding with soils, and the soil further absorbs the FA and HA molecules bound to 1,2-DCA from the aqueous phase, thus creating equilibrium for the processes of adsorption–desorption.13,263.6. The adsorption–desorption of 1,2-DCA on soils in model saturated aquifer
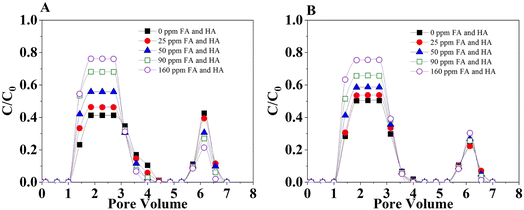
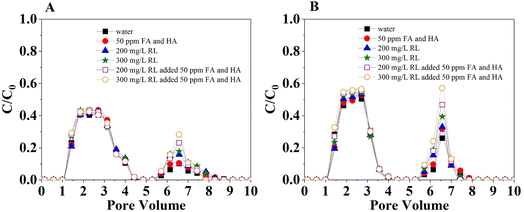
Results on the adsorption (retention) and desorption (release) of 1,2-DCA in model soil (mixed quartz sand and soil) columns in a continuous flow that mimics the saturated aquifer are presented in Fig. 9 and Table S7.† The transport of 1,2-DCA in both soils increased with the increasing concentration of organic acids that coexisted in the flow. For example, when the organic mixtures of FA and HA increased from 0 (control) to 160 mg L−1, the plateau in breakthrough curves increased from 0.41 to 0.76 in loamy sand (Fig. 6A). The transport in sandy loam was slightly stronger than in loamy sand, especially when the organic acids were in a lower level (Fig. 9A and B). However, the difference in 1,2-DCA transport in the two model soils was limited. This is consistent with the results that show stronger 1,2-DCA adsorption in loamy sand discussed in the previous section. These observations also show the different influence of organic acids in the interactions of 1,2-DCA and soils, e.g., in batch experiments, the presence of organic acids previously incorporated in soil surfaces enhanced the adsorption, while their presence in the liquid phase reduced adsorption and thus enhanced transport in the flow.35,36 This information further demonstrated the importance of the interaction between 1,2-DCA and organic acids and the phase partitioning that facilitated the adsorption on soil surfaces in batch adsorption and the transport in the flow in columns. When the columns were eluted with 200 mg L−1 rhamnolipid, the release was observed for all the conditions. The greater adsorption in loamy sand (under control and lower concentration) created greater potential in release thus leading to greater desorption in the elution phase. To further investigate the reversibility of the 1,2-DCA retention in a continuous flow, rhamnolipid, FA, HA, and their different combination were used as eluents. Fig. 10A and B indicate increased release/desorption of retained 1,2-DCA when the rhamnolipid concentration in the eluents was higher. The combination of the highest concentration of rhamnolipid with FA and HA shows the greatest potential to break the interaction of 1,2-DCA and the solid surfaces. Rhamnolipids played a better role in the release of 1,2-DCA, which was attributed to the high surface activity of rhamnolipids and the low CMC value.37,38 Therefore, the observations imply that the combination of organic matter (e.g., FA, HA) and surfactant (e.g., rhamnolipids) can be better for the removal of 1,2-DCA in surfactant-enhanced aquifer remediation. Additionally, due to the increased desorption/release, the risk of 1,2-DCA contamination in groundwater can be increased in the presence of organic matter or surfactant in the liquid phase when the eluent is not effectively collected.4. Conclusions
This study investigated the influence of fulvic acid (FA) and humic acid (HA) on the adsorption–desorption of 1,2-DCA in the solid–water interface via batch and column experiments. The adsorption of 1,2-DCA in soils increased when the organic matter was presented on solid surfaces. This adsorption of 1,2-DCA in the soil-water system was linked to the equilibrium process of partitioning between the inherent water solubility of FA and HA with soil and water. The 1,2-DCA adsorption in the single organic matter treated soil was slightly higher than in the mixture of FA and HA, depending on the binding of FA and HA to the soil grains/colloids. The adsorption of 1,2-DCA under acidic conditions was higher due to the increased interactions with adsorption sites and hydrogen bonds. Conversely, the presence of organic matter in the liquid phase in the porous media reduces the adsorption of 1,2-DCA and increases the transport in the model aquifer due to the association between 1,2-DCA and organic matter. The combination of organic matter and rhamnolipids can help to better remove 1,2-DCA from solid surfaces. Additionally, the risk of 1,2-DCA contamination in groundwater can be increased when the organic matter or surfactant is present in the liquid phase if the eluent is not collected. This study helps to better understand the interaction of soil organic matter and chlorinated hydrocarbons in water and saturated aquifers and the environmental fate and potential removal strategies of chlorinated hydrocarbons in contaminated sites.Conflicts of interest
There are no conflicts to declare.Acknowledgements
This research was funded by the National Key Research and Development Program of China (Grant No. 2020YFC1807104), China Postdoctoral Science Foundation (Grant No. 2021M690763), the Guangxi Ba-Gui Scholars Program (2019A33), the National Natural Science Foundation of China (Grant No. 42167051), Guangxi Natural Science Foundation, China (2023GXNSFAA026386), the Nanning Innovation and Entrepreneurship Leading Talent “Yongjiang Plan” Entrepreneurship Project (2021001), and the Opening Project of National Enterprise Technology Center of Guangxi Bossco Environmental Protection Technology Co., Ltd, Nanning 530007, China.References
- Z. Wu, X. Yu, G. Liu, W. Li, L. Lu, P. Li, X. Xu, J. Jiang, B. Wang and W. Qiao, Environ. Pollut., 2023, 325, 121443–121453 CrossRef CAS PubMed.
- T. Xie, Z. Dang, Q. Zhang, L. Su, Y. Zhou, S. Li, J. Zhang, R. Zhang, C. Liao and G. Lu, Environ. Res., 2023, 216, 114694–114703 CrossRef CAS PubMed.
- L. Eastcott, W. Y. Shiu and D. Mackay, Oil Chem. Pollut., 1988, 4, 191–216 CrossRef CAS.
- J. Sangster, J. Phys. Chem. Ref. Data, 1989, 18, 1111–1229 Search PubMed.
- F. De Marines, I. Cruciata, G. Di Bella, D. Di Trapani, M. G. Giustra, L. Scirè Calabrisotto, P. Greco Lucchina, P. Quatrini and G. Viviani, Int. Biodeterior. Biodegrad., 2023, 183, 105644–105653 CrossRef CAS.
- N. Tang, N. Siebers, P. Leinweber, K. U. Eckhardt, S. Dultz, V. Nischwitz and E. Klumpp, Environ. Sci. Technol., 2022, 56, 14133–14145 CrossRef CAS PubMed.
- Z. Tang, Y. Li, Z. Yang, D. Liu, M. Tang, S. Yang and Y. Tang, Environ. Sci. Pollut. Res., 2019, 26, 20277–20285 Search PubMed.
- M. V. Milyukin, M. V. Gorban and M. V. Gorban, Mediterr. J. Chem., 2020, 10, 32–42 Search PubMed.
- M. O. Boulakradeche, D. E. Akretche, C. Cameselle and N. Hamidi, Electrochim. Acta, 2015, 174, 1057–1066 CrossRef CAS.
- E. Bazilevskaya, D. D. Archibald and C. E. Martínez, Biogeochemistry, 2018, 141, 75–94 CrossRef CAS.
- G. Abate and J. C. Masini, Colloids Surf., A, 2003, 226, 25–34 CrossRef CAS.
- E. M. Peña-Méndez, J. Havel and J. Patočka, J. Appl. Biomed., 2005, 3, 13–24 Search PubMed.
- M. M. Kandil, A. F. El-Aswad and W. C. Koskinen, J. Environ. Sci. Health, Part B, 2015, 50, 473–483 CrossRef CAS PubMed.
- Y. Wang, L. Wang, G. Fang, H. M. Herath, Y. Wang, L. Cang, Z. Xie and D. Zhou, Environ. Pollut., 2013, 172, 86–93 CrossRef CAS PubMed.
- D. Chen, B. Xing and W. Xie, Geoderma, 2007, 139, 329–335 CrossRef CAS.
- R. M. Town and H. P. van Leeuwen, Phys. Chem. Chem. Phys., 2016, 18, 18024–18032 RSC.
- E. M. Murphy, Environ. Sci. Technol., 1990, 23, 754–763 Search PubMed.
- E. M. Murphy, J. M. Zachara, S. C. Smith, J. L. Phillips and T. W. Wietsma, Environ. Sci. Technol., 1994, 28, 1291–1299 CrossRef CAS PubMed.
- N. DiDonato, C. Xu, P. H. Santschi and P. G. Hatcher, Environ. Sci. Technol., 2017, 51, 4803–4811 CrossRef CAS PubMed.
- X. Lian, S. Liao, Y. Yang, X. Zhang and Y. Wang, Langmuir, 2020, 36, 10838–10845 CrossRef CAS PubMed.
- Y. Liang, S. A. Bradford, J. Simunek, H. Vereecken and E. Klumpp, Water Res., 2013, 47, 2572–2582 CrossRef CAS PubMed.
- Y. S. Ho and G. McKay, Can. J. Chem. Eng., 1998, 76, 822–827 CrossRef CAS.
- Y. S. Ho and G. McKay, Process Saf. Environ. Prot., 1998, 76, 183–191 CrossRef CAS.
- M. J. M. Wells, J. Hooper, G. A. Mullins and K. Y. Bell, Sci. Total Environ., 2022, 820, 153070–153080 CrossRef CAS PubMed.
- K. Huo, S. Wang, W. Zhao, H. Guo, W. Xiong, R. Liu and C. Yang, Sci. Total Environ., 2023, 878, 163140–163147 CrossRef CAS PubMed.
- C. Yan, Y. Li, P. Sharma, Q. Chen, B. Li and J. Shang, Chemosphere, 2022, 306, 135555–135566 CrossRef CAS PubMed.
- K. Bjorklund and L. Y. Li, Water Sci. Technol., 2016, 74, 852–860 CrossRef CAS PubMed.
- J. D. S. Lekfeldt, C. Kjaergaard and J. Magid, J. Environ. Qual., 2017, 46, 862–870 CrossRef CAS PubMed.
- B. Tiemeyer, N. Pfaffner, S. Frank, K. Kaiser and S. Fiedler, Geoderma, 2017, 296, 86–97 CrossRef CAS.
- J. Hruska, P. Kram, W. H. McDowell and F. Oulehle, Environ. Sci. Technol., 2009, 43, 4320–4326 CrossRef CAS PubMed.
- B. Li, X. He, P. Wang, Q. Liu, W. Qiu and J. Ma, Water Res., 2020, 183, 116006–116020 CrossRef CAS PubMed.
- J. F. Carstens, J. Bachmann and I. Neuweiler, Eur. J. Soil Sci., 2018, 69, 360–369 CrossRef CAS.
- J. P. Hassett and E. Milicic, Environ. Sci. Technol., 1985, 19, 638–643 CrossRef CAS PubMed.
- K. M. Eltohamy, J. Li, M. Gouda, D. Menezes-Blackburn, P. J. Milham, S. Khan, F. Li, C. Liu, J. Xu and X. Liang, Sci. Total Environ., 2023, 858, 160195–160205 CrossRef CAS PubMed.
- R. Hameed, C. Lei, J. Fang and D. Lin, Environ. Sci. Pollut. Res., 2021, 28, 1574–1586 CrossRef CAS PubMed.
- T. Ritschel, K. Lehmann, M. Brunzel, J. Vitz, I. Nischang, U. S. Schubert and K. U. Totsche, J. Colloid Interface Sci., 2021, 584, 592–601 CrossRef CAS PubMed.
- I. Priyadarshini, A. Chowdhury, A. Rao, B. Roy and P. Chattopadhyay, J. Environ. Manage., 2023, 325, 116596–116608 CrossRef CAS PubMed.
- S. Gaur, A. Sahani, P. Chattopadhyay, S. Gupta and A. Jain, Mater. Today: Proc., 2023, 77, 31–38 CAS.
Footnote |
| † Electronic supplementary information (ESI) available. See DOI: https://doi.org/10.1039/d3ra06568e |
| This journal is © The Royal Society of Chemistry 2024 |

