 Open Access Article
High-performance hexaferrite magnets tailored through alignment of shape-controlled nanocomposites
Anna Zink Eikelanda,
Frederik Holm Gjørup a,
Henrik Lyder Andersen
 b and
Mogens Christensen
 *a
*a
aDepartment of Chemistry & Interdisciplinary Nanoscience Center (iNANO), Aarhus University, Langelandsgade 140, 8000 Aarhus C, Denmark. E-mail: mch@chem.au.dk
bDepartamento de Física de Materiales, Universidad Complutense de Madrid, 28040 Madrid, Spain
First published on 3rd April 2024
Abstract
Nanoparticles of strontium hexaferrite, SrFe12O19, were prepared by two different synthesis methods: hydrothermal (autoclave) and sol–gel autocombustion (solid-salt-matrix). The two synthesis pathways yield nanoparticles with different morphologies and correspondingly different magnetic characteristics. The autoclave synthesis results in large plate-like crystallites, which spontaneously align with a preferred crystallographic orientation when applying a uniaxial pressure, but exhibit a relatively poor coercivity. Meanwhile, the solid-salt-matrix synthesis method results in smaller less anisotropic crystallites with enhanced coercivity, but with a relatively limited ability to align under a uniaxial applied pressure. The obtained nanocrystalline powders were dry or wet mixed in different ratios followed by Spark Plasma Sintering (SPS) into dense pellets. A clear correlation between mixing ratio, the level of alignment and resulting coercivity was observed for the dry mixed samples, i.e. as more solid-salt-matrix powder is added, the texture of the pellets decreases and the coercivity increases. The best performing pellet in terms of maximum energy product (BHmax = 32.1(6) kJ m−3) was obtained by dry-mixing of 75 wt% autoclave prepared powder and 25 wt% solid-salt-matrix powder. The results presented here illustrate the potential of mixing magnetic nanoparticle powders with different shape characteristics to gain improved magnetic performance.
Introduction
Magnetic materials are essential components in a multitude of modern-day electronic devices and green energy technologies. Magnets facilitate the direct interconversion between electricity and motion, which is used for electricity production in e.g. gas/water/wind turbines. By weight, around 80% of the world's production of magnets are M-type hexaferrites.1 However, the magnetic performance of hexaferrite materials has not been improved significantly since their discovery in the 1950's.2 Especially, the M-type Sr-hexaferrite material, SrFe12O19, has drawn much attention as a permanent magnet, due to its combination of good magnetic properties, chemical stability, relatively high Curie temperature (737 K), low cost, and non-toxicity.3 Non-substituted SrFe12O19 has a theoretical maximum energy product of approximately 45 kJ m−3, which is around 50% higher than current commercial hexaferrite magnets.4 In order to enhance its performance, new synthesis routes and compaction methods must be developed and optimised. In this context, sol–gel and hydrothermal synthesis pathways have shown great potential for producing high coercivity nanocrystallites.5–11 However, for practical use the nanopowders must be compacted into dense magnets. This compaction is traditionally done under an externally applied magnetic field to ensure efficient alignment of the magnetic moments in the material. However, our recent work has demonstrated how the texture of the pellets and, in turn, the magnetic properties can be controlled and optimised by tailoring of anisotropic platelet-shaped crystallites that self-align during compaction.11–13The hydrothermal synthesis of SrFe12O19 nanoparticles using an autoclave (AC) is well described in the literature and results in plate-shaped crystallites with 500–1500 nm diameter and a saturation magnetisation of up to 70–74 Am2 kg−1, but a relatively low coercivity of 100–340 kA m−1 due to multiple magnetic domains.14,15 These highly anisotropic SrFe12O19 crystallites have been demonstrated to easily self-align during uniaxial compaction, resulting in dense high-performance magnets with an energy product of up to 34 kJ m−3.10,13,15 The sol–gel synthesis route produces magnetic single-domain SrFe12O19 crystallites characterised by having a coercivity in the range of 450–525 kA m−1 and a magnetic saturation of around 56–66 Am2 kg−1.16,17 One of the main challenges using the sol–gel method is that the crystallites agglomerate, which complicates magnetic alignment during compaction. A modified sol–gel synthesis route, also referred to as solid-salt-matrix (SSM), was first presented by Sapoletova et al. synthesising the SrFe12O19 crystallites in a solid NaCl matrix resulting in plate-like freestanding crystallites.18 The crystallites maintain the high magnetic saturation and coercivity seen for the conventional sol–gel method, while the crystallites are non-aggregated allowing them to align with uniaxial pressure during compaction.12 Both the AC and the SSM methods are cheap, energy efficient, fast, and reliable due to relatively few synthesis steps.
In order to gain the highest possible energy product, BHmax, of a dense magnet, the crystallites must be well aligned and at the same time have a high coercivity. The underlying idea is that self-induced crystallite alignment can be realised by having a large size aspect ratio Dab/Dc (the dimension of the crystallite along the ab-axes divided by the dimension along the c-axis). The AC synthesised crystallites have highly anisotropic shapes and are therefore reported to align better than the SSM synthesised samples. A detailed discussion of the effect on alignment of differently shaped crystallites of SrFe12O19 has been reported by Saura-Múzquiz et al.13 The aim of the present study is to increase the alignment of high-coercivity SSM particles by one of the following approaches: (A) dry mixing of SSM and AC powder followed by Spark Plasma Sintering compaction or (B) wet-mixing by adding SSM crystallites to the AC precursor before the AC synthesis. In the wet mixing approach, the expectation is that the precursor will nucleate on the existing crystallites forming wider and thicker crystallites compared with the as-prepared SSM crystallites. In other words, the resulting crystallites would maintain a high coercivity, but become wider and thereby easier to align. The aim is to combine the virtues of the two types of powder, i.e. the high degree of spontaneous alignment of the anisotropic AC particles and the high coercivity of the SSM particles, and thereby enhance the energy product (BHmax) of a dense pellet made from the powder mixtures. The starting powders were investigated using X-ray powder diffraction, transmission electron microscopy and vibrating sample magnetometry (VSM). Furthermore, X-ray pole figures were measured for the produced pellets to examine their degree of texture. Vibrating sample magnetometry (VSM) was used to characterise the final magnetic properties.
Experimental
Sample preparation
![[thin space (1/6-em)]](https://www.rsc.org/images/entities/char_2009.gif) :
:![[thin space (1/6-em)]](https://www.rsc.org/images/entities/char_2009.gif) [Sr2+] molar ratio 11.5
[Sr2+] molar ratio 11.5![[thin space (1/6-em)]](https://www.rsc.org/images/entities/char_2009.gif) :
:![[thin space (1/6-em)]](https://www.rsc.org/images/entities/char_2009.gif) 1. The metal ion solution was subsequently added to a 1.0 M solution of Na2CO3 (Chem-Solution GmbH, 99.98% purity) under constant stirring, with a [Na+]
1. The metal ion solution was subsequently added to a 1.0 M solution of Na2CO3 (Chem-Solution GmbH, 99.98% purity) under constant stirring, with a [Na+]![[thin space (1/6-em)]](https://www.rsc.org/images/entities/char_2009.gif) :
:![[thin space (1/6-em)]](https://www.rsc.org/images/entities/char_2009.gif) [Cl−] molar ratio equal to 1. Finally, 5.0 M citric acid (>99% purity, Sigma Aldrich) was added and the solution was stirred until the mixture was completely homogeneous. The molar ratio between citric acid and Na2CO3 was 1.5. The solution was dried in a convection oven at 120 °C overnight forming a porous gel. The gel was crushed in a mortar and placed in an approximately 2 mm thick layer in a convection oven for 1 hour at 450 °C, to burn off organic residues. Afterwards, the precursor was calcined for 1 hour at 790 °C and cooled to room temperature.
[Cl−] molar ratio equal to 1. Finally, 5.0 M citric acid (>99% purity, Sigma Aldrich) was added and the solution was stirred until the mixture was completely homogeneous. The molar ratio between citric acid and Na2CO3 was 1.5. The solution was dried in a convection oven at 120 °C overnight forming a porous gel. The gel was crushed in a mortar and placed in an approximately 2 mm thick layer in a convection oven for 1 hour at 450 °C, to burn off organic residues. Afterwards, the precursor was calcined for 1 hour at 790 °C and cooled to room temperature.The product was washed and centrifuged once with 4.0 M HNO3 and four times with distilled water to remove NaCl and potential SrCO3, which is formed due to excess of Sr2+. Finally, the SrFe12O19 powder was dried in a convection oven at 90 °C. The as-prepared SSM powder sample is referred to as SSM100.
![[thin space (1/6-em)]](https://www.rsc.org/images/entities/char_2009.gif) :
:![[thin space (1/6-em)]](https://www.rsc.org/images/entities/char_2009.gif) [Sr2+] molar ratio equal to 6. The metal solution was further diluted with water and 16 M NaOH was added dropwise under constant magnetic stirring, to give a [OH−]
[Sr2+] molar ratio equal to 6. The metal solution was further diluted with water and 16 M NaOH was added dropwise under constant magnetic stirring, to give a [OH−]![[thin space (1/6-em)]](https://www.rsc.org/images/entities/char_2009.gif) :
:![[thin space (1/6-em)]](https://www.rsc.org/images/entities/char_2009.gif) [NO3−] molar ratio of 1.5 and a final Sr2+ concentration of 0.1 M. During addition of the base a homogeneous brown precipitate formed. The precipitate was prepared directly in a Teflon-lined steel autoclave with a volume of 170 ml. The autoclave was placed in a preheated Carbolite convection box furnace set at 240 °C for three hours. Hereafter, the autoclave was cooled to room temperature and the product was washed with 4.0 M HNO3, and subsequently washed three times in deionised water followed by drying at 90 °C. The as-prepared autoclave powder sample is referred to as AC100.
[NO3−] molar ratio of 1.5 and a final Sr2+ concentration of 0.1 M. During addition of the base a homogeneous brown precipitate formed. The precipitate was prepared directly in a Teflon-lined steel autoclave with a volume of 170 ml. The autoclave was placed in a preheated Carbolite convection box furnace set at 240 °C for three hours. Hereafter, the autoclave was cooled to room temperature and the product was washed with 4.0 M HNO3, and subsequently washed three times in deionised water followed by drying at 90 °C. The as-prepared autoclave powder sample is referred to as AC100.Mixing of powders
The AC and SSM synthesised crystallites were mixed in two different ways: (A) dry mixing: the crystallites were dry mixed using a pestle and mortar. (B) wet mixing: the as-prepared SSM powder was mixed into the autoclave precursor mixture prior to heating.![[thin space (1/6-em)]](https://www.rsc.org/images/entities/char_2009.gif) :
:![[thin space (1/6-em)]](https://www.rsc.org/images/entities/char_2009.gif) SSM 75
SSM 75![[thin space (1/6-em)]](https://www.rsc.org/images/entities/char_2009.gif) :
:![[thin space (1/6-em)]](https://www.rsc.org/images/entities/char_2009.gif) 25, 50
25, 50![[thin space (1/6-em)]](https://www.rsc.org/images/entities/char_2009.gif) :
:![[thin space (1/6-em)]](https://www.rsc.org/images/entities/char_2009.gif) 50, and 25
50, and 25![[thin space (1/6-em)]](https://www.rsc.org/images/entities/char_2009.gif) :
:![[thin space (1/6-em)]](https://www.rsc.org/images/entities/char_2009.gif) 75). For each mixture, a total of 0.6 g powder was used. The corresponding samples were named DM75, DM50, and DM25 according to the amount of AC prepared powder in the sample.
75). For each mixture, a total of 0.6 g powder was used. The corresponding samples were named DM75, DM50, and DM25 according to the amount of AC prepared powder in the sample.![[thin space (1/6-em)]](https://www.rsc.org/images/entities/char_2009.gif) :
:![[thin space (1/6-em)]](https://www.rsc.org/images/entities/char_2009.gif) SSM ratios of 75
SSM ratios of 75![[thin space (1/6-em)]](https://www.rsc.org/images/entities/char_2009.gif) :
:![[thin space (1/6-em)]](https://www.rsc.org/images/entities/char_2009.gif) 25, 50
25, 50![[thin space (1/6-em)]](https://www.rsc.org/images/entities/char_2009.gif) :
:![[thin space (1/6-em)]](https://www.rsc.org/images/entities/char_2009.gif) 50 and 25
50 and 25![[thin space (1/6-em)]](https://www.rsc.org/images/entities/char_2009.gif) :
:![[thin space (1/6-em)]](https://www.rsc.org/images/entities/char_2009.gif) 75, as calculated from the theoretical AC synthesis yield, assuming 100% yield with respect to the nominal Fe3+ content. The samples were named WM75, WM50, and WM25 according to the theoretical amount of AC prepared powder in the sample.
75, as calculated from the theoretical AC synthesis yield, assuming 100% yield with respect to the nominal Fe3+ content. The samples were named WM75, WM50, and WM25 according to the theoretical amount of AC prepared powder in the sample.Spark plasma sintering
The powder samples were compacted into dense pellets using a Spark Plasma Sintering (SPS) press (SPS Syntex Inc., Dr Sinter Lab™ series). Approximately 0.45 g powder were loaded into a graphite matrix of 8 mm inner diameter. The uniaxial pressure was initially set to 55 MPa and the temperature was ramped from room temperature to 600 °C within 2 min. The temperature was held at 600 °C for 1 min, while the pressure was ramped to 100 MPa and held for 5 min. After 1 min holding time at 600 °C, the temperature was ramped to 950 °C within 3 min and held for 2 min, before releasing the uniaxial pressure and cooling the sample. The total compaction programme took 8 min. The resulting pellets have a typical thickness of ∼1.2 mm.Characterisation
The same diffractometer was used for pole figure measurements, collected in reflection geometry with cross beam focus optics (CBO-f) to produce an approximate beam size of 0.4 × 0.4 mm2. The reflections (110), (008), (107), and (114) were selected for pole figure measurements, and the background was collected at 2θ = 61.2°. The pole figures were obtained by performing 360° ϕ-scans in steps of 5° and χ-scan between 75° and 0°, likewise in steps of 5°. The obtained pole figures were evaluated using the MTEX software version 5.8.0 to extract the orientation distribution function (ODF).19
Magnetisation measurements
A Physical Property Measurement System (PPMS) from Quantum Design, equipped with a Vibrating Sample Magnetometer (VSM) was used for assessing the magnetic properties of the powders as well as the pellets. The as-prepared powders were pressed into pellets with a diameter of 3 mm and a thickness of ∼1 mm using a handheld press, while the SPS sintered pellets were cut into rectangular shapes with approximate dimensions of 2 × 2 × 1 mm3. Cylindrical near-zero background brass holders were used together with quartz rods to hold the sample in place during the measurement. Hysteresis curves were measured at 300 K in an external applied magnetic field cycled between ±3 T. The saturation magnetisation, MS, was determined based on the law of approach to saturation.20 To account for the sample demagnetisation, an “infinite slope” approximation was done for the pellet samples as described by Saura-Múzquiz et al.5 The magnetic field applied to the loose powder samples were not corrected for the self-demagnetising field from the samples.Results and discussion
Phase and morphology identification
PXRD patterns were collected for all powder samples and analysed by Rietveld refinement using the FullProf Suite software.21 Fig. 1 shows the Rietveld refinement of the data collected for AC100, DM50, WM50, and SSM100. All samples consist mainly of crystalline SrFe12O19; the reference sample AC100 contains 99.3(5) wt% of SrFe12O19. Where α-Fe2O3 is the only detectable impurity phase (<1 wt%). No impurities are observed for SSM100.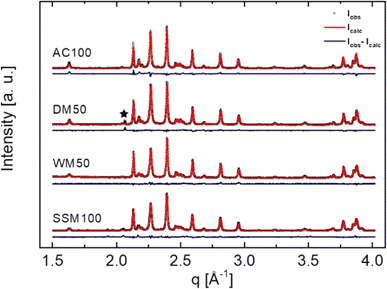 | ||
| Fig. 1 Powder X-ray diffraction (black) and Rietveld refined (red) patterns of AC100, DM50, WM50, and SSM100 and difference plots (blue). The black star in the DM50 sample denotes a peak from the sample holder. The Rietveld refinements indicated no α-Fe2O3 for the dry mixed powders. The WM series contains between 4.8(1) and 2.6(1) wt% α-Fe2O3. Table 1 shows the extracted values from the Rietveld refinement of all samples. | ||
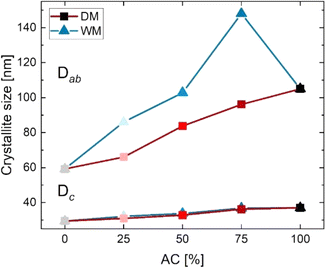
The size and morphology of the SrFe12O19 nanocrystallites, influences the magnetic properties considerably and depend on the employed synthesis method.22 Table 1 shows the calculated crystallite sizes from the refined PXRD patterns. It was found that crystallites prepared by the AC method are large thin plates with coherently scattering domains having a width of 105(1) nm along the crystallographic a/b-axis (referred to as the Dab-size), and an apparent thickness of 37.0(4) nm along the c-axis (Dc-size). The SSM prepared crystallites have a Dab of 59.2(4) nm and a Dc of 29.4(2) nm. The dry mixed samples were refined as a single phase despite the size differences of the constituents (SSM100 and AC100). The crystallite size in the DM series increases with amount of AC powder from Dab = 66.0(3) nm to Dab = 96.1(6) nm with a Dc of between 30.9(1) and 36.2(2) nm, which was expected since the extracted crystallite sizes are an average of the two SrFe12O19 powders contained in the sample.
| Sample name | SrFe12O19 wt% | ab-Axis (Å) | c-Axis (Å) | Dab-size (nm) | Dc-size (nm) | Dab/Dc | Ms (Am2 kg−1) | Hc (kA m−1) |
|---|---|---|---|---|---|---|---|---|
| AC100 | 99.3(5) | 5.88574(4) | 23.0843(2) | 105(1) | 37.0(4) | 2.84(4) | 67.49(2) | 130(1) |
| DM75 | 100 | 5.88356(2) | 23.0712(1) | 96.1(6) | 36.2(2) | 2.65(2) | 64.95(3) | 171(2) |
| DM50 | 100 | 5.8841(3) | 23.0682(2) | 83.7(5) | 32.8(2) | 2.55(2) | 62.77(3) | 225(3) |
| DM25 | 100 | 5.88472(2) | 23.0628(2) | 66.0(3) | 30.9(1) | 2.14(1) | 61.77(4) | 340(3) |
| WM75 | 97.0(2) | 5.89050(2) | 23.0986(1) | 148(10) | 36.8(6) | 4.0(3) | 67.65(4) | 243(3) |
| WM50 | 95.2(1) | 5.89045(1) | 23.1001(1) | 102.8(5) | 33.7(1) | 3.05(2) | 64.04(3) | 344(3) |
| WM25 | 97.4(3) | 5.88454(2) | 23.0647(2) | 86.0(5) | 32.1(2) | 2.68(2) | 67.41(5) | 388(4) |
| SSM100 | 100 | 5.88908(4) | 23.0728(2) | 59.2(4) | 29.4(2) | 2.01(2) | 58.42(5) | 511(6) |
Similar in the DM series, the average crystallite size in the WM-series increases as the content of AC is increased. The width of the crystallites increases from 86.0(6) nm to 148(10) nm, whereas the thickness appears almost unaffected with dimensions between 32.1(2) and 36.8(6) nm. It was anticipated that adding SSM powder to the AC precursor would increase the diameter of the seed crystals, which again would be expected to improve the alignment in the product. All WM powders consist of larger crystallites than the pristine SSM100 sample, and WM75 also exceed AC100 having a Dab of 148(10) nm. It should be noted that the crystallite sizes in some cases are on the limit of what is possible to accurately extract from the peak profile refinement, however, trends between the different samples are still valid (Fig. 2).
Transmission electron microscopy
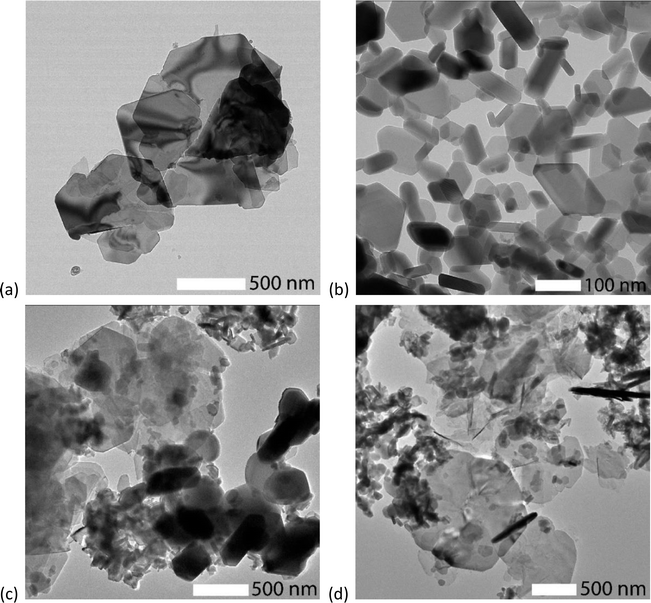
TEM images were collected on the AC100, SSM100, DM50, and WM50 samples (see Fig. 3(a)–(d)). AC100 and SSM100 both consist of hexagonal plates with a relatively broad size distribution. The AC100 particles are large, up to 1500 nm, whereas SSM100 are found as particles with diameter <100 nm and with thicknesses ranging from 20 to 50 nm. Note that about half of the particles have the c-axis parallel with the TEM grid, due to the smaller broadness/thickness (Dab/Dc) ratio. DM50 contains 50% AC and 50% SSM powder, dry mixed. Fig. 3(c) shows the DM50 sample, at the top of the image are large platelets originating from the AC synthesised. While at the lower right corner, smaller and thicker particles are observed these are like the SSM prepared particles. The WM50 sample look similar to the DM50 sample containing both large and small particles. It was not possible to detect a difference related to particle growth. The TEM images of AC100, DM50 and WM50 show significantly larger particles than the crystallite sizes calculated from the Rietveld refinements. The difference is partly due to the PXRD resolution limit. Depending on the experimental setup, the upper limit for reliable size determination of crystallite sizes is typically around 100 nm.23 Furthermore, the AC particles tend to form cracks breaking the coherently scattering domains and thereby making the particle look larger than the coherent crystalline domains within the particle.10Pole figures
All samples were compacted into pellets using SPS, denoted in the sample naming by a P_ prefix. The density of the pellets were between 92 and 98% of the theoretical density (5.1 g cm−3). X-ray pole figure measurements were collected on the SPS compacted pellets to obtain information on the preferred orientation of the crystallites within the pellets. From the pole figures, an orientation distribution function (ODF) for each sample was calculated. The pole figures are normalised, such that a complete random distribution of crystallite orientations results in a pole figure intensity of 1 m.r.d (multiples of random distribution) for all orientations. Fig. 4 shows the reconstructed [00l] pole figure of each pellet calculated from the ODFs, seen along the uniaxial pressing direction.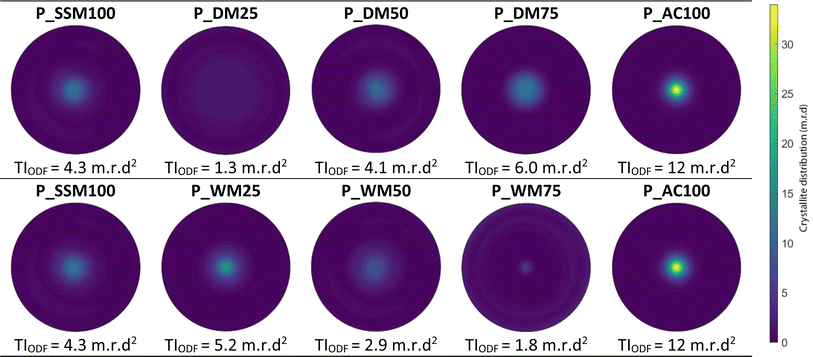 | ||
| Fig. 4 Reconstructed (00l) pole figures from the orientation distribution function. The Pole figures are shown along the sample normal, using equal-area projection. | ||
Due to the plate-like morphology of the particles, the crystallite [00l] direction tends to align parallel to the pellet normal, resulting in an increased pole figure density towards the center of the pole projection.24 The texture index (TIODF), extracted from the ODFs, represents the mean-square value of the ODF, and gives information about the degree of texture in the sample. As such, a perfectly uniform orientation distribution gives a TIODF of 1 m.r.d2, while a perfectly aligned sample (single crystal) have a TIODF of infinity.25 Here, P_AC100 has the highest degree of texture of the examined pellets with a texture index of TIODF = 12 m.r.d2. Due to the high degree of texture, the intensity is highest in the middle of the pole figure and drops rapidly going out from the centre. The least textured sample is P_DM25 with a texture index of TIODF = 1.3 m.r.d2. Consequently, the intensity distribution on the pole figure is close to homogeneous. For the DM samples, the texture of the pellets enhances as the amount of AC powder increases. This is rationalised to be an effect of the increase in aspect ratio (Dab/Dc), see Table 1 as the amount of AC increases. The drop in texture for P_DM25 indicates that some amount of AC powder is necessary to influence the alignment. In the WM series, P_WM25 has the highest degree of texture with a TIODF of 5.2 m.r.d2. P_WM50 and P_WM75 both show less texture than P_SSM100. The trend shows that the texture drops from P_WM25 to P_WM75, which contradicts our initial hypothesis that larger aspect ratio should provide a better alignment as the Dab/Dc is increasing from P_WM25 to P_WM75, see Table 1. We have not been able to establish a plausible explanation for the trend in the wet mixed samples, however our initial hypothesis that increasing the AC content would make it easier to align appears to be wrong.
Magnetic measurements
The magnetic performance was obtained for the as-prepared powders as well as the compacted pellets. An overview of the magnetic properties of the powders can be found in Table 1, while the magnetic properties of the pellets are found in Table 2.| Sample | Ms (Am2 kg−1) | Mr (Am2 kg−1) | Mr/Ms | Hc (kA m−1) | BHmax (kJ m−3) | TI (r.m.d2) |
|---|---|---|---|---|---|---|
| P_AC100 | 73.71(2) | 69.79(1) | 0.95 | 120(1) | 25.3(6) | 12 |
| P_DM75 | 73.56(2) | 66.33(9) | 0.90 | 183(4) | 32.1(7) | 6.0 |
| P_DM50 | 68.77(2) | 59.01(1) | 0.86 | 204(2) | 26.9(6) | 4.1 |
| P_DM25 | 63.7(5) | 52.48(1) | 0.82 | 260(3) | 21.6(5) | 1.2 |
| P_WM75 | 71.00(3) | 54.45(2) | 0.77 | 352(8) | 21.9(6) | 1.8 |
| P_WM50 | 69.66(3) | 54.55(2) | 0.78 | 339(6) | 22.2(6) | 2.9 |
| P_WM25 | 74.66(8) | 58.77(2) | 0.79 | 147(4) | 24.3(6) | 5.2 |
| P_SSM100 | 71.61(2) | 60.85(2) | 0.85 | 373(5) | 28.1(8) | 4.3 |
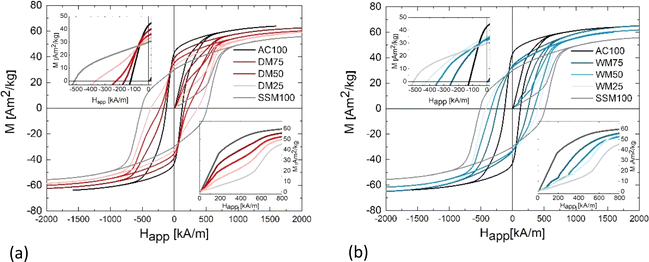
Fig. 5 show the hysteresis curves from the powder samples. The extracted magnetic values are plotted in Fig. 6. Fig. 5(a) shows the hysteresis curves of the dry mixed powder (DM) together with AC100 and SSM100 as references. The AC starting powder has a Ms of 67.49(2) Am2 kg−1, while the SSM sample has a Ms of 58.42(5) Am2 kg−1. For the dry mixed samples, Ms was found to be in the interval of 61.77(4)–64.95(3) Am2 kg−1, increasing with the amount of AC powder. The as-prepared powder from the AC method has a Hc of 130.2(8) kA m−1. The powder prepared using the SSM method has a Hc of 511(6) kA m−1. Hc decreases monotonically with amount of AC powder added to the mixture going from 340(3) kA m−1 for DM25 to 171(2) kA m−1 for DM75. The dry mixed powders all show a kink in the second quadrant indicating that the resulting hysteresis curves are a sum of two uncoupled phases, i.e. the samples act as a two-phase system. The as-prepared powders have very different morphologies and consequently different magnetic features, and they would therefore be expected to behave as a two-phase system. In other words, the hysteresis curves can be interpreted as the superposition of the two powders. The different magnetic characteristics are also reflected by the virgin curves, shown in the inset in the fourth quadrant. The slope of the virgin curve reveals information about the particle sizes: large magnetic multi-domain particles tend to respond fast to an applied magnetic field due to domain wall motion, whereas smaller crystallites respond more slowly to an applied field as they consist of single magnetic domains. The virgin curves of AC100 indicates that the sample consists of the largest particles and respond very rapidly to the applied magnetic field whereas the sample containing the smallest crystallites (SSM100) respond more slowly to the applied magnetic field.
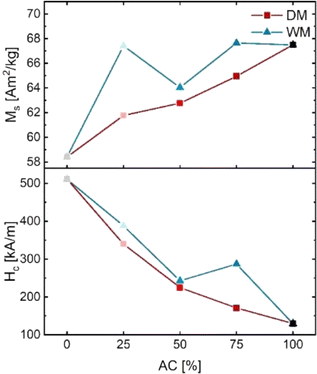 | ||
| Fig. 6 Magnetic saturation (Ms) and coercivity (Hc) of the DM and WM series extracted from the obtained hysteresis curves. | ||
Fig. 5(b) shows the plotted hysteresis curves of the wet mixed series. Contrary to the dry mixed series, the slopes of the curves do not show any kinks which means that the samples act as one-phase systems. This is the expected behaviour if the AC precursor is growing onto the SSM seed crystals during the autoclave synthesis. WM75 consists, on average, of crystallite sizes larger then AC100, but the virgin curves reveal that the response to the magnetic field is slower, indicating that the morphology of SrFe12O19 is indeed affected when introducing SSM crystallites into the autoclave precursor.
Overall, the WM series follows a similar trend to the DM series even if the deviations are larger. Ms and Hc are slightly higher than the DM samples. WM25 and WM75 have similar Ms of 67 Am2 kg−1 whereas WM50 has a Ms of 64.41(5) Am2 kg−1. Hc increases with amount of added SSM prepared powder. AC100 has a Hc of 130(1) kA m−1 which is increased by 300% to 388(4) kA m−1 for WM25. The shape of the hysteresis curves together with the improved Hc indicates that adding SSM particles to the AC precursor indeed influences the growth, even though no SSM seed crystals were visible in the TEM image in Fig. 3(d).
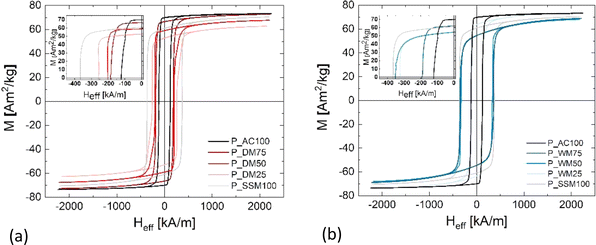
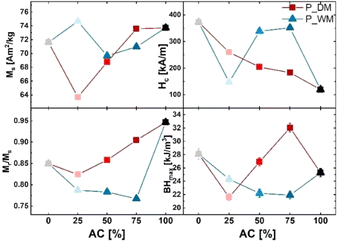
The energy product (BHmax) of the pellets was calculated from the corrected hysteresis curves. The two reference samples have a BHmax of 25.3(6) kJ m−3 (P_AC100) and 28.1 kJ m−3 (P_SSM100), respectively. When mixing the powders, BHmax decreases for P_DM25 due to its low magnetic saturation. For P_DM50, the BHmax is improved to 28.9(7) kJ m−3, and P_DM75 reaches a BHmax of 32.1(7) kJ m−3. It may appear counter intuitive that P_AC100, which exhibits the highest alignment both in terms of texture index (12 r.m.d.2) and Mr/Ms = 0.95, ends up having relatively low BHmax = 25.3(6) kJ m−3 compared with P_DM75 and P_SSM100. However, the maximum energy product (BHMAX) according to the Stoner–Wohlfarth model is BHMAX ∼ ¼μ0 (Mr/Ms)2 × Ms2 (μ0 is the vacuum permeability), i.e. proportional to Mr/Ms, but only if Hc > ½Ms. Therefore, the limiting factor for the BHmax of P_AC100 becomes the coercivity.
The DM series show a clear trend that the alignment increases and the coercivity decreases as the content of AC synthesised powder is increased. The best aligned samples with texture index exceeding 4 r.m.d2 all have a low coercivity <204 kA m−1 except for P_SSM100, which has both high alignment and high coercivity. The coercivity is extrinsically dependent on the crystallite size, plus linked to the magnetocrystalline anisotropy constant K1 and inversely propertional to the remanent magnetisation, through the equation Hc < 2K1/μ0Mr. This can be understood as the magnet attempting to demagnetise itself, when it has a large remanent magnetisation. The samples with low texture index <3 r.m.d2 all have coercivities exceeding 260 kA m−1, these samples all have Mr < 55 Am2 kg−1. The results demonstrate that optimising magnetic properties is a challenging task and involves length scales ranging from the atomic scale governing (Ms) to the nanoscale controlling Hc and the texture on the micrometer scale, which in turn affecting the Mr and potentially also Hc.
The DM series in general shows better magnetic features than the WM series. One of the challenges with the WM method is that the SSM powder may aggregate in the bottom of the autoclave and cause the crystallites to intergrow or prevent part of the powder to act as nucleating seeds during the synthesis. The approach described in this paper allow us to some extend to disentangle two of the essential parameters for improving the magnetic performance, i.e. squareness ratio and coercivity. By sintering the mixed powder into a dense pellet, the powders couple magnetically and act as a single magnetic phase. In other words, the final pellet gets the best from two worlds: A higher coercivity relative to the pure AC powder and a higher Mr/Ms, value relative to the pure SSM powder resulting in a larger BHmax. In the presented study, the best performing pellet contains 75% AC powder. Here, the Mr/Ms value is decreased by 5% when compared to the pure AC powder pellet, but the coercivity is enhanced by 34% resulting in 183(4) kA m−1 and a BHmax of 32.1(7) kJ m−3.
Understanding the connection between crystallite morphology, magnetic properties and texture is fundamental when optimising and designing magnetic materials via nanostructuring. Here, we have taken a large step in demonstrating that conventional synthesis methods can be used to gain control of sample texture and that it is possible to separately optimise physical properties and thus build new knowledge on how to tailor new magnetic materials to fit very specific needs.
Conclusions
SrFe12O19 powders with different morphologies were synthesised and mixed in different ratios. The mixing was done by (A) dry mixing using mortar and pestle and (B) by wet mixing by adding premade solid-salt-matrix (SSM) SrFe12O19 crystallites to the precursor solution that was reacted in an autoclave (AC). The reference powders, obtained from solid-salt-matrix synthesis or hydrothermal autoclave synthesis, had very different size and morphology and different magnetic characteristics. The composition, size, and morphology of the crystallites were characterised using powder X-ray diffraction, Rietveld refinement, and transmission electron microscopy. The autoclave powder crystallites were found to have a large aspect ratio, i.e. a large size along the ab-axes compared with the c-axis giving it a high tendency to align, while the SSM powder gave smaller crystallites, with less anisotropic shape, resulting in a higher coercivity but lower degree of alignment.The mixed powders were compacted into dense pellets using a Spark Plasma Sintering system. By combining the two powders it was possible to improve the energy product relative to the pellets made from the pristine powders. In fact, for the dry mixed pellet containing 75% AC powder, a BHmax of 32.1(7) kJ m−3 was achieved, which is an improvement of 14% or 27% relative to the reference samples SSM100 and AC100, respectively. The experiments illustrate how combining crystallites with different morphologies and magnetic characteristics make it possible to tailor and optimise the magnetic properties of the dense magnet. The results highlight the potential of using nanostructuring in the production of high-performance permanent magnets.
Author contributions
Anna Zink Eikeland: investigation (lead), curation (lead), formal analysis (lead), original draft preparation (lead). Frederik Holm Gjørup: analysis (supporting), review and editing (supporting). Henrik Lyder Andersen: analysis (supporting), review and editing (supporting). Mogens Christensen: supervision (lead), review and editing (equal).Conflicts of interest
There are no conflicts to declare.Acknowledgements
This work was financially supported by the Independent Research Council (METEOR 1032-00251B) and the Carlsbergfondet (CF16-0084). Aref Hasen Mamakhel is acknowledge for helping with TEM images and affiliation with Center for Integrated Materials Research (iMAT) at Aarhus University is gratefully acknowledged. H. L. A. acknowledges funding from the Spanish Ministry of Universities (Ministerio de Universidades) and the European Union – NextGenerationEU through a Maria Zambrano – attraction of international talent fellowship grant.References
- C. Granados-Miralles, M. Saura-Múzquiz and H. L. Andersen, in Ceramic Materials, ed. A. Borrell and R. Benavente, IntechOpen, Rijeka, 2023, ch. 4, pp. 1–22 Search PubMed.
- J. J. Went, G. W. Rathenau, E. W. Gorter and G. W. Van Oosterhout, Phys. Rev., 1952, 86, 424–425 CrossRef CAS.
- R. C. Pullar, Prog. Mater. Sci., 2012, 57, 1191–1234 CrossRef CAS.
- F. H. Gjørup, M. Saura-Múzquiz, J. V. Ahlburg, H. L. Andersen and M. Christensen, Materialia, 2018, 4, 203–210 CrossRef.
- M. Saura-Múzquiz, C. Granados-Miralles, M. Stingaciu, E. D. Bøjesen, Q. Li, J. Song, M. Dong, E. Eikeland and M. Christensen, Nanoscale, 2016, 8, 2857–2866 RSC.
- A. Xia, X. Hu, D. Li, L. Chen, C. Jin, C. Zuo and S. Su, Electron. Mater. Lett., 2014, 10, 423–426 CrossRef CAS.
- T. Zhang, X. Peng, J. Li, Y. Yang, J. Xu, P. Wang, D. Jin, H. Jin, B. Hong, X. Wang and H. Ge, J. Magn. Magn. Mater., 2016, 412, 102–106 CrossRef CAS.
- L. A. Garcia-Cerda, O. S. Rodiguez-Fernández and P. J. Reséndiz-Hernández, J. Alloys Compd., 2004, 369, 182–184 CrossRef CAS.
- X. Yang, Q. Li, J. Zhao, B. Li and Y. Wang, J. Alloys Compd., 2009, 475, 312–315 CrossRef CAS.
- A. Z. Eikeland, M. Stingaciu, C. Granados-Miralles, M. Saura-Muzquiz, H. L. Andersen and M. Christensen, CrystEngComm, 2017, 19, 1400–1407 RSC.
- M. Stingaciu, A. Z. Eikeland, F. H. Gjørup, S. Deledda and M. Christensen, RSC Adv., 2019, 9, 12968–12976 RSC.
- A. Z. Eikeland, M. Stingaciu, A. H. Mamakhel, M. Saura-Múzquiz and M. Christensen, Sci. Rep., 2018, 8, 1–9 CrossRef CAS PubMed.
- M. Saura-Múzquiz, A. Z. Eikeland, M. Stingaciu, H. L. Andersen, C. Granados-Miralles, M. Avdeev, V. Luzin and M. Christensen, Nanoscale, 2020, 12, 9481–9494 RSC.
- A. Baykal, M. S. Toprak, Z. Durmus and H. Sozeri, J. Supercond. Novel Magn., 2012, 25, 2081–2085 CrossRef CAS.
- M. Stingaciu, M. Topole, P. McGuiness and M. Christensen, Sci. Rep., 2015, 5, 1–8 Search PubMed.
- I. Ali, M. U. Islam, M. S. Awan, M. Ahmad and M. A. Iqbal, J. Supercond. Novel Magn., 2013, 26, 3315–3323 CrossRef CAS.
- T. T. V. Nga, N. P. Duong, T. T. Loan and T. D. Hien, J. Alloys Compd., 2014, 610, 630–634 CrossRef CAS.
- N. A. Sapoletova, S. E. Kushnir, Y. H. Li, S. Y. An, J. Seo and K. H. Hur, J. Magn. Magn. Mater., 2015, 389, 101–105 CrossRef CAS.
- F. Backmann, R. Hielscher and H. Schaeben, Math. Geosci., 2010, 160, 63–68 Search PubMed.
- B. D. Cullity and C. D. Graham, Introduction to Magnetic Materials, WILEY, 2nd edn, 2009 Search PubMed.
- J. Rodríguez-carvajal, Introduction to the Program Fulprof: Refinement of Crystal and Magnetic Structures from Powder and Single Crystal Data Search PubMed.
- J. Hölscher, M. Saura-Múzquiz, J. Ahlburg, M. Mørch, D. K. Grønseth and M. Christensen, J. Phys. D Appl. Phys., 2020, 53, 9 CrossRef.
- C. Weidenthaler, Nanoscale, 2011, 3, 792–810 RSC.
- M. Saura-Múzquiz, C. Granados-Miralles, H. L. Andersen, M. Stingaciu, M. Avdeev and M. Christensen, ACS Appl. Nano Mater., 2018, 1, 6938–6949 CrossRef.
- D. Chateigner, L. Lutterotti and M. Morales, Powder Diffraction, in International Tables for Crystallography, Volume H, 2019, p. 564 Search PubMed.
- M. Saura-Muzquiz, PhD thesis, Aarhus University, 2017.
| This journal is © The Royal Society of Chemistry 2024 |

