
 Open Access Article
 This Open Access Article is licensed under a
 Creative Commons Attribution 3.0 Unported Licence
Mid-infrared spectroscopy and machine learning for postconsumer plastics recycling†
Nicholas
Stavinski‡
 a,
Vaishali
Maheshkar‡
b,
Sinai
Thomas
a,
Karthik
Dantu
*b and
Luis
Velarde
*a
a,
Vaishali
Maheshkar‡
b,
Sinai
Thomas
a,
Karthik
Dantu
*b and
Luis
Velarde
*a
aDepartment of Chemistry, University at Buffalo, State University of New York, Buffalo, New York 14260, USA. E-mail: lvelarde@buffalo.edu
bDepartment of Computer Science and Engineering, University at Buffalo, State University of New York, Buffalo, New York 14260, USA. E-mail: kdantu@buffalo.edu
First published on 6th July 2023
Abstract
Materials recovery facilities (MRFs) require new automated technologies if growing recycling demands are to be met. Current optical screening devices use visible (VIS) and near-infrared (NIR) wavelengths, frequency ranges that can experience challenges during the characterization of postconsumer plastic waste (PCPW) because of the overly-absorbing spectral bands from dyes and other polymer additives. Technological bottlenecks such as these contribute to 91% of plastic waste never actually being recycled. The mid-infrared (MIR) region has attracted recent attention due to inherent advantages over the VIS and NIR. The fundamental vibrational modes found therein make MIR frequencies promising for high fidelity machine learning (ML) classification. To-date, there are no ML evaluations of extensive MIR spectral datasets reflecting PCPW that would be encountered at MRFs. This study establishes quantifiable metrics, such as model accuracy and prediction time, for classification of a comprehensive MIR database consisting of five PCPW classes that are of economic interest: polyethylene terephthalate (PET #1), high-density polyethylene (HDPE #2), low-density polyethylene (LDPE #4), polypropylene (PP #5), and polystyrene (PS #6). Autoencoders, an unsupervised ML algorithm, were applied to the random forest (RF), k-nearest neighbor (KNN), support vector machine (SVM), and logistic regression (LR) models. The RF model achieved accuracies of 100.0% in both the C–H stretching region (2990–2820 cm−1) and molecular fingerprint region (1500–650 cm−1). The C–H stretching region was found to be free from additives that were responsible for misclassification in other regions, making it a fruitful frequency range for future PCPW sorting technologies. The MIR classification of black plastics and polyethylene PCPW using ML autoencoders was also evaluated for the first time.
Environmental significancePlastics are central to everyday human life due to their unique chemical and physical properties. Non-degradable post-consumer plastic waste (PCPW), however, raises significant concerns for the environment. Currently, a small fraction of PCPW is recycled, with most ending up in landfills or incinerators. New opportunities for recovering value from PCPW using mid-infrared light (MIR) have emerged. One challenge is to evaluate the effects of spectral contributions from polymer additives embedded within PCPW, as these components may hinder recycling. Here, a MIR database of PCPW addresses a need for high-quality datasets. Autoencoders were implemented as a pre-processing technique for machine learning (ML) classification. Through a synergistic chemistry and ML approach, quantifiable metrics were established for applications in PCPW recycling and upcycling. |
1 Introduction
Plastic pollution is a global crisis,1 affecting air quality,2,3 drinking water,4,5 food sources,6 communities,7 and wildlife.8–11 A 2017 report by Geyer et al. projected plastic waste accumulations in landfills and surrounding environments to reach 12 billion metric tons by the year 2050.12 If current production and energy consumption trends continue, it is believed the negative impacts from plastic pollution will become irreversible.13Consequently, there has been an unprecedented surge of multi-disciplinary research aimed at reducing plastic waste, limiting the production of virgin polymers, and improving pathways for PCPW to re-enter the value chain.14–27 The development of automated optical sorting technologies for implementation at MRFs is one of these active research thrusts in the plastics recycling community.28,29 This is because MRFs currently rely on air jets, magnetic separators, mechanical pistons, and human intervention to sort PCPW, all of which are methods that have been deemed insufficient to meet growing recycling demands.30,31
Artificial intelligence (AI) and computer vision have emerged as potential solutions for high-throughput classification thanks to their scalability, accuracy, and capability to be integrated with sensors.32–45 Pioneering efforts towards high-throughput polymer characterization using MIR spectra are underway, exemplified by the work of Bar-Ziv, Zavala, and co-workers, where novel sensing technologies are being combined with ML hardware.46–48 MIR spectroscopy has some advantages over NIR methods due to the freedom from congested vibrational overtone bands and characteristic polymer vibrations.49 In addition, current NIR devices at MRFs struggle to sort dark-colored or black plastics due the overly absorbing spectral bands.50–53 With these recent advantages, the need for a comprehensive PCPW MIR database has become apparent and validation methods need to be thoroughly examined.
Computers must first learn from experience prior to classification.54 Reports to-date have focused on supervised learning algorithms, but there is a current knowledge gap as to how applicable unsupervised algorithms, such as autoencoders, could be for classification of PCPW spectral datasets. Autoencoders have provided promising results for images of PCPW.55 Therefore, new ML approaches seeking to deconvolute complex MIR spectra must first gain experience from reliable datasets.56,57 Thanks to reports from the microplastics community, ATR-FTIR spectroscopy has proven to be a robust technique for generating MIR databases of marine plastic debris and other polymers.9,58,59
To-date, published MIR datasets do not reflect the molecular heterogeneity of PCPW that would be found on MRF conveyor belts, as microplastics databases are comprised of samples that have been chemically- and physically-altered by environmental factors such as oxidation and UV irradiation. As presented by Andraju et al., significant advances in PCPW research could be achieved by applying ML to spectral datasets comprised of materials that would be found in real-world settings.60 Coupling AI to sensors may provide cost-effective solutions by exploiting the chemical and physical properties of PCPW, therefore enhancing science returns at MRFs. Extrapolation of these properties may also assist with downstream chemical recycling efforts as well. Together, complementary technologies in the mechanical sorting and chemical recycling industries may help mitigate the impact of global warming and reduce greenhouse gas emissions.61
In this work, a MIR database comprised of real-world PCPW was generated, curated, and evaluated with goal of expediting innovation in plastics sorting industries. Containing five resin identification code (RIC) plastics, PET #1, HDPE #2, LDPE #4, PP #5, and PS #6, the database was trained and tested using the following ML algorithms: RF, KNN, SVM, and LR. One-dimensional convolutional neural networks were also evaluated (see ESI Section 3c†). Autoencoders were applied to PCPW MIR spectra for the first time. Classification accuracies and prediction speeds of discrete MIR frequency ranges provided an unprecedented glimpse of the complexity that exists within the global plastic waste crisis. It is anticipated this work will help guide future explorations into building custom ML algorithms for PCPW recycling research, as well as assisting with the development of MIR sensors that seek to record spectra in high-throughput fashion.
2 Material and methods
2.1. Sample preparation
A database of 835 plastic items (167 objects per RIC) consisting of PET, HDPE, LDPE, PP, and PS were collected from residential living areas and university campuses in Buffalo, NY (Table S1†). Organized by their RIC, a 1 × 1 inch sample was removed from each PCPW, given a number identifier, and archived. Samples were prepared using metal-cutting scissors so that a flat surface could be used for ATR-FTIR measurements. Wrapping labels, residual contaminants, and/or food particulates were removed from each sample by washing the materials with deionized water and allowing them to dry overnight prior to analysis. The laboratory benchtop was cleaned regularly with a dampened cloth and then dried to prevent cross-contamination from bulk samples. Virgin polymers used for reference purposes were acquired from Curbell Plastics, Inc. (Orchard Park, NY); it is understood that these polymers may have trace quantities of proprietary additive mixtures embedded within their polymeric matrices, which is why they are used primarily for visual representation in comparison with PCPW that were assessed in this study.2.2. ATR-FTIR measurements and processing
A VERTEX 70 FT-IR spectrometer (Bruker, Billerica, MA, USA) equipped with a zinc selenide single-reflection 45° angle ATR accessory (Pike Technologies, Madison, WI, USA) was used to acquire mid-infrared spectra of the prepared PCPW. Spectra for each sample were recorded using 2 cm−1 resolution, a 1.5 mm aperture, 64 background acquisitions, and 32 sample acquisitions. Three spectra per unique sample were recorded to build the database and introduce variability in intensity between each measurement. This was achieved by sampling different surface locations across the sample and reapplying different amounts of force to the ATR accessory's pressure head. Spectra were acquired from 4000 to 650 cm−1 and processed using OPUS 7.5. Each spectrum contains 3474 data points, where each point represents the intensity in percent transmittance or absorbance units at a given wavenumber. The raw spectra (percent transmittance) were processed by converting from percent transmittance to absorbance, applying a concave rubber band baseline correction (10 iterations, 64 baseline points, and excluded CO2 bands), and performing a minimum/maximum normalization.2.3. Classification methods
A key advancement in this work compared to prior work is the use of autoencoders, a modern machine learning technique to identify unique features in training data. An autoencoder is composed of an encoder and a decoder sub-model. The encoder compresses the input, and the decoder recreates the input from the compressed version provided by the encoder. Autoencoders learn how to efficiently compress and encode data. Typically, autoencoders reduce data dimensions by learning to ignore noise found within data.62 In our approach, we only use the encoder part of the autoencoder. After training, the decoder is discarded. The encoder is used for feature extraction and the features are passed on to classification algorithms for accurate classification. Four hyperparameters were used: code size (3474 nodes), number of layers (2 encoder and 2 decoder), number of nodes (6948 nodes in encoder layer 1 and 3474 nodes in encoder layer 2. 3474 in decoder layer 1 and 6948 nodes in decoder layer 2), and loss function (mean squared error). We test several classifiers for their classification accuracy using our autoencoder-based features. They include KNN, LR, SVM, and RF. KNN is a supervised learning algorithm which makes predictions by calculating the distance between the test data point and training data points. The class containing K data points nearest to the test data point is selected as the class for the test datapoint. LR is used to predict the probability of a target variable based on the relationship between existing independent variables. It is used when the target variable is binary and widely used for classification. SVM finds an optimal boundary, known as a hyperplane, between different classes. It maximizes the separation boundary between data points. The algorithm uses the Radial Basis Function kernel for complex data transformations and maximizes the separation boundaries between data points. RF combines output of multiple decision trees using ensemble technique to produce a single result on majority voting for classification. The single result, which is a combination of learning models, increases the overall accuracy. The RF model was built using the scikit-learn library of Python. The default values of the hyperparameters were applied according to the sklearn application programming interface (API). The parameter default values reported by the sklearn API were also applied to the SVM, KNN, and LR models.A total of 2505 datafiles were acquired (501 MIR spectra per RIC) for this study. A Dell XPS 13 computer (9310 × 64-based PC, Processor-11th Gen Intel (R) Core (TM) i7-1185G7 at 3.00 GHz, 2995 MHz, 4 Core(s), 8 Logical Processors) utilizing Python 3.9.16, Google Colab, and the scikit-learn library was used for processing. The dataset is split into training and testing datasets using a 75![[thin space (1/6-em)]](https://www.rsc.org/images/entities/char_2009.gif) :25 ratio, respectively, with 1878 training files and 627 testing files for each plastic type. Stratification of the dataset is done to ensure that the training and testing sets have the same percentage of samples in the target class as the original dataset.
:25 ratio, respectively, with 1878 training files and 627 testing files for each plastic type. Stratification of the dataset is done to ensure that the training and testing sets have the same percentage of samples in the target class as the original dataset.
Learning curves were produced to assess the robustness of the MIR dataset. A loop with increasing training set size was performed, with increments of 10 files (e.g., 90 files per training set size). For each training set size, the accuracy was calculated 10 times via data stratification. The average of the 10 accuracy values was taken. Accuracies were then plotted against the training set size. Confusion matrices for each training set size were produced to indicate the accuracy for each label. The overall performance of the database was validated through a learning curve analysis. The spectral dataset (501 files of each plastic type: PET #1, HDPE #2, LDPE #4, PP #5, PS #6) is split into 75:25 train test ratio resulting in 1878 train files. Test accuracy is calculated for a different number of train files resulting in the curve observed in Fig. 1. As the number of training set samples increases, the test set accuracy saturates showing that the classification accuracy saturates and also indicating that the dataset is robust.
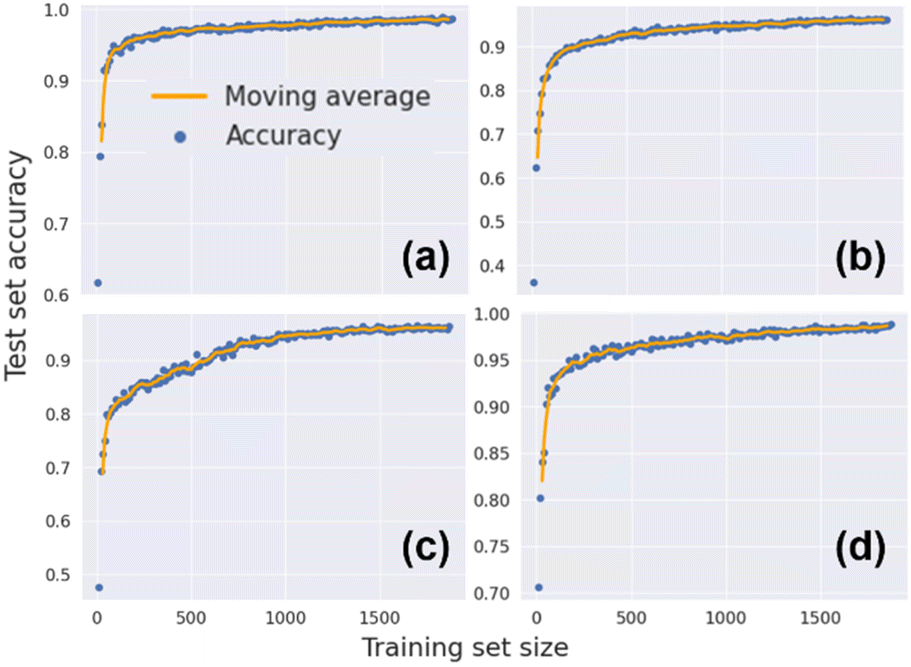 | ||
| Fig. 1 Database learning curves for standard ML models iterated over increasing training set sizes: (a) RF (b) KNN (c) SVM (d) LR. Moving average (yellow line). Accuracy of a single iteration (blue dot). | ||
3 Results and discussion
3.1. Machine learning and discrete mid-infrared regions
Autoencoders were implemented as a pre-processing technique with the RF, KNN, SVM, and LR models to evaluate unsupervised learning of PCPW MIR spectra and improve classification accuracies using standard techniques such as principal component analysis (PCA). Autoencoders compress the most important features of the input data and learn a detailed representation via dimensionality reduction. To the best of the author's knowledge, this is the first demonstration of autoencoders using PCPW MIR spectra, and it could prove to be an important steppingstone for future unsupervised algorithms to be integrated with robotics, standoff detection sensors, and other sorting technologies at MRFs.Three metrics were used to evaluate the performance of each algorithm: (1) classification accuracy, (2) prediction time, and (3) IR frequency region. This study assesses machine learning performances across the entire MIR spectrum so that discrete frequency ranges can be identified for practical implementation at MRFs. Three datasets were evaluated: the entire MIR from 4000–650 cm−1, the C–H stretching region from 2990–2820 cm−1, and the molecular fingerprint region from 1500–650 cm−1 (Fig. 2). Furthermore, two important sub-topics in the field are also investigated: the classification of black or dark-colored plastics and HDPE/LDPE differentiation.
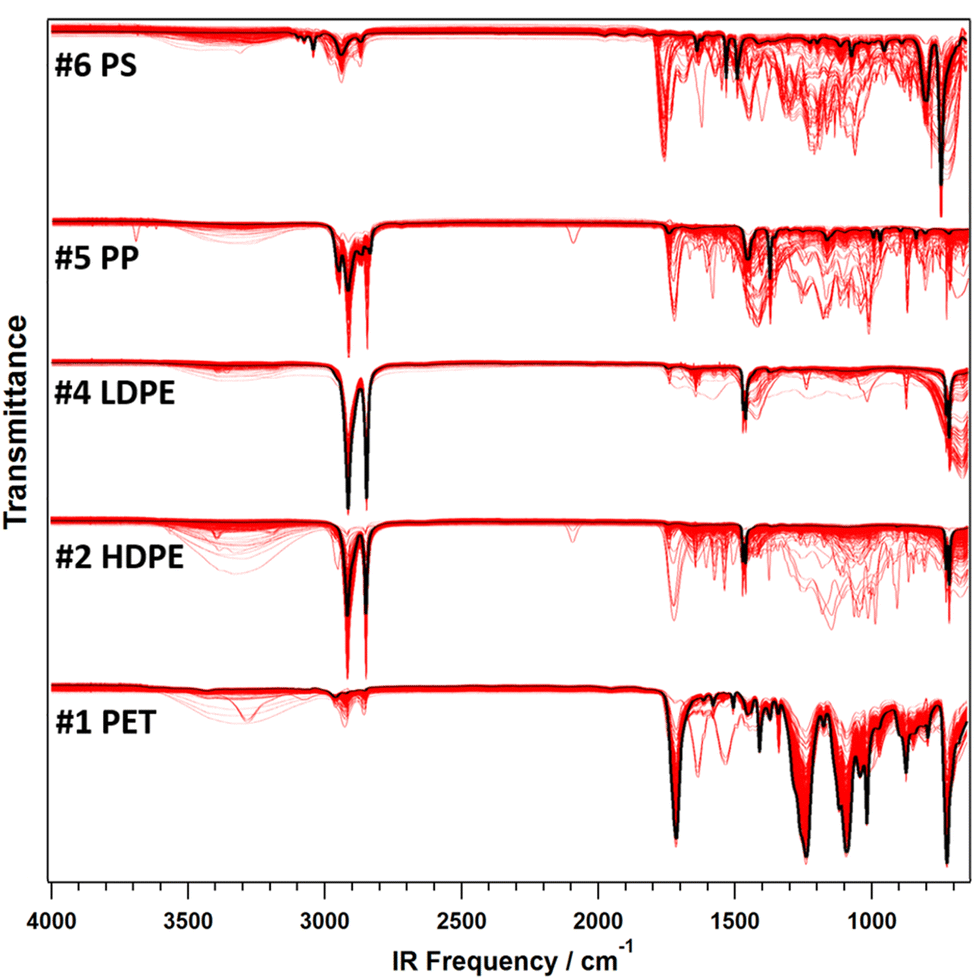 | ||
| Fig. 2 Mid-infrared (4000–650 cm−1) spectra of 835 postconsumer plastics that were evaluated in this study (red). Virgin polymer (black). Spectra are shown in percent transmittance (y-axis minimum is 30% per RIC). | ||
Pre-processing using autoencoders significantly improved classification, as model accuracies of 100%, 96.6%, 96.4%, and 94.9% were achieved for the RF, SVM, KNN, and LR classifiers, respectively (see the ESI† for accuracies obtained without pre-processing). The RF model produced the highest accuracies across all algorithms and MIR regions-of-interest or ROI (Table 1). The entire MIR, C–H stretching region, and fingerprint regions achieved 100%, 100%, and 99.9% prediction accuracies, respectively, for the RF model. To improve the accuracy of the RF model, hyperparameters were tuned to optimize the model's performance.63 Specifically, the number of estimators, which is the number of trees in a given forest, was set to a value of 100. Gini criterion was used to measure the quality of split. Other parameters, such as maximum depth of the tree, was set to none and the minimum number of samples required to split an internal node was fixed to a value of 2. RF uses a combination of multiple decision trees which results in less over-fitting. Furthermore, since the dataset is of sufficient size for classification (Fig. 1), the overall accuracy of the algorithm increases.
| Algorithm | Full mid-infrared (4000–650 cm−1) | C–H stretching (2990–2820 cm−1) | Fingerprint (1500–650 cm−1) | |||
|---|---|---|---|---|---|---|
| Accuracy (%) | τ (ms) | Accuracy (%) | τ (ms) | Accuracy (%) | τ (ms) | |
| RF | 100 | 46.9 | 100 | 39.9 | 99.9 | 47.5 |
| KNN | 97.8 | 831 | 95.1 | 303 | 88.6 | 349 |
| SVM | 96.5 | 0.0540 | 83.8 | 0.0350 | 80.9 | 0.0330 |
| LR | 95.4 | 96.7 | 89.9 | 2.42 | 78.2 | 6.96 |
Prediction times for individual spectra are presented in Table 1. The SVM model performed the fastest for the entire MIR, C–H stretching, and fingerprint regions, with values of 54, 35, and 33 microseconds, respectively. Interestingly, this finding was an improvement over MIR spectra that were spectrally manipulated using a baseline correction procedure, conversion to absorbance, and minimum/maximum normalization (ESI Table S1b†); for the processed spectra in the same ROI, SVM processing speeds were 58, 50, and 57 microseconds, respectively.
Single spectrum prediction time is a metric that may provide a link between controlled laboratory experiments, such as ATR-FTIR spectroscopy, and real-world MRF sorting systems. This is because the algorithm fundamentals can be quantified in context with the same vibrational modes that will be observed in future standoff detection sensors. Understanding the performance of these algorithms will accelerate research progress in recycling industries, as model selection, MIR frequency window, and computational hardware will need to be factored into the engineering of standoff detection devices. Quantum cascade lasers are an attractive lasing technology towards this approach because of their portability and spectral tunability from ∼3–25 micrometers.64,65 Due to the nanometer-scale engineering of the device's electronic wavefunctions, desired lasing properties can be achieved and applied to polymer identification sensors.18,66,67
Greater than a 78% prediction accuracy was achieved across all standard ML models (RF, KNN, SVM, and LR). These classifiers alone were sufficient for PCPW classification of this study's database (ESI Fig. S4–S6†). However, the spectral distortions and unidentified peaks originating from polymer additives in the fingerprint region are likely being captured in ML training (i.e., the classifiers are sorting unknown PCPW spectra by not only their base polymer composition but also by the additives found within the different RIC classes). The heterogeneity of the composition of PCPW is presented in Fig. 2. Numerous unidentified MIR bands appear from 4000–650 cm−1, but the most predominant unidentified features were found within the molecular fingerprint region from 1500–650 cm−1 (Fig. 2).
The molecular fingerprint region was particularly sensitive to vibrational responses from additives such as organic pigment molecules or calcium carbonate.68,69 The presence of unknown functional groups embedded within a polymeric matrix can alter the intrinsic oscillator strength of a given polymer's vibrational modes; thus, affecting ML classification accuracies. Furthermore, surface contamination, such as water, which has bending O–H modes at 850–600 cm−1, can further impact PCPW classification at MRFs.
This is a critical finding in the mechanical recycling community because previously reported MIR databases are comprised of clean polymer resins or environmentally-modified microplastics, both of which are not optimal for guiding the development of automated MRF sorting technologies. While this frequency region is, indeed, home to many characteristic polymer vibrational modes, the task of sorting economically-important RIC plastics becomes more challenging when PCPW is also composed of unknown breakdown products, contaminants, harmful chemicals, and other non-intentionally added substances.70 This study shows that PCPW MIR bands can become significantly influenced by additives and other contaminants. It is anticipated that more advanced ML methods that are uniquely constructed for identification of additives may not only assist with mechanical sorting, but also help improve toxicity assessments and enhance the downstream recovery process of valued materials by maximizing scientific feedback (e.g., polymer resin, additive, blend composition, hazardous contaminant, etc.) per AI-assisted spectral acquisition.
Fig. 3 presents the confusion matrices for all three ROIs. Expectedly, the full MIR performed the best, as it provides the maximum amount of vibrational information for each archived material. Unfortunately, no single-mode MIR sensor is capable of achieving such a broad spectral coverage to date. For this reason, the evaluation of discrete ROIs would give a better gauge for MIR frequency regions that are best-suited for PCPW mechanical sorting.
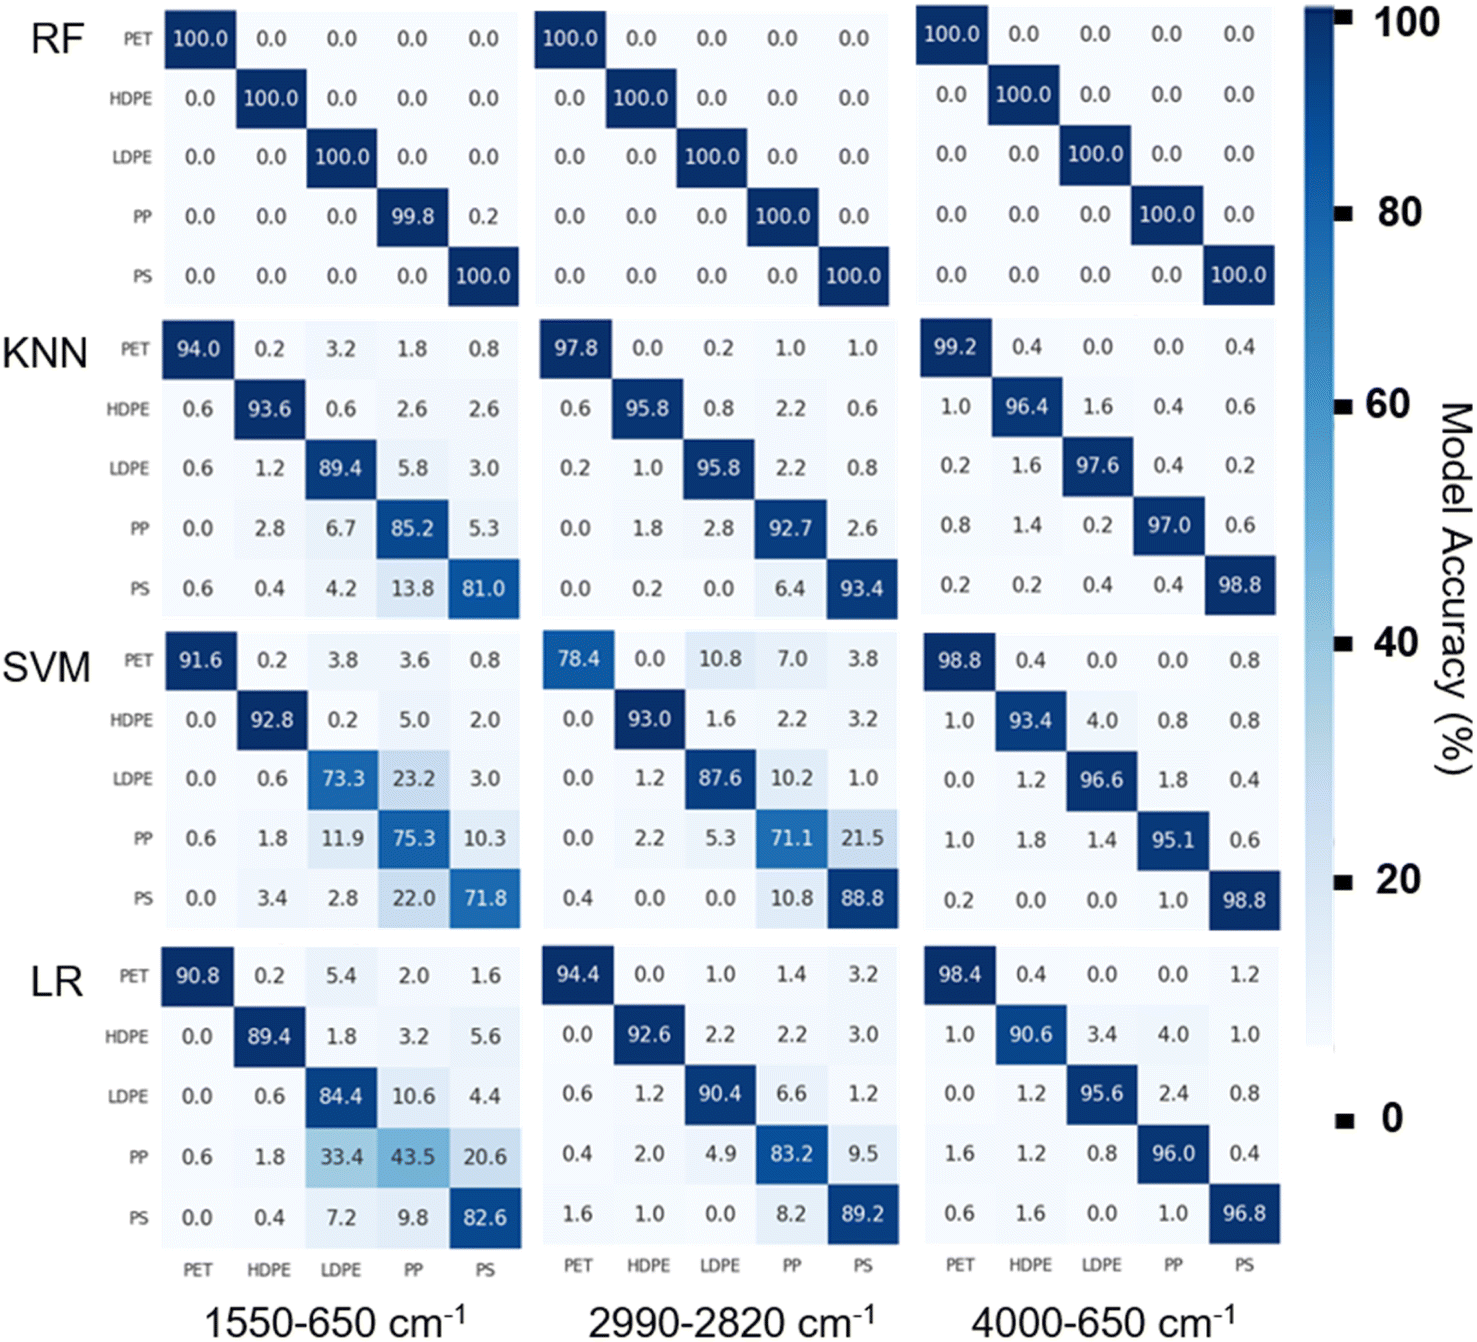 | ||
| Fig. 3 Confusion matrices of ML models applied across five plastic types and the mid-infrared regions-of-interest (Fig. 2). True and predicted label accuracies are highlighted in blue along the diagonal of each confusion matrix. Trained data were processed using the methods in 2.3. | ||
The C–H asymmetric and symmetric vibrations around 2990–2820 cm−1 were largely free from polymer additives and other unknown substances (Fig. 2). This can be due to the fact that C–H stretching modes from the polymer in this region have a high molar absorptivity, considering the Beer–Lambert law for an ATR-FTIR measurement, the polymer's volumetric concentration at a particular energy should be much greater than that of any embedded additive substance. This important finding is fundamentally relevant for future PCPW sorting developments, as this ROI will be most characteristic of the base polymer structure. Furthermore, by limiting the ROI to a maximum frequency of 2990 cm−1, interference from water's O–H stretching modes can also be avoided as water is common in MRF environments. A thorough study by Gall et al. suggests bands beyond 3000 cm−1 may originate from the polyamide (PA) N–H stretches of slip agents located at sample surfaces, as well as unknown contaminants, hydroxyl groups, and hydrogen bonding interactions.71 The intense vibration at ∼1640 cm−1 was prominent across all RIC datasets in this study except for LDPE, and may also correspond to carbonyl stretching of PA variants. Deconvoluting MIR spectra that are saturated with signals from unknown additives could be advanced via ML. However, new databases containing different classes of additives (e.g., organic pigments/dyes, plasticizers, flame retardants, fillers, etc.) will be crucially needed. Careful examination of the MIR spectra of PCPW, polymer additives, and the structure–property relationships found between them may help alleviate recycling bottlenecks that are encountered not only at MRFs but in chemical recycling industries as well.
3.2. HDPE and LDPE
Classification of semicrystalline polyethylene (PE) waste has been a long-standing problem for optical screening devices, as proof-of-principle reports have evaluated HDPE and LDPE separate from the other RIC polymers,72 as blended mixtures,73 or broadly defined under a single class label, PE.37,46,48 To the best of the author's knowledge, there are no ML studies of PCPW MIR spectra of HDPE and LDPE. This is significant because both density variants comprise two major resin code plastics (#2 and #4), yet the majority of recyclables found beneath those labels can vary in their shape and size. Classification of these materials would help improve the purity of recovered polyolefins and circularity of mixed PCPW.From rigid milk cartons to film plastics, the versatility of PE as a consumer plastic can be traced back to mechanical properties such as degree of crystallinity.74,75 Indeed, the vibrational properties of PE is well understood and, consequently, the MIR spectra of HDPE and LDPE are nearly-identical.76,77 However, the differentiation between PE PCPW, especially those that are unable to be classified using NIR sensors, remains unexplored due to the lack of published MIR databases reflecting heterogeneity of real-world materials.
Subtle differences between HDPE and LDPE are observable in the MIR region, such as the 1377 cm−1 symmetrical methyl deformation corresponding to the degree of polymer chain branching.78 A report by Jung et al. investigated this feature in marine microplastics, but deemed that is was insufficient for classification of environmentally-modified samples (e.g., aged plastics).9Fig. 4 shows how the conformational defect region corresponding to methylene “wagging” modes is susceptible to interference from additives, further rendering the 1377 cm−1 peak unviable for PE discernment unless more elaborate classification techniques are applied. This observation suggests polymer additives found in PCPW can be significant enough to mask spectral features that would otherwise be used to characterize virgin forms of the polymer, further highlighting the need for open-access spectral datasets. The semicrystalline bands at 3000–2800 cm−1, 1500–1450 cm−1, and 750–700 cm−1 can reflect the cooling processes at manufacturing facilities. These ROIs were found to be less hindered by additives (Fig. 4). These peaks appear as doublets in ATR-FTIR spectra due to the lateral vibrations within crystalline PE's orthorhombic unit cell.74
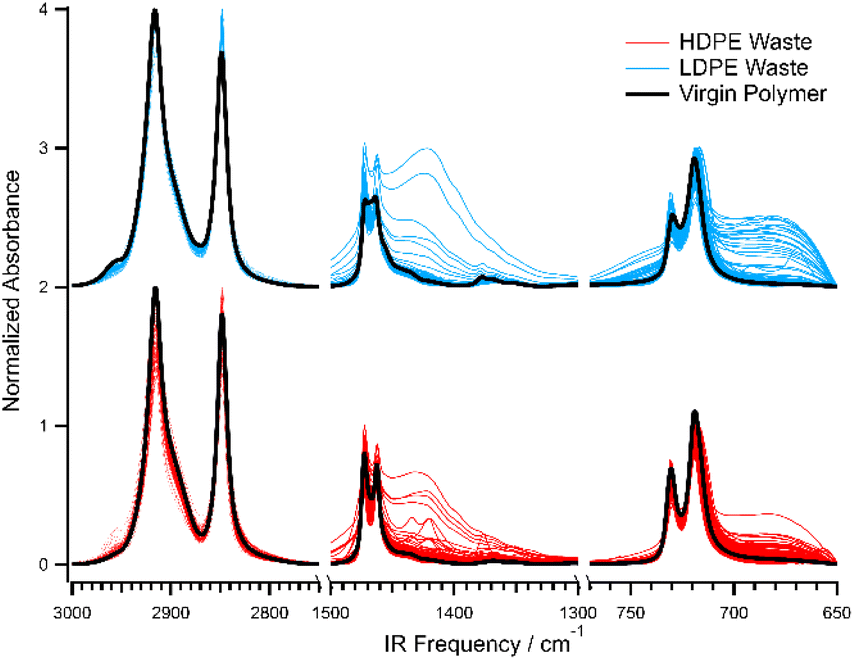 | ||
| Fig. 4 Semicrystalline regions of HDPE (red) and LDPE (blue) waste plastics. Reference HDPE and LDPE spectrum (black). | ||
ML autoencoders were applied to the semicrystalline C–H stretching modes of HDPE and LDPE (ESI Table S1e†). Classification accuracies of 100%, 97.6%, 96.5%, and 96.9% were received for the RF, KNN, SVM, and LR models, respectively. The SVM model achieved the fastest prediction of 39 microseconds for the C–H stretching ROI. A methyl asymmetric stretch at ∼2956 cm−1 is an indicator of the less-crystalline LDPE PCPW, as this corresponds to greater methyl branching among the PE chains (Fig. 4). This mode likely contributed to the classification performance of HDPE and LDPE in this region.
The fingerprint ROI, which was most inaccurate for PCPW classification, performed well for HDPE and LDPE alone (ESI Table S1e†). Confusion matrices suggested greater than 94% classification accuracy for the ROIs and ML classifiers (ESI Fig. S7†). This result may be misleading, however, since the additives found within the fingerprint ROI had distinctly-different spectral features (Fig. 2). These features may have factored into the ML training and testing process.
First, broad peaks at 1427 cm−1 and 677 cm−1 along the lower-frequency shoulders of the semi-crystalline methylene bends were observable for HDPE and LDPE film plastics (Fig. 4). This observation has not been observed among other MIR studies of postconsumer PE plastic polymers. A sharp peak located at 875 cm−1 corresponding to the C–O asymmetric bend was also present, suggesting the 1427 cm−1 and 875 cm−1 modes correspond to the additive, calcite (CaCO3).79 Calcite can potentially lead to misclassification between PE and polyvinyl chloride (PVC) depending on the MIR ROI. Future work is needed to understand specific the origins of specific additive vibrations, such as the mode at 677 cm−1. Rijavec et al. recently provided a valuable ML study focused on ML classification of PVC materials.40
Second, contamination with PP led to misclassification in both the C–H stretching and fingerprint ROIs (Fig. 3). The SVM and LR models performed the poorest of the selected algorithms. PP spectra within the C–H stretching ROI show strong vibrational bands at 2917 cm−1 and 2849 cm−1 of varying intensity ratios (Fig. 2). The presence of these methylene asymmetric and symmetric stretches suggests that PCPW are blended mixtures comprised of both PE and PP. Achieving a greater understanding of polymer-based cross-contamination at MRFs, as well as in surrounding environments, will help enable more material to be successfully recycled and re-enter new economic streams.71,80,81
These findings support the need to further evaluate and quantify the chemical and physical structures of recyclable polymers. Other properties, such as thermal, electrical, mechanical, or optical, may be leveraged, in this regard, depending on the spectroscopic technique.60,82 Classification of discrete ROIs using ML is a fruitful direction to explore in this field, especially when considering the impact these scientific returns may have when applied to chemical recycling technologies.
3.3. Black and dark-colored plastics
ML algorithms trained using MIR spectra of black and dark-colored plastics achieved high prediction accuracies, a result that has proven challenging for current optical screening devices at MRFs (Table 1 and ESI Table S1†). In this study, 8.3% of PCPW were considered as black or dark-colored, with the total percentage of all colorant-containing materials to be 19%. While the MIR region enables the characterization of dark and black plastics, the presence of additives such as colorants and UV-protecting agents were still found to influence prediction accuracies. Specifically, carbon black has been shown by Sigornet et al. to increase the fingerprint ROI's spectral baseline, which can distort lineshapes.83Fig. 5 shows an increase in absorbance units from 0.1 to 0.35 for an uncolored PP sample and multiple black-colored PP samples, respectively. This result validates the prediction of Sigornet et al., suggesting black plastics can impact ML accuracies of MIR spectral datasets.83 Similar baseline increases were also observed for other dark-colored materials found in this study's database. These materials likely had high concentrations of organic pigment molecules, but further additive-specific studies are needed to understand their role in presenting complexities to the automated sorting process of mixed wastestreams. These findings were further validated using this study's RF model, as substantial misclassification (∼12%) was observed between dark- and light-colored plastics (Fig. S9 in the ESI†). Future MIR PCPW sensors should carefully consider the frequency range of their equipment, as well as the predominant materials that may flow through a given MRF sorting line. For example, if the materials are mostly waste electronic plastics, electrical conductivity components, or mechanical coverings, carbon black concentrations are likely to be greater.83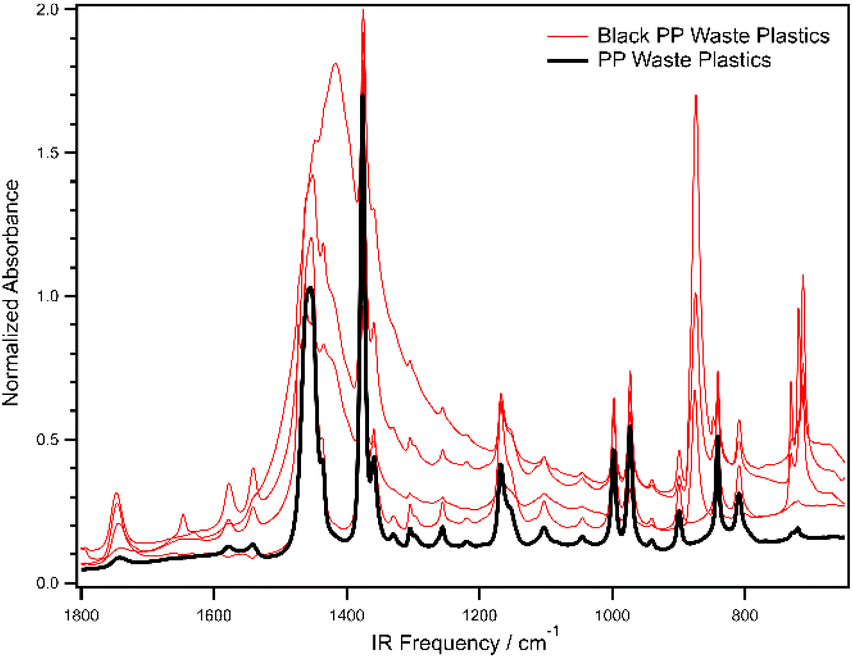 | ||
| Fig. 5 Polypropylene waste plastic with zero carbon black content (black). Black-colored polypropylene waste plastics (red). Spectra were normalized to the 2916 cm−1 asymmetric methylene stretch. | ||
While this study provides the first glimpse of an extensive PCPW MIR database, it should be noted that practical MIR sorting systems may receive spectra that appear different from those that are found in literature, other online databases, or are acquired in controlled-laboratory settings. In these cases, the underlying fundamentals for spectra (e.g., selection rules, peak location, lineshapes, etc.) of standoff detection systems should be included with future reports to better expedite innovation in the mechanical sorting sector. Furthermore, cross-validation of processed and unprocessed datasets, in which spectral manipulations produce varying ML results, should also be conducted (see ESI† for ML results of different spectral processing methods that were applied in this study).
4 Conclusions
A spectral database comprised of 835 real-world plastics (2505 spectra) and five RIC polymers (PET #1, HDPE #2, LDPE #4, PP #5, PS #6) was classified using autoencoder pre-processed machine learning algorithms. The fundamental vibrational modes characteristic of mixed plastic waste that would be found at materials recovery facilities were revealed and classified for the first time. Quantifiable metrics including classification accuracy and prediction time provide a baseline for other researchers in the field to develop custom algorithms and standoff detection systems. The RF model achieved the highest accuracy across all four standard classifiers, while the SVM model achieved the fastest per spectrum prediction time. Discrete MIR frequency ranges were assessed for the purpose of identifying regions that are most characteristic of each resin code plastic, as much of the MIR was found to be convoluted with signals originating from unknown polymer additives and contaminants. The C–H stretching region proved to be a promising MIR frequency range for future studies due to its (1) freedom from additives, (2) high classification accuracies, and (3) fast prediction times. Other topics of interest to the community were also investigated, including the classification of black plastics using MIR wavelengths and the differentiation of HDPE and LDPE. The authors aim for this work to help accelerate innovation in recycling industries and, ultimately, mitigate the negative impacts originating from the plastic waste crisis.Author contributions
Conceptualization, data curation, methodology, and project administration: KD and LV. Planning and supervision: KD and LV. Data acquisition, validation, visualization, and writing of original draft: NS and VM. Data analysis, review and editing: NS, VM, ST, KD, and LV.Conflicts of interest
There are no conflicts to declare.Acknowledgements
This work was funded by the National Science Foundation (NSF-EFRI E3P) award 2029375 “Valorization of Plastic Waste via Advanced Separation and Processing”. We acknowledge partial support from NSF CAREER grants CNS-1846320 (KD) and CHE-1753207 (LV). The authors thank Prof. Thomas Thundat and Yaoli Zhao for their fruitful discussions regarding standoff detection mid-infrared sensors. The authors would also like to thank the project research team at the University at Buffalo for their expertise and helpful conversations: Paschalis Alexandridis, Marina Tsianou, Amit Goyal, John Atkinson, Javid Rzayev, Michael Shelly, and Alan Rae. Lastly, the authors thank the University at Buffalo Undergraduate Chemistry Club for their support in the collecting of postconsumer plastics.References
- Plastics: Material-specific Data, https://www.epa.gov/facts-and-figures-about-materials-waste-and-recycling/plastics-material-specific-data, (accessed April 27, 2022) Search PubMed.
- S. Sridharan, M. Kumar, L. Singh, N. S. Bolan and M. Saha, Microplastics as an emerging source of particulate air pollution: A critical review, J. Hazard. Mater., 2021, 418, 126245 CrossRef CAS PubMed.
- P. Stegmann, V. Daioglou, M. Londo, D. P. van Vuuren and M. Junginger, Plastic futures and their CO2 emissions, Nature, 2022, 612, 272–276 CrossRef CAS PubMed.
- S. Noventa, M. S. P. Boyles, A. Seifert, S. Belluco, A. S. Jiménez, H. J. Johnston, L. Tran, T. F. Fernandes, L. Mughini-Gras, M. Orsini, F. Corami, K. Castro, F. Mutinelli, M. Boldrin, V. Puntes, M. Sotoudeh, G. Mascarello, B. Tiozzo, P. McLean, F. Ronchi, A. M. Booth, A. A. Koelmans and C. Losasso, Paradigms to assess the human health risks of nano- and microplastics, Microplast. nanoplast., 2021, 1, 9 CrossRef.
- E. R. Zettler, T. J. Mincer and L. A. Amaral-Zettler, Life in the “Plastisphere”: Microbial Communities on Plastic Marine Debris, Environ. Sci. Technol., 2013, 47, 7137–7146 CrossRef CAS.
- C. Fernández-Ojeda, M. C. Muniz, R. P. Cardoso, R. M. dos Anjos, E. Huaringa, C. Nakazaki, A. Henostroza and O. Garcés-Ordóñez, Plastic debris and natural food in two commercially important fish species from the coast of Peru, Mar. Pollut. Bull., 2021, 173, 113039 CrossRef PubMed.
- S. J. Barnes, Understanding plastics pollution: The role of economic development and technological research, Environ. Pollut., 2019, 249, 812–821 CrossRef CAS PubMed.
- J. M. Gove, J. L. Whitney, M. A. McManus, J. Lecky, F. C. Carvalho, J. M. Lynch, J. Li, P. Neubauer, K. A. Smith, J. E. Phipps, D. R. Kobayashi, K. B. Balagso, E. A. Contreras, M. E. Manuel, M. A. Merrifield, J. J. Polovina, G. P. Asner, J. A. Maynard and G. J. Williams, Prey-size plastics are invading larval fish nurseries, Proc. Natl. Acad. Sci. U. S. A., 2019, 116, 24143–24149 CrossRef CAS.
- M. R. Jung, F. D. Horgen, S. V. Orski, V. Rodriguez C, K. L. Beers, G. H. Balazs, T. T. Jones, T. M. Work, K. C. Brignac, S.-J. Royer, K. D. Hyrenbach, B. A. Jensen and J. M. Lynch, Validation of ATR FT-IR to identify polymers of plastic marine debris, including those ingested by marine organisms, Mar. Pollut. Bull., 2018, 127, 704–716 CrossRef CAS PubMed.
- M. L. Moser and D. S. Lee, A Fourteen-Year Survey of Plastic Ingestion by Western North Atlantic Seabirds, Col. Waterbirds, 1992, 15, 83–94 CrossRef.
- J. Tomás, R. Guitart, R. Mateo and J. A. Raga, Marine debris ingestion in loggerhead sea turtles, Caretta caretta, from the Western Mediterranean, Mar. Pollut. Bull., 2002, 44, 211–216 CrossRef.
- R. Geyer, J. R. Jambeck and K. L. Law, Production, use, and fate of all plastics ever made, Sci. Adv., 2017, 3, e1700782 CrossRef.
- M. MacLeod, H. P. H. Arp, M. B. Tekman and A. Jahnke, The global threat from plastic pollution, Science, 2021, 373, 61–65 CrossRef CAS.
- J. Demarteau, A. R. Epstein, P. R. Christensen, M. Abubekerov, H. Wang, S. J. Teat, T. J. Seguin, C. W. Chan, C. D. Scown, T. P. Russell, J. D. Keasling, K. A. Persson and B. A. Helms, Circularity in mixed-plastic chemical recycling enabled by variable rates of polydiketoenamine hydrolysis, Sci. Adv., 2022, 8, eabp8823 CrossRef CAS PubMed.
- E. Erickson, J. E. Gado, L. Avilán, F. Bratti, R. K. Brizendine, P. A. Cox, R. Gill, R. Graham, D.-J. Kim, G. König, W. E. Michener, S. Poudel, K. J. Ramirez, T. J. Shakespeare, M. Zahn, E. S. Boyd, C. M. Payne, J. L. DuBois, A. R. Pickford, G. T. Beckham and J. E. McGeehan, Sourcing thermotolerant poly(ethylene terephthalate) hydrolase scaffolds from natural diversity, Nat. Commun., 2022, 13, 7850 CrossRef CAS.
- D. E. Fagnani, D. Kim, S. I. Camarero, J. F. Alfaro and A. J. McNeil, Using waste poly(vinyl chloride) to synthesize chloroarenes by plasticizer-mediated electro(de)chlorination, Nat. Chem., 2023, 15, 222–229 CrossRef CAS PubMed.
- K. Lan and Y. Yao, Feasibility of gasifying mixed plastic waste for hydrogen production and carbon capture and storage, Commun. Earth Environ., 2022, 3, 300 CrossRef.
- A. P. M. Michel, A. E. Morrison, B. C. Colson, W. A. Pardis, X. A. Moya, C. C. Harb and H. K. White, Quantum cascade laser-based reflectance spectroscopy: a robust approach for the classification of plastic type, Opt. Express, 2020, 28, 17741–17756 CrossRef PubMed.
- A. d. C. Munguía-López, D. Göreke, K. L. Sánchez-Rivera, H. A. Aguirre-Villegas, S. Avraamidou, G. W. Huber and V. M. Zavala, Quantifying the environmental benefits of a solvent-based separation process for multilayer plastic films, Green Chem., 2023, 25, 1611–1625 RSC.
- N. Vora, P. R. Christensen, J. Demarteau, N. R. Baral, J. D. Keasling, B. A. Helms and C. D. Scown, Leveling the cost and carbon footprint of circular polymers that are chemically recycled to monomer, Sci. Adv., 2021, 7, eabf0187 CrossRef CAS PubMed.
- J. Woidasky, I. Sander, A. Schau, J. Moesslein, P. Wendler, D. Wacker, G. Gao, D. Kirchenbauer, V. Kumar, D. Busko, I. A. Howard, B. S. Richards, A. Turshatov, S. Wiethoff and C. Lang-Koetz, Inorganic fluorescent marker materials for identification of post-consumer plastic packaging, Resour., Conserv. Recycl., 2020, 161, 104976 CrossRef.
- S. Zhong, K. Zhang, M. Bagheri, J. G. Burken, A. Gu, B. Li, X. Ma, B. L. Marrone, Z. J. Ren, J. Schrier, W. Shi, H. Tan, T. Wang, X. Wang, B. M. Wong, X. Xiao, X. Yu, J.-J. Zhu and H. Zhang, Machine Learning: New Ideas and Tools in Environmental Science and Engineering, Environ. Sci. Technol., 2021, 55, 12741–12754 CAS.
- C. Lubongo, T. Congdon, J. McWhinnie and P. Alexandridis, Economic feasibility of plastic waste conversion to fuel using pyrolysis, Sustainable Chem. Pharm., 2022, 27, 100683 CrossRef CAS.
- I. Marica, M. Aluaş and S. Cîntă Pînzaru, Raman technology application for plastic waste management aligned with FAIR principle to support the forthcoming plastic and environment initiatives, Waste Manage., 2022, 144, 479–489 CrossRef PubMed.
- J. Meert, A. Izzo and J. D. Atkinson, Impact of plastic bag bans on retail return polyethylene film recycling contamination rates and speciation, Waste Manage., 2021, 135, 234–242 CrossRef CAS PubMed.
- T. Sormunen, S. Uusitalo, H. Lindström, K. Immonen, J. Mannila, J. Paaso and S. Järvinen, Towards recycling of challenging waste fractions: Identifying flame retardants in plastics with optical spectroscopic techniques, Waste Manage. Res., 2022, 40, 1546–1554 CrossRef CAS.
- A. Vedantam, N. C. Suresh, K. Ajmal and M. Shelly, Impact of China's National Sword Policy on the U.S. Landfill and Plastics Recycling Industry, Sustainability, 2022, 14, 2456 CrossRef.
- U. K. Adarsh, V. B. Kartha, C. Santhosh and V. K. Unnikrishnan, Spectroscopy: A promising tool for plastic waste management, TrAC, Trends Anal. Chem., 2022, 149, 116534 CrossRef CAS.
- Y. Zhao and J. Li, Sensor-Based Technologies in Effective Solid Waste Sorting: Successful Applications, Sensor Combination, and Future Directions, Environ. Sci. Technol., 2022, 56, 17531–17544 CrossRef CAS.
- S. B. Borrelle, J. Ringma, K. L. Law, C. C. Monnahan, L. Lebreton, A. McGivern, E. Murphy, J. Jambeck, G. H. Leonard, M. A. Hilleary, M. Eriksen, H. P. Possingham, H. De Frond, L. R. Gerber, B. Polidoro, A. Tahir, M. Bernard, N. Mallos, M. Barnes and C. M. Rochman, Predicted growth in plastic waste exceeds efforts to mitigate plastic pollution, Science, 2020, 369, 1515–1518 CrossRef CAS PubMed.
- C. Lubongo and P. Alexandridis, Assessment of Performance and Challenges in Use of Commercial Automated Sorting Technology for Plastic Waste, Recycling, 2022, 7, 11 CrossRef.
- J. Bobulski and M. Kubanek, Deep Learning for Plastic Waste Classification System, Appl. Comput. Intell. Soft Comput., 2021, 2021, 6626948 Search PubMed.
- J. Bobulski and M. Kubanek, Robot for plastic garbage recognition, Int. J. Electr. Comput. Eng., 2022, 12, 2425 Search PubMed.
- J. Bobulski and J. Piatkowski, PET waste classification method and plastic waste DataBase-WaDaBa, in Image Processing and Communications Challenges 9: 9th International Conference, IP&C’2017 Bydgoszcz, Poland, September 2017, Proceedings, Springer International Publishing, 2018, pp. 57–64 Search PubMed.
- B. Carrera, V. L. Piñol, J. B. Mata and K. Kim, A machine learning based classification models for plastic recycling using different wavelength range spectrums, J. Cleaner Prod., 2022, 374, 133883 CrossRef.
- N. Kroell, X. Chen, K. Greiff and A. Feil, Optical sensors and machine learning algorithms in sensor-based material flow characterization for mechanical recycling processes: A systematic literature review, Waste Manage., 2022, 149, 259–290 CrossRef PubMed.
- B. Lotter, S. Konde, J. Nguyen, M. Grau, M. Koch and P. Lenz, Identifying plastics with photoluminescence spectroscopy and machine learning, Sci. Rep., 2022, 12, 18840 CrossRef CAS PubMed.
- W. Lu and J. Chen, Computer vision for solid waste sorting: A critical review of academic research, Waste Manage., 2022, 142, 29–43 CrossRef PubMed.
- E. R. K. Neo, Z. Yeo, J. S. C. Low, V. Goodship and K. Debattista, A review on chemometric techniques with infrared, Raman and laser-induced breakdown spectroscopy for sorting plastic waste in the recycling industry, Resour., Conserv. Recycl., 2022, 180, 106217 CrossRef CAS.
- T. Rijavec, D. Ribar, J. Markelj, M. Strlič and I. Kralj Cigić, Machine learning-assisted non-destructive plasticizer identification and quantification in historical PVC objects based on IR spectroscopy, Sci. Rep., 2022, 12, 5017 CrossRef CAS PubMed.
- C. A. Meza Ramirez, M. Greenop, L. Ashton and I. u. Rehman, Applications of machine learning in spectroscopy, Appl. Spectrosc. Rev., 2021, 56, 733–763 CrossRef.
- X. Chen, N. Kroell, M. Althaus, T. Pretz, R. Pomberger and K. Greiff, Enabling mechanical recycling of plastic bottles with shrink sleeves through near-infrared spectroscopy and machine learning algorithms, Resour., Conserv. Recycl., 2023, 188, 106719 CrossRef.
- L. Jacquin, A. Imoussaten, F. Trousset, D. Perrin and J. Montmain, Control of waste fragment sorting process based on MIR imaging coupled with cautious classification, Resour., Conserv. Recycl., 2021, 168, 105258 CrossRef.
- T. Ji, H. Fang, R. Zhang, J. Yang, L. Fan, Y. Hu and Z. Cai, Low-value recyclable waste identification based on NIR feature analysis and RGB-NIR fusion, Infrared Phys. Technol., 2023, 131, 104693 CrossRef CAS.
- I. Marica and S. C. Pînzaru, A Raman spectral database of naturally aged plastics: a proof-of-concept study for waste plastic sorting, J. Raman Spectrosc., 2023, 54, 305–313 CrossRef CAS.
- S. Jiang, Z. Xu, M. Kamran, S. Zinchik, S. Paheding, A. G. McDonald, E. Bar-Ziv and V. M. Zavala, Using ATR-FTIR spectra and convolutional neural networks for characterizing mixed plastic waste, Comput. Chem. Eng., 2021, 155, 107547 CrossRef CAS.
- F. Long, S. Jiang, A. G. Adekunle, V. M Zavala and E. Bar-Ziv, Online Characterization of Mixed Plastic Waste Using Machine Learning and Mid-Infrared Spectroscopy, ACS Sustainable Chem. Eng., 2022, 10, 16064–16069 CrossRef CAS.
- S. Zinchik, S. Jiang, S. Friis, F. Long, L. Høgstedt, V. M. Zavala and E. Bar-Ziv, Accurate Characterization of Mixed Plastic Waste Using Machine Learning and Fast Infrared Spectroscopy, ACS Sustainable Chem. Eng., 2021, 9, 14143–14151 CrossRef CAS.
- W. Becker, K. Sachsenheimer and M. Klemenz, Detection of Black Plastics in the Middle Infrared Spectrum (MIR) Using Photon Up-Conversion Technique for Polymer Recycling Purposes, Polymers, 2017, 9, 435 CrossRef.
- H. Masoumi, S. M. Safavi and Z. Khani, Identification and classification of plastic resins using near infrared reflectance spectroscopy, Int. J. Mech. Ind. Eng., 2012, 6, 213–220 Search PubMed.
- S. Serranti, A. Gargiulo and G. Bonifazi, Classification of polyolefins from building and construction waste using NIR hyperspectral imaging system, Resour., Conserv. Recycl., 2012, 61, 52–58 CrossRef.
- A. Vázquez-Guardado, M. Money, N. McKinney and D. Chanda, Multi-spectral infrared spectroscopy for robust plastic identification, Appl. Opt., 2015, 54, 7396–7405 CrossRef.
- S. Zhu, H. Chen, M. Wang, X. Guo, Y. Lei and G. Jin, Plastic solid waste identification system based on near infrared spectroscopy in combination with support vector machine, Adv. Ind. Eng. Polym. Res., 2019, 2, 77–81 Search PubMed.
- E. Mjolsness and D. DeCoste, Machine Learning for Science: State of the Art and Future Prospects, Science, 2001, 293, 2051–2055 CrossRef CAS PubMed.
- M. Toğaçar, B. Ergen and Z. Cömert, Waste classification using AutoEncoder network with integrated feature selection method in convolutional neural network models, Measurement, 2020, 153, 107459 CrossRef.
- A. A. Enders, N. M. North, C. M. Fensore, J. Velez-Alvarez and H. C. Allen, Functional Group Identification for FTIR Spectra Using Image-Based Machine Learning Models, Anal. Chem., 2021, 93, 9711–9718 CrossRef CAS PubMed.
- A. Angulo, L. Yang, E. S. Aydil and M. A. Modestino, Machine learning enhanced spectroscopic analysis: towards autonomous chemical mixture characterization for rapid process optimization, Digit. Discov., 2022, 1, 35–44 RSC.
- B. K. Chabuka and J. H. Kalivas, Application of a Hybrid Fusion Classification Process for Identification of Microplastics Based on Fourier Transform Infrared Spectroscopy, Appl. Spectrosc., 2020, 74, 1167–1183 CrossRef CAS PubMed.
- S. Primpke, M. Wirth, C. Lorenz and G. Gerdts, Reference database design for the automated analysis of microplastic samples based on Fourier transform infrared (FTIR) spectroscopy, Anal. Bioanal. Chem., 2018, 410, 5131–5141 CrossRef CAS PubMed.
- N. Andraju, G. W. Curtzwiler, Y. Ji, E. Kozliak and P. Ranganathan, Machine-Learning-Based Predictions of Polymer and Postconsumer Recycled Polymer Properties: A Comprehensive Review, ACS Appl. Mater. Interfaces, 2022, 14, 42771–42790 CrossRef CAS PubMed.
- L. Dai, R. Ruan, S. You and H. Lei, Paths to sustainable plastic waste recycling, Science, 2022, 377, 934 CrossRef CAS PubMed.
- G. E. Hinton and R. R. Salakhutdinov, Reducing the Dimensionality of Data with Neural Networks, Science, 2006, 313, 504–507 CrossRef CAS PubMed.
- I. Cortesi, A. Masiero, M. De Giglio, G. Tucci and M. Dubbini, Random forest-based river plastic detection with a handheld multispectral camera, Int. Arch. Photogramm. Remote Sens. Spat. Inf. Sci., 2021, XLIII-B1-2021, 9–14 CrossRef.
- J. Faist, F. Capasso, D. L. Sivco, C. Sirtori, A. L. Hutchinson and A. Y. Cho, Quantum Cascade Laser, Science, 1994, 264, 553–556 CrossRef CAS PubMed.
- M. S. Vitiello, G. Scalari, B. Williams and P. De Natale, Quantum cascade lasers: 20 years of challenges, Opt. Express, 2015, 23, 5167–5182 CrossRef CAS PubMed.
- X. Tian, F. Beén and P. S. Bäuerlein, Quantum cascade laser imaging (LDIR) and machine learning for the identification of environmentally exposed microplastics and polymers, Environ. Res., 2022, 212, 113569 CrossRef CAS PubMed.
- Y. Zhao, P. Chakraborty, N. Stavinski, L. Velarde, V. Maheshkar, K. Dantu, A. Phani, S. Kim and T. Thundat, Standoff and Point Detection of Thin Polymer Layers Using Microcantilever Photothermal Spectroscopy, J. Electrochem. Soc., 2022, 169, 037501 CrossRef CAS.
- D. O. Hummel, Atlast of Plastics Additives, Springer Berlin, Heidelberg, 1 edn, 2002 Search PubMed.
- H. Zweifel, R. D. Maier and M. Schiller, Plastics Additives Handbook, Hanser Publications, 2009 Search PubMed.
- H. Wiesinger, Z. Wang and S. Hellweg, Deep Dive into Plastic Monomers, Additives, and Processing Aids, Environ. Sci. Technol., 2021, 55, 9339–9351 CrossRef CAS PubMed.
- M. Gall, P. J. Freudenthaler, J. Fischer and R. W. Lang, Characterization of Composition and Structure–Property Relationships of Commercial Post-Consumer Polyethylene and Polypropylene Recyclates, Polymers, 2021, 13, 1574 CrossRef CAS.
- K. Zhou, S.-K. Oh, W. Pedrycz, J. Qiu, Z. Fu and B.-G. Ryu, Design of data feature-driven 1D/2D convolutional neural networks classifier for recycling black plastic wastes through laser spectroscopy, Adv. Eng. Inform., 2022, 53, 101695 CrossRef.
- D. J. da Silva and H. Wiebeck, ATR-FTIR Spectroscopy Combined with Chemometric Methods for the Classification of Polyethylene Residues Containing Different Contaminants, J. Polym. Environ., 2022, 30, 3031–3044 CrossRef CAS.
- H. Hagemann, R. G. Snyder, A. J. Peacock and L. Mandelkern, Quantitative infrared methods for the measurement of crystallinity and its temperature dependence: polyethylene, Macromolecules, 1989, 22, 3600–3606 CrossRef CAS.
- S. K. Mallapragada and B. Narasimhan, in Encyclopedia of Analytical Chemistry, pp. 1–16, DOI:10.1002/9780470027318.a2012.pub2.
- S. Krimm, Infrared spectra of high polymers, in Fortschritte Der Hochpolymeren-Forschung, Advances in Polymer Science, Springer, Berlin, Heidelberg, 1960, vol. 2/1, pp. 51–172, DOI:10.1007/BFb0050351.
- S. Krimm, C. Y. Liang and G. B. B. M. Sutherland, Infrared Spectra of High Polymers. II. Polyethylene, J. Chem. Phys., 2004, 25, 549–562 CrossRef.
- D. R. Rueda, F. J. B. Calleja and A. Hidalgo, Determination of the degree of branching in polyethylene by an i.r. method of decomposition of bands, Spectrochim. Acta, Part A, 1979, 35, 847–849 CrossRef.
- C. Signoret, A.-S. Caro-Bretelle, J.-M. Lopez-Cuesta, P. Ienny and D. Perrin, MIR spectral characterization of plastic to enable discrimination in an industrial recycling context: II. Specific case of polyolefins, Waste Manage., 2019, 98, 160–172 CrossRef CAS PubMed.
- E. Karaagac, M. P. Jones, T. Koch and V.-M. Archodoulaki, Polypropylene Contamination in Post-Consumer Polyolefin Waste: Characterisation, Consequences and Compatibilisation, Polymers, 2021, 13, 2618 CrossRef CAS PubMed.
- M. Kozicki, K. Guzik, H. Deptuła and J. Tomaszewska, Leaching and VOC Emission Tests of Polymer Composites Produced from Post-Consumer Waste in Terms of Application in the Construction Sector, Materials, 2021, 14, 3518 CrossRef CAS.
- M. Bredács, C. Barretta, L. F. Castillon, A. Frank, G. Oreski, G. Pinter and S. Gergely, Prediction of polyethylene density from FTIR and Raman spectroscopy using multivariate data analysis, Polym. Test., 2021, 104, 107406 CrossRef.
- C. Signoret, A.-S. Caro-Bretelle, J.-M. Lopez-Cuesta, P. Ienny and D. Perrin, Alterations of plastics spectra in MIR and the potential impacts on identification towards recycling, Resour., Conserv. Recycl., 2020, 161, 104980 CrossRef.
Footnotes |
| † Electronic supplementary information (ESI) available. See DOI: https://doi.org/10.1039/d3va00111c |
| ‡ These authors contributed equally. |
| This journal is © The Royal Society of Chemistry 2023 |