
 Open Access Article
 This Open Access Article is licensed under a
 Creative Commons Attribution 3.0 Unported Licence
Assessment of location and energy utility options for the implementation of pyrolytic biocrude production†
Abhijit
Dutta
 *,
Michael S.
Talmadge
,
Eric C. D.
Tan
and
Joshua A.
Schaidle
*,
Michael S.
Talmadge
,
Eric C. D.
Tan
and
Joshua A.
Schaidle
Catalytic Carbon Transformation & Scale-Up Center, National Renewable Energy Laboratory, Golden, CO, USA. E-mail: abhijit.dutta@nrel.gov
First published on 30th August 2023
Abstract
Efficient utilization of petroleum refining infrastructure for processing biocrudes can reduce biofuel production costs and overall greenhouse gas emissions. Here we use two conceptual designs, a simpler fast pyrolysis process and a more complex catalytic fast pyrolysis (CFP) process, to analyze the effective use of energy byproducts during biocrude production. Biocrude production may occur either closer to the biomass source or near the petroleum refinery; the choice of biorefinery location and its local infrastructure will dictate options for the utilization of energy byproducts. Our analysis, with its underlying assumptions, indicates that there are benefits of using hydrogen and raw energy utility byproducts (fuel gas and steam) from the process. With local consumption of these utilities, our best colocated CFP case has the potential for a ∼150% greenhouse gas reduction compared to a standalone plant; for the same colocated case (with the underlying assumptions which do not include a graded distance-based approach to feedstock volumes, costs, and emissions) there can be a cost reduction of ∼10%, even after offsetting feedstock transportation costs, if implemented at a 5× larger scale compared to a standalone facility. Implementation decisions should be carefully weighed using specific analysis for any facility, including feedstock availability at various distances from that location, with associated feedstock costs and emissions, as well as available infrastructure and incentives.
Introduction
Sustainable aviation fuels (SAF) and other biofuels can be an important tool towards the mitigation of greenhouse gas (GHG) impacts while maintaining the conveniences offered by fossil derived liquid fuels within the current transportation infrastructure. Direct liquefaction of biomass via thermal breakdown, such as fast pyrolysis (FP) involving the rapid heating of biomass, usually in the absence of oxygen, to approximately 500 °C can result in high yields of liquid upon condensation.1 This liquid biocrude, also known as pyrolysis-oil, can then be further processed into liquid transportation fuels. The quality of the biocrude from pyrolysis can be enhanced via catalytic upgrading prior to vapor condensation, during or immediately after fast pyrolysis, via a process known as catalytic fast pyrolysis (CFP).2,3 There is significant ongoing research to enable the upgrading of FP or CFP oils in petroleum refineries alongside fossil derived fuels.4,5 This approach offers the advantage of leveraging existing equipment and infrastructure at petroleum refineries to help save on capital investments. Some refinery operations in California are now being dedicated to renewable sources such as plant- and animal-based Fats/Oils/Greases (FOG).6 However, the supply of FOG and purpose-grown vegetable oils is limited. The use of biomass-derived FP and CFP oils, most commonly from woody biomass, including forest residues, can significantly increase the availability of renewable liquid crudes that can be processed in refineries. Potential biomass feedstock resources are more abundant and capable of meeting US demand for SAF, if those resources are converted appropriately.7 Besides increasing the supply of renewable crude, the use of wood and forest residues which are more prevalent feedstocks for fast pyrolysis processes, can enable efficient and productive forest management, especially in areas such as the western United States where dry weather has resulted in increasingly large forest fires. Commercial and pre-commercial implementations for pyrolytic biocrude production are being actively pursued, with many FP plants for biocrude production, and some CFP plants focused on both fuels and chemical products.8,9 One of the key questions for the use of biocrude as a feedstock for petroleum refineries includes the optimization of biomass conversion locations to allow the effective use of byproducts such as off-gases and solid char from pyrolysis, and maximization of environmental benefits. Here, we present two specific conceptual pyrolysis process configurations (representing FP and CFP) with quantitative assessments of the impacts of the usage of byproduct renewable energy sources towards various utility options allowed by plant locations. Those options have impacts on the economics and GHG emission metrics of biomass conversion. It is assumed in this study that the ultimate consumption of the biocrude for finishing to fuels will happen at a petroleum refinery where fluid catalytic cracking (for FP and CFP biocrude) and hydroprocessing operations (for CFP biocrude) can potentially process or co-process the biocrude with petroleum feedstocks. Fuel finishing from biocrude, a significant area of research,10 is not discussed in this paper. The scope of this study includes biomass production, conversion, and ends with the arrival of biocrude at the petroleum refinery; the focus is on options for the utilization of excess energy utilities available from biorefinery conversion. Previously documented biorefinery assumptions, based on conceptual designs, form the basis of this analysis. Economic estimates are indicative of relative changes among the various options; it should be appreciated that the absolute costs can vary based on specific industrial implementations, with related assumptions and market factors.Conceptual process designs
Simplified flow diagrams for the two conceptual biorefinery processes are shown in Fig. 1; one of them depicts a relatively simple biorefinery with FP, while the other is a more complex CFP process. The two processes were chosen because, although similar, they are differentiated by anticipated variations among biorefineries with respect to the use of hydrogen and the recovery of chemical coproducts; both hydrogen use and chemical coproducts are included in the CFP process example, but not relevant for a simple FP process. We point out some high-level differences, although it is not our intent here to present a comparison between FP and CFP; such comparisons need to include the finishing of biocrude to fuel products within the analysis scope. The FP process has higher liquid yields but produces a poorer quality biocrude with higher oxygen content; consequently, the FP biocrude has a lower cost. This cost advantage for FP biocrude is offset during fuel finishing because processing this poorer quality biocrude requires greater downstream expenses and produces less hydrocarbon fuel per volume of biocrude. The chemical coproducts, acetone and methyl-ethyl ketone (MEK) in our CFP example, were informed by bench-scale experimental results using a Pt/TiO2 catalyst for CFP.11 Other common coproducts expected from CFP biorefineries may include olefins and aromatics; those products are typically produced when using zeolite-based catalysts.12,13 | ||
| Fig. 1 Simplified flow diagrams for the fast pyrolysis (FP) and catalytic fast pyrolysis (CFP) conceptual biorefinery processes used to illustrate this study. Potential inputs, outputs, and utility integration options are listed. | ||
Fast pyrolysis (FP) process
In the FP process, dried woody biomass with reduced particle size (nominally 2–6 mm) is fed into the fast pyrolysis reactor. A dual circulating fluidized bed (CFB) reactor system with a pyrolysis reactor and a char combustor is modeled for the fast pyrolysis step; it includes a fast pyrolysis reactor where biomass and a heat carrier (sand) are entrained by fluidizing gases. The hot sand rapidly heats the biomass to ∼500 °C, thus thermally deconstructing the biomass into gases and condensable vapors, with the remaining biomass converted to a solid char product. The solids (sand and char) are separated from the gases and vapors via cyclones. The solids are then sent to a fluidized bed char combustor where the carbonaceous char is combusted to heat the sand that is then recirculated to the entrained flow fast pyrolysis reactor (note that char use or sequestration is not considered in this design); heat recovered from post-combustion cooling trains can be used for preheating process streams, steam generation, and electricity production. The gases and vapors from the FP reactor are sent to a condensation system where a liquid biocrude is recovered. Uncondensed off-gases are partially recycled for entraining the solids in the FP reactor and the remaining off-gases can be used for process heat, steam, electricity, or otherwise be used as a fuel gas by other colocated industrial consumers. Note that the condensed water, including water produced during fast pyrolysis and moisture present in biomass, remains mixed with organics in the oxygenated FP biocrude,14 thus lowering its heating value on a mass or volume basis. FP yields were modeled following previously published design models.3,15Catalytic fast pyrolysis (CFP) process
The CFP process uses the same fast pyrolysis reactor system design as described above. The separated vapors then pass through a hot gas filter to remove particulates before the stream goes into a fixed bed system for catalytic vapor upgrading, where the vapors are deoxygenated and hydrogenated. The fixed bed system is operated in a cyclic mode, with some reactors taken offline for regeneration to remove coke deposits via oxidation, while online reactors do the catalytic upgrading.16 Hydrogen is fed to the front end pyrolyzer along with the fluidizing gases to help reduce coking and facilitate hydrodeoxygenation and some hydrogenation during catalytic upgrading. The CFP vapors are then sent to a condensation system where the liquid organic product or biocrude is recovered. The condensed water phase separates from the organic phase and is sent to wastewater treatment, where the carbon in the water is oxidized in a regenerative thermal oxidizer. The off-gases after condensation contain uncondensed light oxygenates, including significant proportions of acetaldehyde, acetone, and MEK. Acetone and MEK are recovered because of their market values as chemical products. The recovery is carried out via adsorption/desorption of the light oxygenates, followed by multi-step distillation/decantation stages to produce chemicals grade acetone and MEK. Like the FP process, the char and off-gases can be combusted for process heat, steam, or electricity. In addition, the off-gases in this CFP configuration may be used as a fuel gas or for hydrogen production in a steam reformer to help supply the hydrogen demand in the process, with any excess hydrogen sold to a locally available consumer. The heat generated from catalyst regeneration via oxidation of coke deposited on the catalyst can also be recuperated via indirect heat exchange. Interested readers can find further details in the related design reports and publications based on similar processes.3,17 It is noted that the FP model design was at a lower pressure compared to the CFP process; the FP reactor absolute pressure was modeled at a lower pressure, close to 2 bars, to allow for downstream pressure drops. On the other hand, the CFP front end reactors in our conceptual design were modeled at nearly 8 bars.17 Although we chose a specified CFP design for this study, the conclusions will be similar for other CFP systems, including those using zeolite catalysts; changes in the disposition of energy byproducts from the process will have similar impacts on GHG emissions and costs around other base CFP designs.Impact of location
A qualitative summary of the location-based configurational differences, including feedstock transportation, the potential use of shared utilities and coproduct purification options, are depicted in Fig. 2. The biorefinery is a facility converting solid biomass to a liquid biocrude that may be further processed and refined at a petroleum refinery to produce infrastructure-compatible liquid fuels. Our assumption for a standalone biorefinery is a facility in the vicinity of biomass feedstock sources and pre-processing depot. The biorefinery is far from petroleum refining facilities and hence cannot share utilities and pipelines for optimal use of locally available energy resources. On the other hand, a colocated biorefinery can share industrial infrastructure and utilities with the petroleum refinery.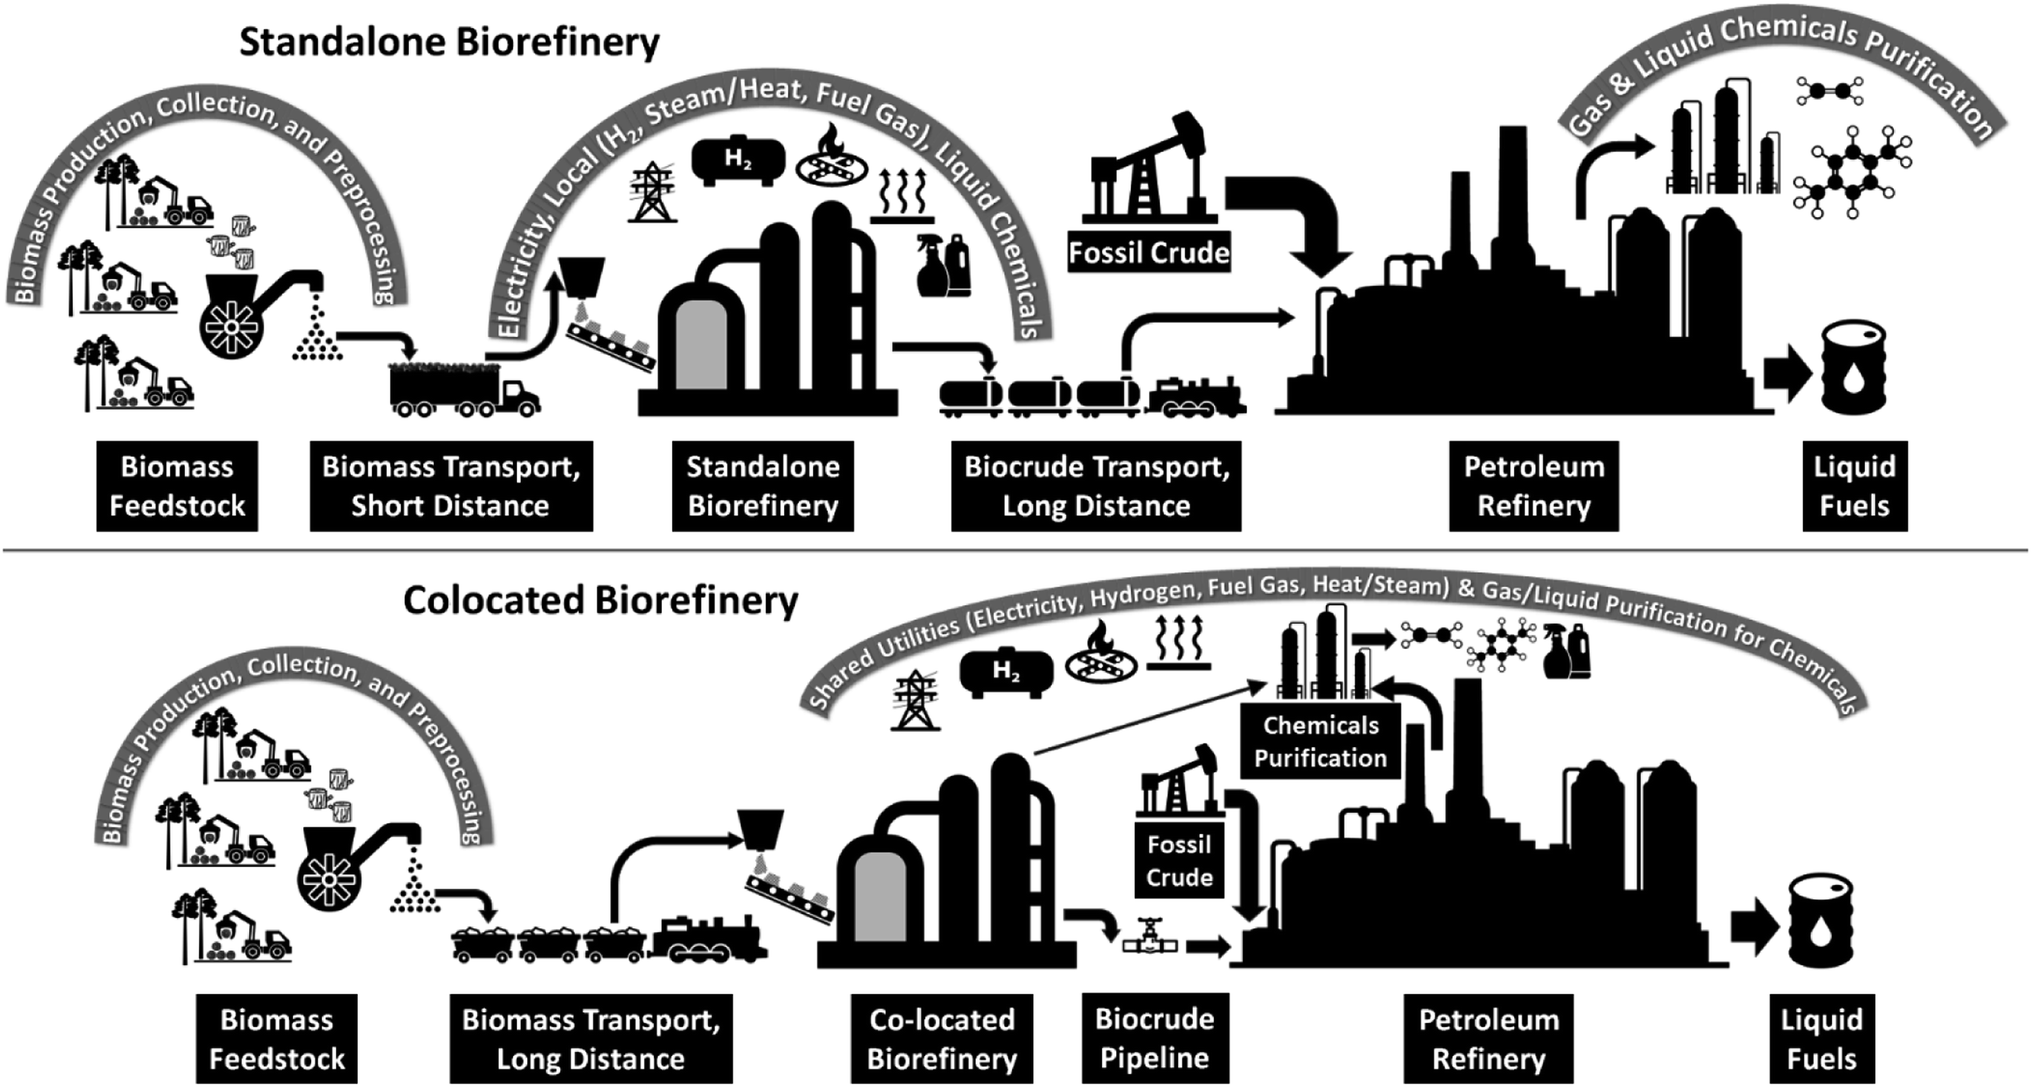 | ||
| Fig. 2 Biocrude production for use in petroleum refineries: differences between standalone (top) and colocated (bottom) biorefineries. | ||
Biomass feedstock is solid, heterogeneous, and has lower energy density compared to the liquid biocrude produced from biomass. Transportation of low energy density biomass over long distances is more expensive and results in higher emissions compared to biocrude shipment. From this standpoint, it is advantageous to locate a biorefinery close to the biomass source, produce the biocrude, and ship the higher energy density biocrude over longer distances to a petroleum refinery.
However, there are several advantages of colocating a biorefinery near a petroleum refinery. While feedstock transportation costs and related carbon footprint will be larger, a wider collection radius can allow diversity in biomass sourcing; since a higher feedstock price due to transportation distance will be inevitable in most cases, the increased radius of collection can enable a larger feedstock supply and a larger colocated biorefinery that benefits from economies of scale. There will also be more flexibility with respect to the utilization of gaseous outputs from bioconversion in a colocated scenario. Hydrogen produced from off-gases at a standalone biorefinery can be utilized to meet in-process hydrogen demand, but surplus biogenic hydrogen cannot be produced in the absence of a hydrogen infrastructure or other local consumers; thus, a distant petroleum refinery cannot benefit from the lower emissions from surplus bio-derived hydrogen, and hydrogen production will typically rely on fossil sources at the petroleum refinery. Similarly, excess heat and steam, and off-gas fuel can only be used for electricity production and export at a standalone location since the electrical grid is ubiquitous. In a colocated scenario, utility systems such as hydrogen production, fuel gases, steam system etc. may be integrated with existing facilities of a petroleum refinery.
Gaseous products like olefins at a standalone biorefinery may similarly be disadvantageous due to gas transportation costs. Current petrochemical complexes include complex distillation and product treating systems with significant throughputs and tight integration of utilities, including cold temperature systems, and need to operate at large scales to be profitable. Transportation of liquid coproducts, such as chemicals (acetone and MEK in our example) and aromatics, is significantly less cost prohibitive. Even in the case of liquid chemicals, the final purification of compatible chemicals, such as aromatics, should ideally be deferred to a chemical or petrochemical complex where there are advantages of scale and the use of existing process equipment. It should be noted that our CFP example produces acetone and MEK, which are not large volume products for petrochemical facilities. Hence, for compatibility reasons, our basic conversion process designs remained unaltered for standalone and colocated facilities; this may be different for other CFP plants with different product slates that include olefins and aromatics. The impacts of sharing feasible energy utilities are thus the primary focus of our analysis and not confounded by additional assumptions such as differences in chemical coproducts separations and purification; other potential integration, such as wastewater treatment, which will be process-specific, are not considered here.
Modeled cases for the FP and CFP configurations
Our model cost estimates assume mature plant performance of the FP and CFP conceptual designs; uncertainties and additional costs associated with pioneer plant installations are not included. The methods section outlines our key assumptions. All the cases presented use the same basis; hence our assessment of relative changes and sensitivities are expected to be generally representative. Absolute cost estimates for any specific project will depend on multiple other factors such as location, access, existing infrastructure, site-specific manufacturing and labor costs, technology maturity, carbon credits, market factors etc.Table 1 shows the various options for the use of excess heat and off-gases available at the biorefinery. Off-gases and excess heat generated from the combustion of char are included in most biomass fast pyrolysis process configurations1 and can embody significant proportions of energy from the biomass feedstock. The amount of energy available for utilities depends on the efficiency of the process because any energy not converted to desirable products will be dissipated in some other form. Some of the heat can be utilized for process heat exchange within the biorefinery. For lower conversion efficiencies towards biocrude and products, a larger proportion of energy remains to be utilized for utilities. Probable locations in Table 1 are only indicative and may change based on site-specific infrastructure. The locations shown in Table 1 assume that the electric grid is available at all locations, hence any excess electricity generated can be sold at all locations. However, the sale of steam, fuel gas, and hydrogen need colocation with industrial facilities, such as petroleum refineries; rural standalone facilities will very likely not have local consumers. Shared colocated facilities (i.e., by integrating a biorefinery with an adjacent petroleum refinery) can allow the beneficial use of biogenic utility sources while also sharing any compatible capital equipment. The modeled cases consider options for the production and purchase of the various utilities, with resulting impacts shown later.
| Excess heat and off-gas uses | Case | Fuel gas | Process steam | Extra steam | Electricity | H2 | Probable location |
|---|---|---|---|---|---|---|---|
| a 0 = zero output; ↔ = meet biorefinery process needs or produce extra if no other option; ↑ = maximize output; $ = purchase. | |||||||
| Process steam, max electricity | FP-1 | 0 | ↔ | 0 | ↑ $ | 0 | Standalone |
| Max steam, buy electricity | FP-2 | 0 | ↔ | ↑ | $ | 0 | Colocated |
| Steam, max fuel gas, buy electricity | FP-3 | ↑ | ↔ | ↔ | $ | 0 | Colocated |
| Process steam & H2, max electricity | CFP-1 | 0 | ↔ | 0 | ↑ | ↔ | Standalone |
| Process steam & electricity, max H2 | CFP-2 | 0 | ↔ | 0 | ↔ | ↑ | Colocated |
| Steam, buy electricity, max H2 | CFP-3 | 0 | ↔ | ↔ | $ | ↑ | Colocated |
| Process steam, max elec., buy H2 | CFP-4 | 0 | ↔ | 0 | ↑ | $ | Standalone |
| Max steam. Buy electricity & H2 | CFP-5 | 0 | ↔ | ↑ | $ | $ | Colocated |
| Steam, max fuel gas, buy elec. & H2 | CFP-6 | ↑ | ↔ | ↔ | $ | $ | Colocated |
High level summary of economics and GHG emissions
We provide high-level summaries of the estimated minimum selling prices (MSP) and GHG emissions before discussing further details in the following sections. Fig. 3 (for the FP family of cases) and Fig. 4 (for the CFP family of cases), in conjunction with information in Table 1 will allow the reader to visualize the best options for cost and GHG emissions, as estimated by our analysis with its underlying assumptions. The results are presented for the base plant size in our analysis, i.e., 2000 dry metric tonnes per day.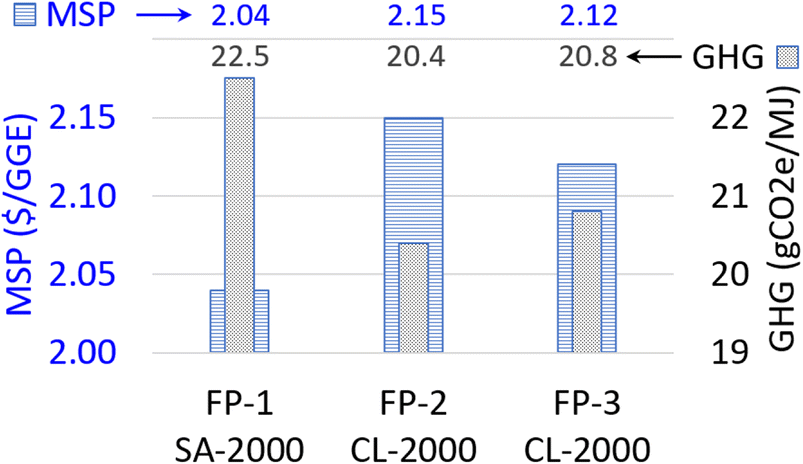 | ||
| Fig. 3 High-level summary of minimum selling price (MSP) and GHG emissions for FP cases with 2000 dry metric tonnes per day plant capacities in standalone (SA) or colocated (CL) configurations as shown in Table 1. Note that the y-axes scales are magnified and values for the different cases are not significantly different. | ||
 | ||
| Fig. 4 High-level summary of minimum selling price (MSP) and GHG emissions for CFP cases with 2000 dry metric tonnes per day plant capacities in standalone (SA) or colocated (CL) configurations as shown in Table 1. | ||
Energy flows in the conversion processes
Since this study is focused on the effects of various uses of energy byproducts/utilities from biomass conversion, it is important to visualize embodied energy in the inputs/outputs for the various options shown in Table 1. A lower heating value (LHV) basis was used in all the figures under columns (a) in Fig. 5 (for the FP cases) and Fig. 6 (for the CFP cases). LHVs were normalized to 100 LHV units of biomass feedstock input. The energy flow Sankey diagrams are placed next to GHG emissions and MSP charts to allow the reader to get a comprehensive snapshot of relevant metrics for each option. The FP cases, with our modeled yields, are significantly more efficient towards the production of biocrude compared to the CFP cases (ca. 76% vs. 42%, respectively). This leaves less energy available for utilities. While the production of electricity is included in the FP cases, there isn't enough excess energy available (using our yield assumptions) to produce all the electricity necessary to meet the entire biorefinery power demand; hence, some electricity imported in all the FP cases, even when electricity production is maximized in FP-1.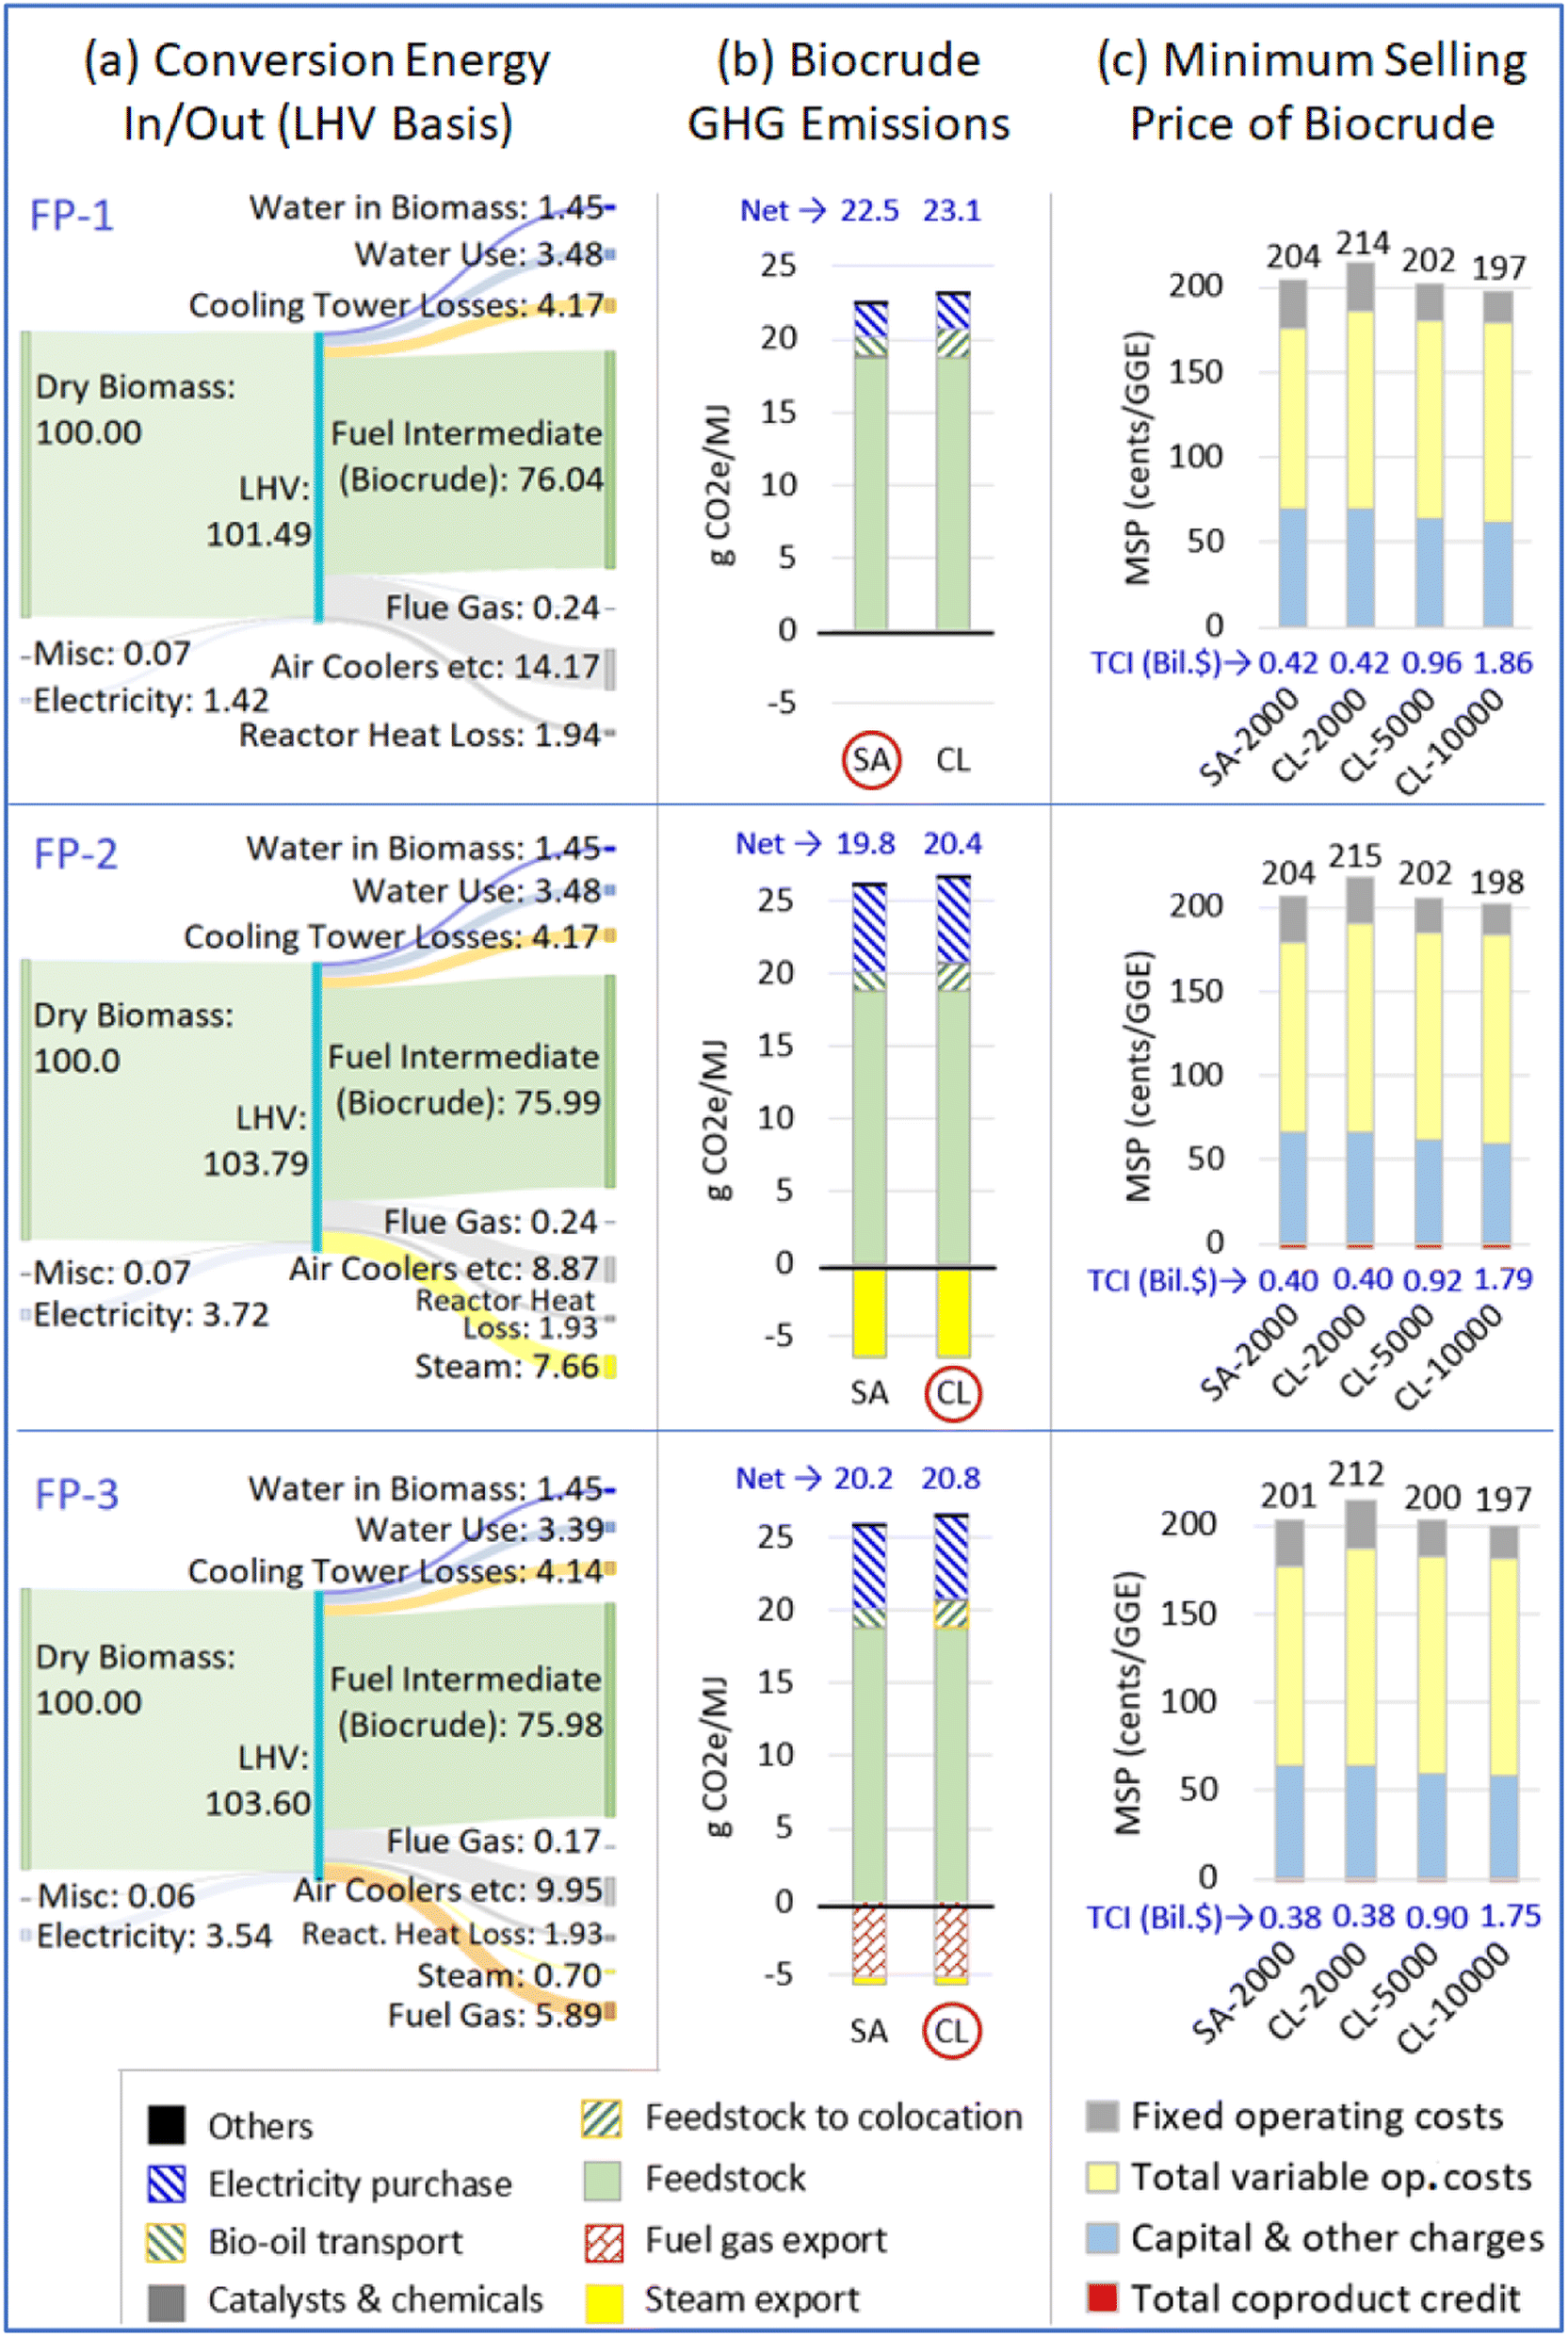 | ||
Fig. 5 Detailed results for FP cases: (a) energy inputs and outputs of conversion process per 100 lower heating value (LHV) units of biomass, (b) GHG emission contributions and net emissions attributed to the biocrude using coproducts displacement method for standalone (SA) and colocated (CL) cases; circled SA or CL cases indicate probable locations of each biorefinery configuration option, as shown in Table 1. For comparison, GHG emissions for petroleum gasoline is 93 g CO2e/MJ,19 (c) minimum selling price (MSP) of biocrude in 2020 US$ and units of cents per gallon gasoline equivalent (GGE) on an LHV energy basis for different locations (SA and CL) and biorefinery sizes of 2000, 5000, and 10![[thin space (1/6-em)]](https://www.rsc.org/images/entities/char_2009.gif) 000 dry metric tonnes per day; total capital investment (TCI) is shown for each case in billions of dollars. Detailed information corresponding to the GHG and MSP charts is available in ESI (Sections 1 and 2).† 000 dry metric tonnes per day; total capital investment (TCI) is shown for each case in billions of dollars. Detailed information corresponding to the GHG and MSP charts is available in ESI (Sections 1 and 2).† | ||
 | ||
| Fig. 6 Detailed results for CFP cases: (a) energy inputs and outputs of conversion process per 100 lower heating value (LHV) units of biomass, (b) GHG emission contributions and net emissions attributed to the biocrude using coproducts displacement method for standalone (SA) and colocated (CL) cases; circled SA or CL cases indicate probable locations of each biorefinery configuration option, as shown in Table 1. For comparison, GHG emissions for petroleum gasoline is 93 g CO2e/MJ,19 (c) minimum selling price (MSP) of biocrude in 2020 US$ and units of cents per gallon gasoline equivalent (GGE) on an LHV energy basis for different locations (SA and CL) and biorefinery sizes of 2000, 5000, and 10000 dry metric tonnes per day; total capital investment (TCI) is shown for each case in billions of dollars. Detailed information corresponding to the GHG and MSP charts is available in ESI (Sections 1 and 2).† | ||
The more complex CFP configuration, with a lower efficiency towards biocrude production compared to FP, has a higher proportion of excess energy available for utilities; hence the impacts of the similar process configuration changes get magnified in the CFP process results. Hydrogen was added to the mix of other utilities (electricity, steam, fuel gas) already included for the FP cases since our CFP conversion design requires hydrogen; this allows a broader set of process options. It is notable that heat losses (air cooler losses) increase significantly as thermal resources such as steam and fuel gases get converted to electricity (see cases CFP-1,4 generating electricity versus cases CFP-3,5,6 purchasing electricity); this is to be expected since those losses are inherent in steam turbine power generation without further use of the exhaust steam.18
GHG emissions
GHG emission impacts are captured in columns (b) of Fig. 5 (for FP) and Fig. 6 (for CFP). We used the coproducts displacement method to quantify the GHG impacts of using biogenic energy utilities over more prevalent sources; emission factors used for the utilities are provided in ESI Table SI-25.† There are other accounting methods in lifecycle analysis (e.g., Fig. 2 in ref. 19), but the displacement method is appropriate for this study as there is one primary product (biocrude) with smaller quantities of coproducts and no established physical relationship among the products. However, different coproduct handling methods may be necessary if the product slate shifts. Two separate bars are shown for the standalone (SA) and colocated (CL) cases. The differences between the SA and CL case assumptions are related to transportation only, since the core biomass conversion process is assumed identical for the two cases; biomass feedstock is transported 800 miles to a colocated facility by rail, versus biocrude being transported 800 miles by rail from a standalone biorefinery facility to the petroleum refinery. An average of 800 miles was chosen as the supply distance because it ensures sufficient availability of feedstocks for larger colocated biorefineries, or transportation to already established petroleum refineries located away from biomass feedstocks. Hence, the same offset is seen between the net SA and CL emissions for each family (FP and CFP) of cases. The offset is 0.6 g CO2e/MJ for FP, versus 2.8 g CO2e/MJ for the CFP cases; this is because a higher proportion of the mass of biomass feedstock is converted to the FP biocrude versus CFP biocrude. The FP biocrude also retains the produced water that needs to be transported, while most of the water separates from the CFP biocrude at the biorefinery. Note that CFP biocrude has a higher energy density and is less corrosive compared to FP biocrude and thus expected to be easier to handle during bulk transport. In both the FP and CFP cases, pumping energy and associated GHG emissions for pipeline transport of the biocrude from a colocated biorefinery are miniscule compared to the overall electricity footprint of the biorefinery. Only one set of GHG results is shown for all the CL cases because emissions from operations at different scales are comparable since most of the inputs and outputs scale linearly with different plant throughputs.Some of the smaller differences among the FP cases get magnified in the CFP cases because more excess energy is available in CFP. The air cooler losses associated with power generation translate to lower GHG benefits when electricity production is included. Overall, it is most beneficial to supply biogenic renewable utilities in their rawest forms (steam and fuel gas), offsetting similar utilities from fossil derived sources; however, there need to be local consumers of those raw utilities and thus only feasible in colocated cases. Note that fuel gas is assumed to be used for combustion, displacing an equivalent heating value of natural gas and associated GHG emissions. Depending on the specifics of an installation, the energy utility offsets may more than overcome the GHG penalty paid because of additional feedstock transportation distances for colocated facilities. Our process model, along with emission factor assumptions, show that greater GHG benefits can be obtained by using off-gases for hydrogen production rather than electricity (e.g., case CFP-3 vs. CFP-4). Once again, local infrastructure may not allow the consumption of any excess hydrogen produced. Technically, purchasing and selling electricity is an option available at all facilities, irrespective of location. When sufficient infrastructure support is available, purchasing electricity to help maximize other energy utilities may benefit GHG reduction (case CFP-3). However, one needs to be cautious drawing sweeping conclusions without a thorough review of specific process implementations, including aspects such as emission factors, allowable credits, and accounting methods. Policy incentives can have significant impacts on commercial decisions but vary by location; they are not considered in this study. Detailed breakdowns of GHG emissions are available in the ESI (Section 1).† It is noted that lower efficiency towards biocrude and correspondingly higher amounts of energy utilities in the CFP process (compared to the FP process) translate to better GHG reduction metrics after the utilization of the energy utilities for displacing fossil sources. However, the maximization of biocrude for liquid fuels should continue to be the primary objective for long-term sustainability, effective resource utilization, and viable economics because future electricity and hydrogen production technologies are expected to move towards sustainable pathways using renewable electricity, while liquid biofuels may be a substantial contributor towards SAF.
Techno-economics
Results from techno-economic analyses, reflected by the MSP of biocrude are shown in columns (c) of Fig. 5 (for FP) and Fig. 6 (for CFP). The sub-cases under each option are tagged by SA (standalone) or CL (colocated) followed by the feedstock processing capacity of the biorefinery; the SA cases are limited to 2000 dry metric tonnes per day (TPD), while facilities with 2000, 5000, and 10000 TPD are considered for colocation. For example, CL-5000 is a colocated (CL) facility with a capacity of 5000 TPD. 2000 TPD is the usual base case assumption in previous conceptual designs leveraged for this study.3,11,15,17 Note that the same conversion process and related configurations are maintained for both standalone and colocated facilities, and no basic technology changes are assumed upon scaleup. The key benefits of scaleup are the lowering of capital costs per ton of feedstock processed because of the use of larger equipment, and lower fixed operating costs such as personnel requirements that do not grow significantly with the increase in plant size (these are known benefits of economies of scale). The estimated impact of size on total capital investment (TCI) in billions of US dollars is noted in the figures. With future scaleup and commoditization,20 larger scales may be possible at colocated facilities without significant additional penalties on feedstock costs and GHG emissions beyond 800 miles of transportation already accounted in this analysis; 800 miles provides a larger feedstock collection radius and can potentially allow enough feedstock availability for scaleup at distant petroleum refinery locations without significantly affecting local feedstock supplies and prices. It is also noted that 800 miles is a nominal distance assumed for this analysis; transportation distances and feedstock costs will be dictated by specific locational factors, with lower transportation costs and GHG emissions for shorter distances, especially for smaller biorefineries located near feedstock sources. Demand-supply effects will be a separate consideration in a mature biofuel economy. The base feedstock cost assumption for our analysis is $70/dry US ton ($77/dry metric tonne) for woody feedstocks after rounding modeled cost projections for 2000 TPD CFP processes.21 Feedstock costs and GHG emissions can vary due to various factors in addition to transportation, including locational infrastructure, scale and local supply, logistics, and aggregation quantities/strategies for preprocessing; the cost and GHG contribution factors presented in the ESI† will allow the interested reader to prorate the feedstock contributions using different sets of assumptions, including the average transportation distance. Rail transportation of 800 miles leads to a feedstock cost of $111/dry US ton ($122/dry metric tonne) at the colocated facility; this approximation captures general impacts, although variations are expected for specific facilities and feedstocks. Accounting for feedstock and biocrude transportation is the only difference between cases SA-2000 and CL-2000.
Fig. 5 and 6 indicate that this feedstock transportation penalty can be overcome with increases in plant size at colocated facilities. TCI per unit of feedstock processed drops more rapidly when scaling up from 2000 TPD to 5000 TPD versus when scaling up from 5000 TPD to 10000 TPD; the potential advantage of lower feedstock costs for smaller plants is not included in this analysis but can be factored in separately with information about specific locational supplies and costs. The TCI trend is consistent with more rapid declines in cost expected during scaleup at smaller scales. Scaleup cost reduction is also tempered in our analysis by an assumption that the front-end FP reactor units (reactor units part of both our FP and CFP configurations) are each limited to 1000 TPD throughputs, necessitating the use of multiple duplicated units during scaleup; this may be overcome with further technology maturity, but the 1000 TPD limit is a prudent near-term assumption with the current state of industrial biomass fast pyrolysis implementations.8 The economic benefits from scaleup are also more pronounced for the more complex CFP configuration compared to the simpler FP design. Detailed breakdowns of cost contributions are available in the ESI (Section 2).†
Discussion
We see relatively flat GHG emissions and cost responses in all the FP cases within the options explored in this study (Fig. 3 and 5). This is because higher conversion efficiency to FP biocrude leaves less excess energy from biomass for other uses. Thus, the energy considerations presented in this article deserve more attention in technologies with lower conversion efficiencies to biocrude, such as CFP processes. As noted previously, the advantages of higher efficiency and lower cost of FP biocrude are offset later during downstream processing because of significantly higher losses compared to CFP biocrude during finishing to hydrocarbon fuels; the current analysis stops with the production of biocrude, and thus cannot be used for a comparison between FP and CFP for finished fuel production.Case CFP-3 is the lowest GHG emission option among all the CFP cases, and the lowest cost option among the colocated (CL) CFP plants (Fig. 4 and 6). CFP-3 benefits from lower capital costs by avoiding power generation equipment while getting value from supplying excess steam to a colocated consumer. Note that this case also maximizes hydrogen production, which provides significant GHG reduction benefits. Specifically, CFP-3 (−9.1 g CO2e/MJ) has a ∼150% GHG reduction compared to the standalone (SA) CFP-1 (17.7 g CO2e/MJ) case. For the same colocated CFP-3 case (with higher feedstock transportation costs) there can be a cost reduction of ∼10% by implementing a 10000 TPD colocated facility ($2.95/GGE) compared to the 2000 TPD standalone facility ($3.40/GGE) in CFP-1. A graded distance-based approach to feedstock volumes, costs, and emissions was not included in this analysis and it is noted again that for all colocated (CL) plant sizes we assume a fixed distance (800 miles) for estimating long-distance rail transportation costs and emissions for the entire feedstock, along with a constant feedstock cost near biomass growth and preprocessing locations; the interested reader can estimate results by prorating different sets of feedstock related assumptions using details in the ESI.† These conclusions may not be immediately evident without detailed quantification because biomass feedstock transportation introduces significant cost and GHG emissions penalties for the colocated facilities; an average transportation distance of 800 miles is a generous assumption for many petroleum refineries located in the southeastern US, and this conclusion is likely relevant for some of those refineries.
Conclusion
This work illustrates some of the key considerations for the efficient use of biomass resources if pyrolysis-derived biocrudes are integrated into the petroleum refining infrastructure. Hydrogen demand will increase if CFP oils are co-hydroprocessed, and renewable hydrogen from biomass in colocated facilities can improve sustainability at refineries. The potential for hydrogen production leveraging off-gases from CFP (FP to a lesser extent) and associated GHG emissions benefits align well with the growing hydrogen demand. The analysis indicates that hydrogen as a byproduct may be relevant in the near term and be even more attractive if the current steam methane reforming (SMR) facilities' infrastructure in colocated situations can be leveraged to use off-gases. This can be a beneficial near-term approach even as research and development on sustainable low-cost hydrogen from renewable electricity makes progress; with concurrent progress towards increased CFP biocrude efficiency, the availability of off-gases from CFP will also go down, indicating potential synergy of this approach with other low-cost hydrogen research, if CFP technologies start getting implemented with an expectation of future efficiency gains towards biocrude production. Electricity production is less favorable compared to using excess energy in other forms; this will be further reinforced from a GHG emissions standpoint as the electric grid gets decarbonized. The benefits of using excess energy resources in raw forms (steam and fuel gas) without substantial additional expenditure and potential use of off-gases as a feedstock for hydrogen production can be leveraged only with the availability of local consumers and infrastructure. The synergistic consideration of energy flows, GHG emissions, and costs presented can help understand the effectiveness of various energy utility options. While we provide a guiding framework with some key considerations, it should be noted that specific details and assumptions need to be considered before determining the best options for any implementation.Feedstock costs and associated GHG emissions have significant local variations, and that detailed topic and is not explored in this article. Assumptions in this article about feedstock costs and transportation are simplistic, using previously published modeled costs and emissions for supply to the throat of a biorefinery reactor, along with costs and emissions from rail transportation over a distance of 800 miles to supply biorefineries located in vicinities of petroleum refineries. Specifically, a graded approach with the increase in feedstock collection radius in relation to any specific petroleum refinery location is not included in the feedstock assumptions. The granularity of the results presented in the ESI† will allow the reader to substitute different feedstock related cost and emissions assumptions to reflect information for any specific location; those efforts will be complementary and not overlapping with the conversion-focused analysis presented here and may easily be overlaid by stakeholders who have specific feedstock information available.
While biomass liquefaction via FP and CFP are promising routes for biocrude production, there remain significant challenges towards the development of reliable large-scale biomass feedstock and conversion infrastructures; industrial investments are necessary for scaleup and the resolution of related challenges. Careful design and adequate investments are necessary for efficient biomass utilization because any wastage, such as flared fuel gas or vented steam, will reduce GHG benefits and increase overall costs.
Methods
Process model
Detailed process models for CFP (including FP as a subset) were developed using Aspen Plus.22 Assumptions and descriptions of the modeling framework are discussed thoroughly in our 2015 design report.3 Sample models are also publicly available.23 Subsequent modifications reflecting our CFP research were presented in other publications.11,17,24 The FP and CFP processes are presented in Fig. 1 and along with related overviews included earlier in this article; the process models for this work were adapted from our previously developed models. The models included woody biomass feedstock with 10 wt% moisture and elemental analysis maintained from our previous models (Table 2 in ref. 11). Products from the FP and CFP reactors included model compounds shown in Appendix F of our 2015 design report,3 with some subsequent additions to reflect key major compounds identified by experimental work, such as coproducts acetone and MEK produced when using a Pt/TiO2 CFP catalyst.11 FP and CFP yields reflect assumptions in previous work. FP yield assumptions were based on a 2013 report (Table 5 in ref. 15) and closely matched in subsequent modeling work for consistency, with slight alterations to match experimental char yields (Table ES-1 in ref. 11). CFP yields are consistent with the 2020 SOT (State of Technology) reported in Tables A-1, ES-1, and ES-2 in ref. 11. As noted previously a higher design pressure was proposed for CFP to facilitate better hydrogen activation, and it also helped reduce equipment sizes and capital costs because of smaller volumetric flow rates at higher pressures when compared to a lower pressure system. The Aspen Plus model ensures complete mass and energy balances. Process heat integration duties were determined via a separate pinch analysis exercise to ensure a thermodynamically feasible biorefinery (see Section 3.10 in ref. 3 for further details of our approach); the minimum approach temperature for process heat exchange, determined via pinch analysis, was maintained at approximately 15° F for all models to ensure a degree of parity with respect to heat integration among all the modeled cases; note that increases in the minimum approach temperature lowers capital costs for heat exchangers but also lowers process energy efficiency (and vice versa). LHV basis energy flows shown in Fig. 5(a) and 6(a) were derived from stream information in the process model.Economics
Detailed documentation of capital and operating cost bases are included in our previous publications (Appendices A and B in ref. 3, Table 7 in ref. 11, and Table 2 in ref. 17). Total capital investment (TCI) for each of the cases, derived from equipment costs using a factored approach (as described in Section 4.1 of ref. 11), are shown in Section 3 of the ESI.† Major operating cost contributions are included in the tables in Section 2 of the ESI.† Note that the equipment costs for any specific model were derived by scaling the documented base equipment costs using the relevant parameters (flow rates, heat duties, power consumption) from each process model; no design changes were included as part of the scaleup estimates. Economic assumptions and methodology for calculating the MSP for biocrude using a discounted cash flow rate of return analysis were also previously published (Section 1.1 of ref. 11); the income tax rate was modified to 25% in this study. MSP is reported in cents per GGE; GGE or gallon gasoline equivalent on an LHV basis is defined as 116090 Btu/gallon.25 All costs were converted to 2020 US$ using cost indices for equipment,26 raw materials,27 and labor.28 Scaling exponents documented in previous work3 were used for the estimation of capital costs at different biorefinery capacities. Noting that there have been significant swings in energy prices in recent years, unit prices of key energy byproducts vital for this analysis are shown separately in the Table SI-22† to allow interested readers to derive prorated estimates for alternate cost assumptions. Biomass and biocrude rail transportation cost of 5.1 cents per ton-mile were based on published information.29 Feedstock production and preprocessing costs were previously published.21 Note that the same feedstock assumptions are maintained for all the cases, and the only differences are related to feedstock or biocrude transportation in the standalone and colocated cases, as stated earlier.
GHG emissions
The lifecycle inventory for all the cases, informed by the process models, is shown in Section 5 of the ESI.† Key emission factors derived from GREET25 are shown in Table SI-25† to allow the interested reader to estimate prorated GHG emission impacts of alternate emission factors.Data availability
References with significant details and sample models from previous related work have been provided. ESI† provides detailed breakdowns for the analysis presented, including key underlying assumptions that may be altered by the interested reader to estimate the impacts of alternate assumptions.Author contributions
AD: original draft, final editing, techno-economic analysis (TEA) & GHG modeling, figures and tables, lead for BETO funded Thermochemical Analysis project; MST: TEA modeling, analysis lead for CRADA project with ExxonMobil, review/edits; ECDT: GHG modeling, including emission factors used, review/edits; JAS: NREL thermo-catalytic conversion lead and CRADA project lead, overall guidance, review/edits.Conflicts of interest
The authors declare no competing interests. Products or companies are named solely for descriptive clarity, and this neither constitutes nor implies endorsement by NREL, DOE, or by the U.S. government.Acknowledgements
This work was authored by the National Renewable Energy Laboratory, operated by the Alliance for Sustainable Energy, LLC, for the US Department of Energy under contract no. DE-AC36-08GO28308. Funding was provided by US Department of Energy Office of Energy Efficiency and Renewable Energy Bioenergy Technologies Office, and ExxonMobil Technology and Engineering Company (EMTEC) under a CRADA project with NREL. The views expressed in the article do not necessarily represent the views of the DOE, the US Government, NREL, or ExxonMobil. The results and associated narrative reflect the outputs of analysis conducted by the authors using the specified assumptions detailed in this article. Neither the United States Government nor any agency thereof, nor the Alliance for Sustainable Energy, LLC, nor any of their employees, makes any warranty, express or implied, or assumes any legal liability or responsibility for the accuracy, completeness, or usefulness of any information, apparatus, product, or process disclosed, or represents that its use would not infringe privately owned rights. The US Government retains and the publisher, by accepting the article for publication, acknowledges that the US Government retains a nonexclusive, paid-up, irrevocable, worldwide license to publish or reproduce the published form of this work, or allow others to do so, for US Government purposes. The authors wish to thank the following participants from ExxonMobil for guidance and discussions during this analysis: Xiaochun Xu, Randy Smiley, Theodore Walker, Arun Sharma, Sundararajan Uppili, Eric Bunnelle, Scott Kelman, Kirti Richa. The following NREL participants contributed towards NREL's pyrolysis research and/or the ExxonMobil CRADA, helping inform experimental and/or literature-based assumptions that guided our analysis: Calvin Mukarakate, Kristiina Iisa, Michael Griffin, Mark Nimlos, Tuong Bui, Nicholas Carlson, Robert Brasington. We thank many other researchers from NREL and other US National Laboratories who contributed to pyrolysis research over the years. For prior published analysis work under BETO projects, we thank Hao Cai from Argonne National Laboratory for lifecycle analysis and Damon S. Hartley from Idaho National Laboratory for feedstock analysis that supported the CFP project. Graphic icons used to assimilate Fig. 2 were developed by Elizabeth Stone (primary contributor, NREL), A. Dutta, with additional icons imported from the Microsoft PowerPoint icon library. Communications support was provided by Michael Deneen and Erik Ringle from NREL. Sankey diagrams were developed using online tools available at https://sankeymatic.com/.References
- R. H. Venderbosch and W. Prins, Fast Pyrolysis Technology Development, Biofuels, Bioprod. Biorefin., 2010, 4, 178–208, DOI:10.1002/bb.
- C. Liu, H. Wang, A. M. Karim, J. Sun and Y. Wang, Catalytic Fast Pyrolysis of Lignocellulosic Biomass, Chem. Soc. Rev., 2014, 43, 7594–7623, 10.1039/C3CS60414D.
- A. Dutta, A. Sahir, E. Tan, D. Humbird, L. Snowden-Swan, P. Meyer, J. Ross, D. Sexton, R. Yap, and J. Lukas, Process Design and Economics for the Conversion of Lignocellulosic Biomass to Hydrocarbon Fuels—Thermochemical Research Pathways with in Situ and Ex Situ Upgrading of Fast Pyrolysis Vapors, National Renewable Energy Laboratory, Golden, CO, 2015, NREL/TP-5100-62455, PNNL-23823, https://www.nrel.gov/docs/fy15osti/62455.pdf Search PubMed.
- M. S. Talmadge, R. M. Baldwin, M. J. Biddy, R. L. McCormick, G. T. Beckham, G. A. Ferguson, S. Czernik, K. A. Magrini-Bair, T. D. Foust, P. D. Metelski, C. Hetrick and M. R. Nimlos, A perspective on oxygenated species in the refinery integration of pyrolysis oil, Green Chem., 2014, 16, 407–453, 10.1039/C3GC41951G.
- A. Pinho, M. B. B. Almeida, F. L. Mendes, L. C. Casavechia, M. S. Talmadge, C. M. Kinchin and H. L. Chum, Fast pyrolysis oil from pinewood chips co-processing with vacuum gas oil in an FCC unit for second generation fuel production, Fuel, 2017, 188, 462–473, DOI:10.1016/j.fuel.2016.10.032.
- M. M. Bomgardner, California refiners shift production to renewables, New California diesel entrants will compete with chemical industry for cheap feedstocks, Chem. Eng. News, 2020, 98(32), 10 Search PubMed.
- U.S. Department of Energy, Office of Energy Efficiency and Renewable Energy, Bioenergy Technologies Office, Sustainable Aviation Fuel: Review of Technical Pathways, DOE/EE-2041, September 2020, https://www.energy.gov/sites/prod/files/2020/09/f78/beto-sust-aviation-fuel-sep-2020.pdf Search PubMed.
- S. Wijeyekoon, K. Torr, H. Corkran and P. Bennett, Commercial Status of Direct Thermochemical Liquefaction Technologies, IEA Bioenergy: Task 34, August 2020, https://www.ieabioenergy.com/wp-content/uploads/2020/09/Direct-Thermochemical-Liquefaction_Commercialization_Overview.pdf Search PubMed.
- G. Perkins, T. Bhaskar and M. Konarovad, Process development status of fast pyrolysis technologies for the manufacture of renewable transport fuels from biomass, Renewable Sustainable Energy Rev., 2018, 90, 292–315, DOI:10.1016/j.rser.2018.03.048.
- M. Magrini, H. Wang, Z. Li, Co-Processing Bio-oils in Refineries, DOE Bioenergy Technologies Office (BETO) 2021 Peer Review, March 22, 2021, https://www.energy.gov/sites/default/files/2021-04/beto-26-peer-review-2021-sdi-magrini.pdf Search PubMed.
- A. Dutta, C. Mukarakate, K. Iisa, H. Wang, M. Talmadge, D. Santosa, K. Harris, F. Baddour, et al., Ex Situ Catalytic Fast Pyrolysis of Lignocellulosic Biomass to Hydrocarbon Fuels: 2020 State of Technology, National Renewable Energy Laboratory, Golden, CO, 2021, NREL/TP-5100-80291, https://www.nrel.gov/docs/fy21osti/80291.pdf Search PubMed.
- H. C. Genuino, I. Muizebelt, A. Heeres, N. J. Schenk, J. G. M. Winkelman and H. J. Heeres, An improved catalytic pyrolysis concept for renewable aromatics from biomass involving a recycling strategy for co-produced polycyclic aromatic hydrocarbons, Green Chem., 2019, 21(14), 3802–3806, 10.1039/c9gc01485c.
- T. Mazanec, E. Schmelzer, F. Pesa, D. McCullough, R. Song and Y. Cheng, Chemical intermediates by catalytic fast pyrolysis process, US Pat., US9249080B2, Feb 2, 2016 Search PubMed.
- A. Oasmaa and C. Peacocke, Properties and Fuel Use of Biomass Derived Fast Pyrolysis Liquids: A Guide, VTT Publications 731, 2010, https://www.vttresearch.com/sites/default/files/pdf/publications/2010/P731.pdf Search PubMed.
- S. Jones, P. Meyer, L. Snowden-Swan, A. Padmaperuma, E. Tan, A. Dutta, J. Jacobson and K. Cafferty, Process Design and Economics for the Conversion of Lignocellulosic Biomass to Hydrocarbon Fuels: Fast Pyrolysis and Hydrotreating Bio-Oil Pathway, NREL/TP-5100-61178; PNNL-23053, National Renewable Energy Laboratory, Pacific Northwest National Laboratory, Richland, WA, Golden, CO, November 2013. https://www.pnnl.gov/main/publications/external/technical_reports/PNNL-23053.pdf Search PubMed.
- M. B. Griffin, K. Iisa, H. Wang, A. Dutta, K. A. Orton, R. J. French and D. M. Santosa, et al. Driving towards cost-competitive biofuels through catalytic fast pyrolysis by rethinking catalyst selection and reactor configuration, Energy Environ. Sci., 2018, 11, 2904–2918, 10.1039/C8EE01872C.
- A. Dutta, J. Schaidle, D. Humbird, F. Baddour and A. Sahir, Conceptual Process Design and Techno-Economic Assessment of Ex Situ Catalytic Fast Pyrolysis of Biomass: A Fixed Bed Reactor Implementation Scenario for Future Feasibility, Top. Catal., 2016, 59(1), 2–18, DOI:10.1007/s11244-015-0500-z.
- US Environmental Protection Agency Combined Heat and Power Partnership, Catalog of CHP Technologies: Section 4. Technology Characterization – Steam Turbines, March 2015. https://www.epa.gov/sites/default/files/2015-07/documents/catalog_of_chp_technologies_section_4._technology_characterization_-_steam_turbines.pdf Search PubMed.
- H. Cai, L. Ou, M. Wang, R. Davis, A. Dutta, K. Harris, M. Wiatrowski, et al., Supply Chain Sustainability Analysis of Renewable Hydrocarbon Fuels via Indirect Liquefaction, Ex Situ Catalytic Fast Pyrolysis, Hydrothermal Liquefaction, Combined Algal Processing and Biochemical Conversion: Update of the 2020 State-Of-Technology Cases, ANL/ESD-21/1. Argonne National Laboratory, Lemont, IL, 2021, DOI:10.2172/1807565.
- D. J. Muth, M. H. Langholtz, E. C. D. Tan, J. J. Jacobson, A. Schwab, M. W. Wu, A. Argo, C. C. Brandt, K. G. Cafferty, Y. Chiu, A. Dutta, L. M. Eaton and E. M. Searcy, Investigation of thermochemical biorefinery sizing and environmental sustainability impacts for conventional supply system and distributed pre-processing supply system designs, Biofuels, Bioprod. Biorefin., 2014, 8, 545–567, DOI:10.1002/bbb.1483.
- D. S. Hartley, D. N. Thompson, and H. Cai., Woody Feedstocks 2020 State of Technology Report, Idaho National Laboratory, Idaho Falls, ID, 2021, INL/EXT-20-59976, DOI:10.2172/1782211.
- Aspen Plus Process Simulator Version 10, Aspen Technology, Inc. 20 Crosby Drive, Bedford, MA, USA Search PubMed.
- Ex Situ and In Situ Catalytic Fast Pyrolysis Models, Available at: https://www.nrel.gov/extranet/biorefinery/aspen-models/ Search PubMed.
- A. Dutta, H. Cai, M. S. Talmadge, C. Mukarakate, K. Iisa, H. Wang, D. M. Santosa, L. Ou, D. S. Hartley, A. N. Wilson, J. A. Schaidle and M. B. Griffin, Model Quantification of the Effect of Coproducts and Refinery Co-Hydrotreating on the Economics and Greenhouse Gas Emissions of a Conceptual Biomass Catalytic Fast Pyrolysis Process, Chem. Eng. J., 2023, 451, 138485, DOI:10.1016/j.cej.2022.138485.
- Argonne National Laboratory, GREET Model: the Greenhouse Gases, Regulated Emissions, and Energy Use in Transportation Model, Argonne National Laboratory, Argonne, IL (United States), 2022. https://greet.es.anl.gov/ Search PubMed.
- Chemical Engineering, Chemical Engineering Plant Cost Index, 2021, Accessed January 2023 Search PubMed.
- U.S. Bureau of Labor Statistics, PPI Industry Sub-sector Data for Chemical Manufacturing, 2018, Accessed January 2023. https://data.bls.gov/timeseries/PCU325---325---?amp%253bdata_tool=XGtable%26output_view=data%26include_graphs=true Search PubMed.
- U.S. Bureau of Labor Statistics, Databases, Tables & Calculators by Subject, 2018, Accessed January 2023, http://data.bls.gov/cgi-bin/srgate (enter CEU3232500008 series id) Search PubMed.
- D. Austin, Pricing Freight Transport to Account for External Costs, Working Paper Series, Congressional Budget Office, Washington DC, March 2015, https://www.cbo.gov/sites/default/files/114th-congress-2015-2016/workingpaper/50049-Freight_Transport_Working_Paper-2.pdf Search PubMed.
Footnote |
| † Electronic supplementary information (ESI) available. See DOI: https://doi.org/10.1039/d3se00745f |
| This journal is © The Royal Society of Chemistry 2023 |