 Open Access Article
AI facilitated fluoro-electrochemical phytoplankton classification†
Haotian
Chen‡
 a,
Samuel
Barton‡
b,
Minjun
Yang
 a,
Rosalind E. M.
Rickaby
b,
Heather A.
Bouman
b and
Richard G.
Compton
 *a
*a
aPhysical and Theoretical Chemistry Laboratory, Department of Chemistry, University of Oxford, South Parks Road, Oxford OX1 3QZ, UK. E-mail: richard.compton@chem.ox.ac.uk
bDepartment of Earth Sciences, University of Oxford, South Parks Road, Oxford OX1 3AN, UK
First published on 2nd May 2023
Abstract
Marine phytoplankton is extremely diverse. Counting and characterising phytoplankton is essential for understanding climate change and ocean health not least since phytoplankton extensively biomineralize carbon dioxide whilst generating 50% of the planet's oxygen. We report the use of fluoro-electrochemical microscopy to distinguish different taxonomies of phytoplankton by the quenching of their chlorophyll-a fluorescence using chemical species oxidatively electrogenerated in situ in seawater. The rate of chlorophyll-a quenching of each cell is characteristic of the species-specific structural composition and cellular content. But with increasing diversity and extent of phytoplankton species under study, human interpretation and distinction of the resulting fluorescence transients becomes increasingly and prohibitively difficult. Thus, we further report a neural network to analyse these fluorescence transients, with an accuracy >95% classifying 29 phytoplankton strains to their taxonomic orders. This method transcends the state-of-the-art. The success of the fluoro-electrochemical microscopy combined with AI provides a novel, flexible and highly granular solution to phytoplankton classification and is adaptable for autonomous ocean monitoring.
Introduction
Phytoplankton are responsible for nearly 50% of global net primary production, are the underlying energy source of aquatic ecosystems,1 biomineralize inorganic carbon species dissolved in seawater at the rate of 1015 g per year, and play key roles in the Earth's biogeochemistry2 despite accounting for less than 1% of photosynthetic biomass on Earth.3 Phytoplankton are microscopic organisms that live wholly or partly in quasi-suspension in open-water and use chlorophyll to convert sunlight into chemical energy via photosynthesis.4 Phytoplankton are remarkably diverse and can be classified into multiple functional groups, including diatoms, dinoflagellates, coccolithophores, cyanobacteria and more.5 While phytoplankton are considered ubiquitous in the ocean, their productivity and diversity may be decreasing as phytoplankton in eight out of ten ocean regions were observed to decline in recent decades.6 Such a global recession of phytoplankton population was attributed to climate forcing, and estimated to continue declining at a rate of ∼1% of the global median per year.6 A recent report also suggested a small but significant decline in ocean primary production over a 17 years timespan.7Examples of phytoplankton groups at risk from climate forcing include the biogeochemically important diatoms and coccolithophores. Diatoms, a key phytoplankton functional group that account for 40% of the biological pump of CO2,8,9 are susceptible to climate change: as climate change causes more nutrient-depleted conditions in the surface ocean, small phytoplankton are predicted to become favoured at the expense of the larger diatoms.10Emiliania huxleyi (E. huxleyi) is a coccolithophorid and is considered the most important calcifying species in terms of biomass and carbon sequestration. But increasing atmospheric CO2 and ocean acidification is reported to have adversely affected calcifying species including E. huxleyi.11
As phytoplankton variability is a key driver of biogeochemical variability, oceanographers have urged that improving understanding of the variability of phytoplankton is important to forecast the extent of global climate change.12
Monitoring plankton to count, identify and classify them throughout the ocean both at depth and in different locations present an as yet unmet challenge of major urgency. Satellite imaging and imaging flow cytometry are two common methods to monitor phytoplankton with different levels of granularity. While satellite imaging covers at the global scale at high frequencies (daily), it can be obstructed by cloud and ice covers, and in any case, it cannot capture the abundance and diversity of sub-surface of phytoplankton populations.13 Selecting proper algorithms to unravel complex relationships between ocean colour and grouping are another major challenge, especially when no phytoplankton group dominates.14 Imaging flow cytometry is the state-of-the-art method to classify phytoplankton but suffers from low taxonomic resolution, and excess complication caused by multiple magnification objectives and working modes; in addition, not all flow cytometers are adapted for large particles, limiting their use for some diatom and dinoflagellate species.15
To address the above-described issues, a potentially transformative fluoro-electrochemical technique was introduced in 2019 as a novel, complementary approach with high sensitivity, environmental adaptability without sacrificing the resolution for smaller-sized ‘nanoplankton’.16 By quenching fluorescence from in vivo chlorophyll-a with reactive chemical species generated at a highly oxidizing electrode, fluoro-electro microscopy records the rate of quenching which varies by over two orders of magnitude from species to species. The proof-of-concept study by some of the present authors have successfully classified 6 phytoplankton species based on their susceptibility level.16 More importantly, it has been reported that although different life-stages coexisted within the population of a species of marine green algae, Chlamydomonas concordia, the size-normalized susceptibility was not affected by its life stages.17,18 However, considering the vast number of phytoplankton species in the contemporary ocean (∼5000),19 systematically classifying them using a single susceptibility parameter is challenging.
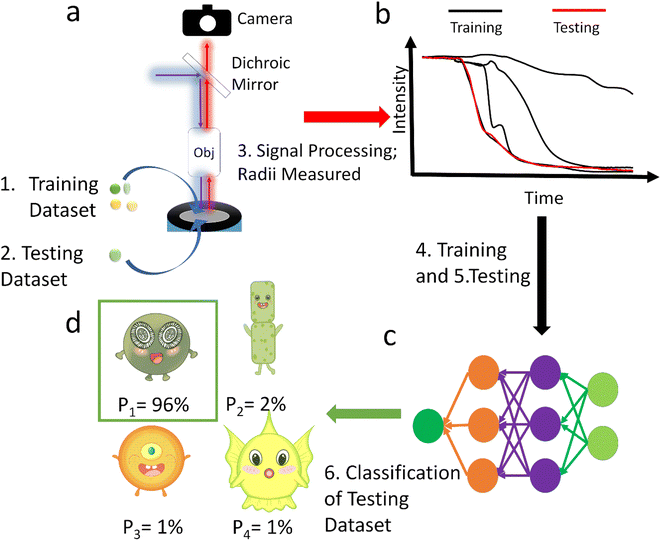
In this paper we analyse the full transient signal for the fluorescence switch-off following the electro-generation of oxidizing species and have trained a neural network to classify 29 strains from ∼2800 sample particles into orders or ecological groups using their fluorescence inhibition transients and size by counting the pixels in the image. The scheme of this method is shown in Fig. 1. To show the superiority of this method, it was benchmarked with the more intuitive method of neural network classification with their images.20,21 Additional benchmarking based on the size and half-life using K-Nearest Neighbour (KNN) method was also performed. Because it was not practical to collect data to train a neural network with every existing species, the neural network tested against unseen species. Thus, it was trained to identify E. huxleyi from other species and tested with unseen E. huxleyi strains and species unseen during training to evidence the neural network's generalization, rather than memorization, of the transients. Moving beyond proof of concept we envisage a global network of fluoro-electrochemical sensors deployed across the ocean employing a robust neural network to realise the possibility of high-throughput and high-granularity phytoplankton classification and monitoring at the global scale.
Results and discussion
Please note that in the following the images are pictures of fluorescence, not darkfield micrographs.Fluoro-electrochemical microscopy of 29 species
To train neural networks to classify phytoplankton using either images or fluorescence transients, 3325 images and 2911 fluorescence transients of 29 phytoplankton strains were collected. The datasets were further split into a training dataset (80%) and a testing dataset (20%), and when training neural networks, 10% of the training dataset was reserved for validation. The 29 strains (see ESI†) belonged to 10 orders or 4 ecological groups (diatoms, coccolithophores, dinoflagellates and isochrysidales) and the orders or eco groups were the targets of classification. As mentioned in the introduction, the species (including E. huxleyi) and groups (including diatoms) are of great interests to oceanographers and full details of the dataset were tabulated in the ESI.† The images were recorded in grey scale, cropped to locate the phytoplankton and then resized to 80 pixels with equal width and height. The fluorescence transients recorded the diminishing fluorescence due to oxidizing radicals as a function of time. Experimental procedures can be found in the ESI.† As different species had their characteristic switch-off time, only transients from 0 to 19 seconds were retained to standardize the dataset. Since the transients were recorded every 0.1 seconds, each transients had 190 datapoints. Fig. 2 and 3 illustrates images and transients of the 29 strains randomly drawn from the dataset. As shown in Fig. 2, even a very experienced oceanographer may find it challenging to classify them based on their shape and morphology. While it may be possible to manually classify phytoplankton using the transients when the number of species is small, such task will become increasingly unpractical with increasing numbers of species under consideration. Thus, we propose classifying phytoplankton using artificial intelligence.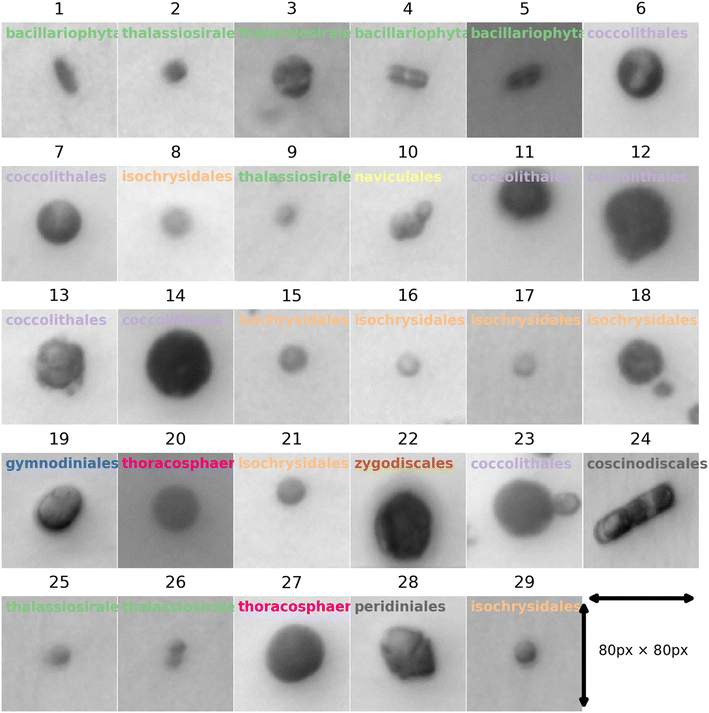 | ||
| Fig. 2 Microscopic images for each of the 29 strains randomly drawn from the dataset of 3325 images. The images were taken at 20 times magnification. The title for each image represents the ID of each strain with the taxonomic order of each strain. The corresponding strain names are shown in Fig. 3. | ||
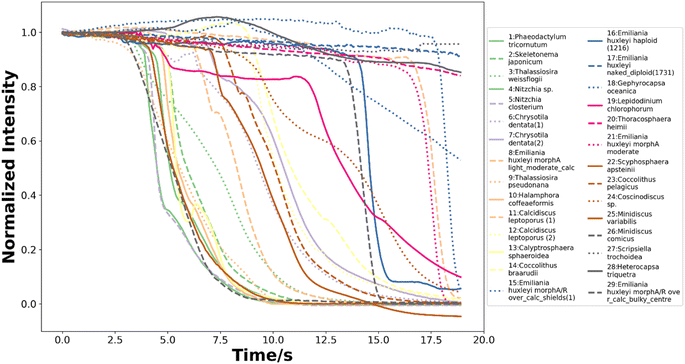 | ||
| Fig. 3 The normalized fluorescence quenching transients of each species from 0 to 19 seconds randomly drawn from the dataset of 2911 transients. | ||
Deep learning with phytoplankton images
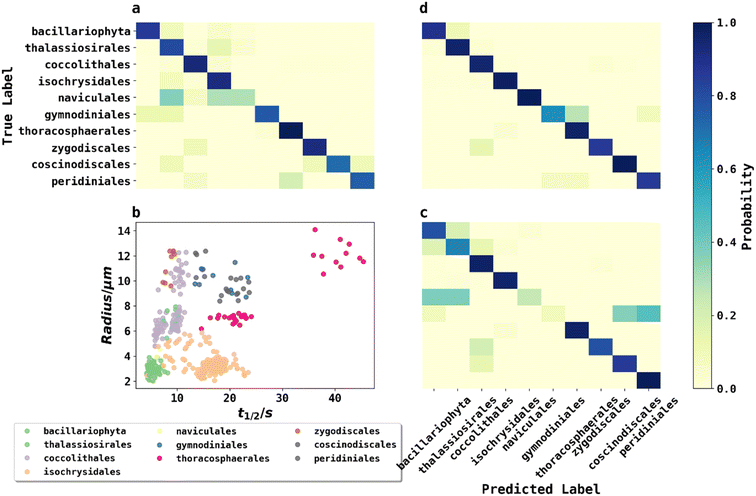
To classify phytoplankton images (Fig. 2) without use of the fluorescence data, we employed transfer learning by fine-tuning the pre-trained ResNet50V2 network to ensure a fair comparison with other methods,22 as transfer learning was considered state-of-the-art by very recent literature for plankton classification because of its significantly higher accuracy than traditional methods.23 ResNet50V2 was trained for 10 epochs for the new output layer followed by fine tuning (learning rate = 10−5) for 50 epochs for the whole model. The model was then evaluated by classifying phytoplankton images to their taxonomic orders on the testing dataset, achieving an accuracy of 86.5%. The confusion matrix of the testing dataset is shown in Fig. 5a. The high but far from perfect accuracy using transfer learning method showed that deep learning with phytoplankton images might only capture their visual differences but failed to understand the underlying physiochemical properties to differentiate between species very similar in appearance. The training history shown in ESI† showed that ResNet50V2 achieved a training accuracy >99% after 30 epochs of fine tuning, but the validation accuracy always stumbled around 84%, suggesting that a complex neural networks like ResNet50V2, were prone to risks of overfitting.KNN classification with phytoplankton half-lives and sizes
A second method for classification used K-Nearest Neighbour (KNN) using merely two data points: fluorescence half-life (t1/2) data along with the plankton radii (r), where t1/2 was the time point when fluorescence intensity of phytoplankton dropped to 50% of its initial value before applying any oxidizing potential.24Fig. 5b plots 500 phytoplankton data randomly drawn from the dataset and grouped by their taxonomic orders illustrated by scatter colours. The scatter plot clearly showed some degree of clustering by these two parameters, hinted that an unknown phytoplankton can be classified by the taxonomies of its closest neighbours in the two-dimensional t1/2 and r domains, which was the principle behind KNN classifications. In KNN classification, the number of neighbours to consider was a hyperparameter and determined to be 7 using a grid search and five-fold cross validation (GridSearchCV) method described in ESI.†Using the best hyperparameters provided by GridSearchCV, a KNN classifier, trained with the training dataset, achieved a training accuracy of 89.0%. The accuracy of testing dataset using KNN classifier was 87.5% and the confusion matrix was shown in Fig. 5c. Using a relatively simple algorithm with only two features, the KNN classifier achieved higher accuracy than transfer learning with a very complex pretrained neural network. The small triumph of the KNN classifier relative to ResNet50V2 was not the triumph of the algorithm, but likely the triumph from the half-life data providing physiochemical insights. For example, phytoplankton with silica or calcite shells were possibly more resilient in an oxidizing environment, and so exhibited a longer half-life. In other words, fluoro-electrochemical microscopy provided critical physiochemical insights unavailable to a normal microscope so that even a very simple algorithm can achieve a high accuracy.
Deep learning with fluoro-electrochemical microscopy transients
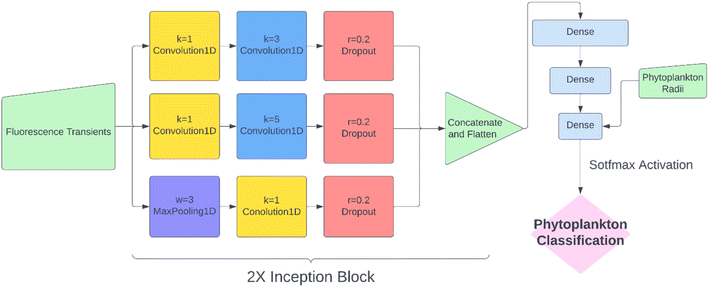
While KNN classification using t1/2 and r proved to be an effective algorithm, there was clearly still room for improvement. Considering that half-life is likely an oversimplification of a whole fluorescence transient, we propose a neural network analysis of the entire fluorescence transient. The radii of phytoplankton were an auxiliary input to allow fair comparison with other models. To adapt the one-dimensional fluorescence time-series and the size data, we designed a simple neural network called “1D Inception” with two Inception blocks25 followed by three fully connected layers. The network is shown in Fig. 4. This network had 11 layers and about 60% of the number of trainable parameters as ResNet50V2. The network was trained with the fluorescence transients such as those shown in Fig. 3 and the radii were added to the new network at a later stage of forward propagation. After 300 epochs of training, the network using fluorescence transients achieved an accuracy of 95.4%, a significant improvement from ∼85% than just using images or features extracted from the transients. More importantly, 1D Inception is significantly more accurate at classifying isochrysidales and naviculales as evidenced by the confusion matrix shown in Fig. 5d. Outperformance of the 1D Inception model was partly due to its efficient design (∼15 million trainable parameters compared with ∼25 million trainable parameters in ResNet50V2), but more importantly due to the extra physiochemical information provided by the fluoro-electrochemical microscopy. Using 1D Inception, the characterization power of the microscopy could be fully unleashed, transforming the proof-of-concept microscopy reported before16 to a highly accurate tool for oceanographers and allowing scientists independent phytoplankton classification into taxonomic orders.Identifying E. huxleyi in the presence of potential interference from previously unseen species
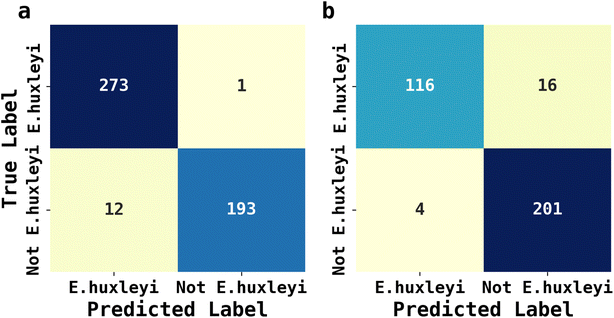
The abundance of ecological diversity of phytoplankton precludes the possibility of building a comprehensive database containing every species of identified phytoplankton. Thus, the AI facilitated phytoplankton classification must be robust when interfered by unseen species and which have not been used for training. To evaluate the applicability of AI facilitated fluoro-electrochemical microscopy, we designed two testing scenarios as described next: both involved identifying unseen E. huxleyi strain from two sets of unseen potentially interfering species. Recalling the importance of E. huxleyi for carbon sequestration,8,9 these scenarios emulated in situ investigations of E. huxleyi abundance in real oceanographical environmental measurements. The unseen interference species names, ecological groups and ID numbers for references in Fig. 2 for the first scenarios were Phaeodactylum tricornutum (diatom, ID = 1), Minidiscus variabilis (diatom, ID = 25) and Scripsiella trochoidea (dinoflagellates, ID = 27). The second scenario was more challenging: the unseen interference species was Gephyrocapsa oceanica (ID = 18), a species very similar to E. huxleyi as they were both calcifying isochrysidales. The unseen E. huxleyi strain withheld for both scenarios was the 8th strain shown in Fig. 2. The rest of the 29 strains were reserved for training the 1D Inception for binary classification of E. huxleyi. After 20 epochs of training, the 1D Inception network was ready to classify unseen strains. The accuracy and F1 score were 97.3% and 96.7% for scenario 1 and 94.1% and 95.3% for scenario 2 and the confusion matrices are shown in Fig. 6. These two scenarios proved the applicability of AI facilitated E. huxleyi quantification in oceanic environment by testing it with unseen species. The high accuracy and F1 score of the second scenario suggested that fluoro-electrochemical microscopy facilitated with AI can correctly differentiate unseen species, even if they are almost visually indifferentiable and taxonomically correlated.Conclusions
We collected and curated ∼3000 phytoplankton samples comprising 29 strains and tested three methods of classifying phytoplankton: using images, half-lives with radii, and fluorescence transients. Table 1 summarizes the machine learning model and dataset used, and from which, a 1D Inception neural network classification of fluoro-electrochemical transients achieved the highest accuracy with a reasonable training time and the discriminating power may be further enhanced considering additional features including the circularity or otherwise phytoplankton cells. In addition, this method mostly correctly identified unseen E. huxleyi strains from unseen interference species, which proved that the neural network generalized the transients instead of memorizing them. The synergy of 1D Inception neural network with fluoro-electrochemical microscopy enabled systematic interpretation of experimental results and highly granular classification of phytoplankton. We expect this method to revolutionize the field of phytoplankton classification in the natural environment to enhance understanding of phytoplankton distribution and growth under future climate change and may enhance the possibility of the early prediction of algal bloom.| Method | Dataset | Training time | Accuracy |
|---|---|---|---|
| Imaging classification using transfer learning with pretrained ResNet50V2 | Phytoplankton images | 4.5 min | 86.5% |
| KNN classification with grid search and cross validation | Phytoplankton half-lives and radii | <10 second | 87.5% |
| Transient classification using 1D Inception neural network | Phytoplankton fluorescence transients and radii | 3.0 min | 95.4% |
Data availability
The data that support the finding of this study are available from the corresponding author upon reasonable request.Author contributions
HC performed all machine learning jobs, visualizations and writing the original manuscript. SB performed all experiments and data curation. SB, MY, REMR, HAB and RGC reviewed and edited the manuscript. REMR, HAB and RGC were also responsible for project administration, supervision and obtaining fundings. In addition, RGC was responsible for conceptualization.Conflicts of interest
The authors declare no conflict of interests.Acknowledgements
This work was carried out with the support of the Oxford Martin School Programme on Monitoring Ocean Ecosystems. HC thanks Lady Margaret Hall for a 2022/2023 graduate scholarship. HC thanks Dr Enno Kätelhön for his suggestions regarding AI algorithms.References
- C. B. Field, M. J. Behrenfeld, J. T. Randerson and P. Falkowski, Science, 1998, 281, 237–240 CrossRef CAS PubMed.
- P. G. Falkowski, E. A. Laws, R. T. Barber and J. W. Murray, in Ocean Biogeochemistry: The Role of the Ocean Carbon Cycle in Global Change, ed. M. J. R. Fasham, Springer Berlin Heidelberg, Berlin, Heidelberg, 2003, pp. 99–121, DOI: DOI:10.1007/978-3-642-55844-3_5.
- J. J. Pierella Karlusich, F. M. Ibarbalz and C. Bowler, Annu. Rev. Mar. Science, 2020, 12, 233–265 CrossRef.
- C. S. Reynolds, The Ecology of Phytoplankton, Cambridge University Press, 2006 Search PubMed.
- C. de Vargas, S. Audic, N. Henry, J. Decelle, F. Mahé, R. Logares, E. Lara, C. Berney, N. Le Bescot, I. Probert, M. Carmichael, J. Poulain, S. Romac, S. Colin, J.-M. Aury, L. Bittner, S. Chaffron, M. Dunthorn, S. Engelen, O. Flegontova, L. Guidi, A. Horák, O. Jaillon, G. Lima-Mendez, J. Lukeš, S. Malviya, R. Morard, M. Mulot, E. Scalco, R. Siano, F. Vincent, A. Zingone, C. Dimier, M. Picheral, S. Searson, S. Kandels-Lewis, S. G. Acinas, P. Bork, C. Bowler, G. Gorsky, N. Grimsley, P. Hingamp, D. Iudicone, F. Not, H. Ogata, S. Pesant, J. Raes, M. E. Sieracki, S. Speich, L. Stemmann, S. Sunagawa, J. Weissenbach, P. Wincker, E. Karsenti, E. Boss, M. Follows, L. Karp-Boss, U. Krzic, E. G. Reynaud, C. Sardet, M. B. Sullivan and D. Velayoudon, Science, 2015, 348, 1261605 CrossRef PubMed.
- D. G. Boyce, M. R. Lewis and B. Worm, Nature, 2010, 466, 591–596 CrossRef CAS PubMed.
- W. W. Gregg and C. S. Rousseaux, Environ. Res. Lett., 2019, 14, 124011 CrossRef CAS.
- P. Tréguer and P. Pondaven, Nature, 2000, 406, 358–359 CrossRef PubMed.
- B. M. Jones, R. J. Edwards, P. J. Skipp, C. D. O'Connor and M. D. Iglesias-Rodriguez, Mar. Biotechnol., 2011, 13, 496–504 CrossRef CAS PubMed.
- L. Bopp, O. Aumont, P. Cadule, S. Alvain and M. Gehlen, Geophys. Res. Lett., 2005, 32, L19606 CrossRef.
- U. Riebesell, I. Zondervan, B. Rost, P. D. Tortell, R. E. Zeebe and F. M. Morel, Nature, 2000, 407, 364–367 CrossRef CAS PubMed.
- M. Winder and U. Sommer, Hydrobiologia, 2012, 698, 5–16 CrossRef.
- I. Joint and S. B. Groom, J. Exp. Mar. Biol. Ecol., 2000, 250, 233–255 CrossRef CAS PubMed.
- C. B. Mouw, N. J. Hardman-Mountford, S. Alvain, A. Bracher, R. J. W. Brewin, A. Bricaud, A. M. Ciotti, E. Devred, A. Fujiwara, T. Hirata, T. Hirawake, T. S. Kostadinov, S. Roy and J. Uitz, Front. Mar. Sci., 2017, 4, 41 Search PubMed.
- V. Dashkova, D. Malashenkov, N. Poulton, I. Vorobjev and N. S. Barteneva, Methods, 2017, 112, 188–200 CrossRef CAS PubMed.
- M. Yang, C. Batchelor-McAuley, L. Chen, Y. Guo, Q. Zhang, R. E. M. Rickaby, H. A. Bouman and R. G. Compton, Chem. Sci., 2019, 10, 7988–7993 RSC.
- J. Yu, M. Yang, C. Batchelor-McAuley, S. Barton, R. E. M. Rickaby, H. A. Bouman and R. G. Compton, ACS Meas. Sci. Au, 2022, 2, 342–350 CrossRef CAS PubMed.
- J. Yu, M. Yang, C. Batchelor-McAuley, S. Barton, R. E. M. Rickaby, H. A. Bouman and R. G. Compton, Cell Rep. Phys. Sci., 2023, 101223, DOI:10.1016/j.xcrp.2022.101223.
- A. Sournia, M.-J. Chrdtiennot-Dinet and M. Ricard, J. Plankton Res., 1991, 13, 1093–1099 CrossRef.
- O. Py, H. Hong and S. Zhongzhi, Plankton classification with deep convolutional neural networks, 2016, IEEE Information Technology, Networking, Electronic and Automation Control Conference, 2016, pp. 132–136, https://ieeexplore.ieee.org/abstract/document/7560334/authors#authors Search PubMed.
- J. Y. Luo, J. O. Irisson, B. Graham, C. Guigand, A. Sarafraz, C. Mader and R. K. Cowen, Limnol. Oceanogr. Methods, 2018, 16, 814–827 CrossRef.
- K. He, X. Zhang, S. Ren and J. Sun, Deep Residual Learning for Image Recognition, Proceedings of the IEEE Conference on Computer Vision and Pattern Recognition (CVPR), 2016, pp. 770–778 Search PubMed.
- M. Yang, W. Wang, Q. Gao, C. Zhao, C. Li, X. Yang, J. Li, X. Li, J. Cui, L. Zhang, Y. Ji and S. Geng, Environ. Sci. Pollut. Res., 2023, 30(6), 15311–15324 CrossRef PubMed.
- S. Barton, M. Yang, H. Chen, C. Batchelor-McAuley, R. G. Compton, H. A. Bouman and R. E. M. Rickaby, EarthRxiv, 2023, preprint, DOI:10.31223/X5KD3Z.
- C. Szegedy, W. Liu, Y. Jia, P. Sermanet, S. Reed, D. Anguelov, D. Erhan, V. Vanhoucke and A. Rabinovich, Going Deeper With Convolutions, Proceedings of the IEEE Conference on Computer Vision and Pattern Recognition (CVPR), 2015, pp. 1–9 Search PubMed.
Footnotes |
| † Electronic supplementary information (ESI) available. See DOI: https://doi.org/10.1039/d3sc01741a |
| ‡ These authors contributed equally to this work. |
| This journal is © The Royal Society of Chemistry 2023 |

