 Open Access Article
Influence of core size on self-assembled molecular networks composed of C3h-symmetric building blocks through hydrogen bonding interactions: structural features and chirality†
Matsuhiro Maedaa,
Kotoka Odaa,
Ichiro Hisaki b and
Kazukuni Tahara
 *a
*a
aDepartment of Applied Chemistry, School of Science and Technology, Meiji University, 1-1-1 Higashimita, Tama-ku, Kawasaki, 214-8571, Japan. E-mail: tahara@meiji.ac.jp
bDivision of Chemistry, Graduate School of Engineering Science, Osaka University, 1-3 Machikaneyama, Toyonaka, Osaka 560-8531, Japan
First published on 10th October 2023
Abstract
The effect of the core size on the structure and chirality of self-assembled molecular networks was investigated using two aromatic carboxylic acid derivatives with frameworks displaying C3h symmetry, triphenylene derivative H3TTCA and dehydrobenzo[12]annulene (DBA) derivative DBACOOH, each having three carboxy groups per molecule. Scanning tunneling microscopy observations at the 1-heptanoic acid/graphite interface revealed H3TTCA exclusively forming a chiral honeycomb structure, and DBACOOH forming three structures (type I, II, and III structures) depending on its concentration and whether the system is subjected to annealing treatment. Hydrogen bonding interaction patterns and chirality were carefully analyzed based on a modeling study using molecular mechanics simulations. Moreover, DBACOOH forms chiral honeycomb structures through the co-adsorption of guest molecules. Structural diversity observed for DBACOOH is attributed to its relatively large core size, with this feature modulating the balance between molecule–molecule and molecule–substrate interactions.
Introduction
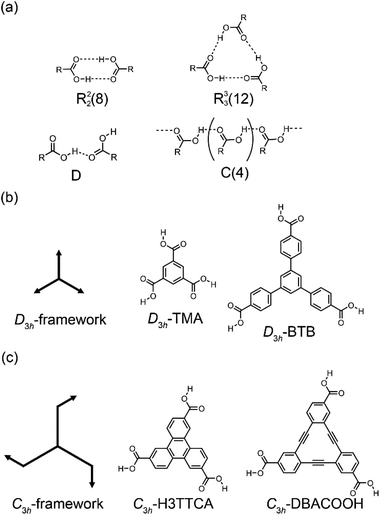
Structural control over self-assembled molecular networks (SAMNs) spontaneously formed by organic molecules on solid surfaces in ultrahigh vacuum (UHV) conditions and at liquid/solid interfaces through non-covalent interactions is of interest owing to corresponding potential applications in nanotechnology.1–4 In particular, supramolecular chirality of SAMNs is a subject of keen interest in relation to the development of chiral sensors and catalysts through chiral molecular recognition on SAMNs.5–7 In structural designs of SAMNs, various non-covalent interactions such as van der Waals,8 hydrogen bonding,9 coordination bonding,10,11 and halogen bonding interactions have been employed.12 Of them, the hydrogen bonding interaction is the most widely used for the construction of SAMNs because of its strength and directionality.9 Scanning tunneling microscopy (STM) is a useful tool for characterizing SAMNs with a submolecular resolution both at surfaces in UHV conditions and at the liquid/solid interfaces.13,14Dimeric pairs of aromatic carboxylic acids formed each by complementary hydrogen bonding interactions between the carboxy groups have been extensively used in the design of molecular packing structures in three-dimensional (3D) space because of their directionality and selectivity (Fig. 1(a)).15–17 This hydrogen bonding interaction can also be used in two-dimensional space to construct SAMNs on surfaces both in UHV and interfacial conditions.18 Many such investigations have been performed in particular under ambient interfacial conditions.18–20 Trigonal aromatic molecules having each three carboxy groups are ideal molecular building blocks for constructing porous SAMNs displaying hexagonal periodicity.21 Lackinger and coworkers reported systematic studies on structural control of SAMNs at the liquid/solid interfaces using trimesic acid (TMA) and 1,3,5-benzenetribenzoic acid (BTB), which are aromatic carboxylic acid derivatives having molecular frameworks displaying D3h symmetry (and have substitutions at the 1,3,5-positions of the central benzene rings, Fig. 1(b)).22–25 TMA is the smallest such molecule that forms honeycomb (chicken-wire) and flower structures at the liquid/graphite interfaces, depending on its concentration and the identity of the solvent.20,23 In the honeycomb structure, the TMA molecules are connected by complementary-type (R22(8)) hydrogen bonding interactions between the two carboxy groups, whereas in the flower structure, the TMA molecules are connected by both complementary-type (R22(8)) and cyclic-type (R33(12)) hydrogen bonding interactions, with the cyclic-type interaction formed by three carboxy groups (Fig. 1(a)). The size of the aromatic core has impacts on SAMN formation.20 BTB is a larger molecule having a framework displaying D3h symmetry, and in which the 1,3,5-position hydrogens of the central benzene ring are substituted with 4-carboxyphenyl groups (Fig. 1(b)); the molecule forms a porous honeycomb as well as oblique structures, and a non-porous close-packed structure at the liquid/graphite interfaces.20,25 In the oblique structure, a hydrogen bonding interaction between the carboxy group and a hydrogen atom of the benzene ring would be formed in addition to the complementary-type (R22(8)) hydrogen bonding interactions between the carboxy groups (Fig. 1(a)). Moreover, large molecules based on a TMA motif also produce various porous SAMNs.26–32 In some of these SAMNs, guest molecules fit into the pores are co-adsorbed.27,29 Moreover, a non-porous SAMN sometimes shows a structural rearrangement in response to the addition of guest molecules through co-adsorption.33 Recent work has focused on the adaptability of these SAMNs to external stimuli such as heat,34 to an external electric field,35–37 and to a combination of these stimuli and additives.33,38–41 Nevertheless, despite the many studies on TMA and its expanded motifs displaying D3h symmetry, only a few studies have been reported on SAMNs having molecular frameworks displaying C3h symmetry.42–44 The SAMN formation and guest co-adsorption of the simplest molecule having a molecular framework displaying C3h symmetry, namely triphenylene-2,6,10-tricarboxylic acid (H3TTCA), have been reported (Fig. 1(c)).43,44 However, to the best of our knowledge, there has to date never been reported a study on the effect of core size on the formation of SAMNs using a planar molecule having the molecular framework displaying C3h symmetry. Understanding the effect of symmetry group reduction and size modulation of the molecular building blocks on the formation of SAMNs is important for the establishment of 2D crystal engineering (Fig. 1(a) and (c)).
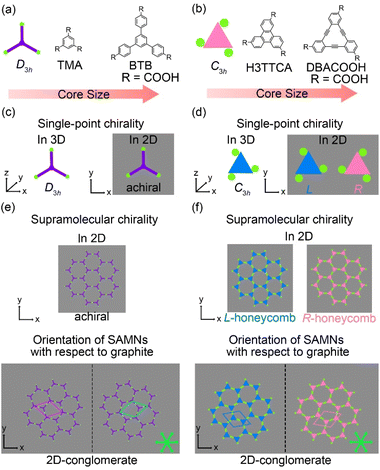
Adsorption of organic molecules onto a surface often generates single-point molecular chirality even for achiral molecules in 3D space because of symmetry group reduction.45–48 The aromatic carboxylic acid derivatives having molecular frameworks displaying D3h symmetry would remain achiral on the surface at the single-molecule level (Fig. 2(a) and (c)). Here the orientation of the carboxy groups on a surface is ignored because it does not influence complementary hydrogen bonding interactions between the carboxy groups (R22(8) and R33(12)) (Fig. 1(a) and 2). While the molecules displaying D3h symmetry are achiral at the single-molecule level, their SAMNs sometimes adopt one of the chiral plane groups (P1, P2, P3, P4, and P6).49 For instance, the domains of the honeycomb structures of TMA and BTB are chiral, and this supramolecular chirality is distinguished only by the domain orientations with respect to the graphite lattice underneath (Fig. 2(e)). Specifically, the supramolecular chirality is determined by the sign (positive or negative) of α angle between the unit cell vector of the honeycomb structure and the nearest normal to the main symmetry axes of graphite (Fig. 2(e)). On the other hand, the achiral aromatic carboxylic acid derivatives having molecular frameworks displaying C3h symmetry (Fig. 1(c) and 2(b)) show single-point molecular chirality on the surface. We defined this single-point chirality as an R-type or L-type (Fig. 2(d)). The chiral R- or L-type molecule appears with equal probability on the surface. Assembling such a racemic mixture on a surface can lead to two outcomes: the formation of separate domains of homochiral structures (2D-conglomerate) or the formation of an achiral structure composed of equal amounts of both chiral molecules in the domain (2D-racemate).50,51 The supramolecular chirality of the domains in 2D-conglomerates could be distinguished by the orientation of each molecule (R- or L-type) as well as the relative orientation of the domains with respect to the substrate lattice (Fig. 2(f)). These SAMNs display one of the chiral 2D plane groups. In the case of the 2D-racemates, the SAMNs can display the chiral as well as achiral plane groups.50,51 When the 2D-racemate displays one of the chiral plane groups, the domain handedness is defined by its relative orientation with respect to the substrate lattice. Even for the simplest case of a molecule having the molecular framework displaying C3h symmetry, a detailed analysis of the chirality of the SAMNs has, to the best of our knowledge, not yet been reported (Fig. 1(c)).42–44 Therefore, addressing supramolecular chirality aspects of these SAMNs is also an intriguing subject.49
In this context, we herein investigated the effect of the core size on the structure and chirality of SAMNs using two aromatic carboxylic acids having frameworks displaying C3h symmetry, namely H3TTCA and dehydrobenzo[12]annulene (DBA) derivative DBACOOH, each having three carboxy groups per molecule, at the 1-heptanoic acid (1-HA)/graphite interfaces. STM observations revealed an exclusive formation of a chiral honeycomb structure by H3TTCA, while DBACOOH shows structural polymorphism, with the structure formed depending on its solute concentration and whether the system is subjected to annealing treatment. DBACOOH was found to form three types of structures, denoted here as type I, II, and III structures. The structural diversity observed for DBACOOH is attributed to its relatively large core size, a feature modulating the balance between molecule–molecule and molecule–substrate interactions. We also investigated guest co-adsorption in the SAMNs of DBACOOH. Chiral honeycomb structures are formed upon the addition of the guest molecule, coronene or phthalocyanine (Fig. 3 and S1†). The guest co-adsorption is essential for the formation of the honeycomb structures by DBACOOH.
Results and discussion
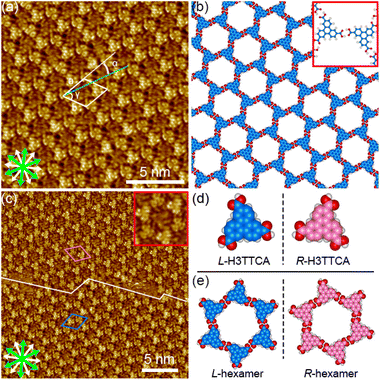
The synthesis of H3TTCA and DBACOOH was reported elsewhere.52,53 1-HA was used as a solvent for the preparation of sample solutions. To investigate the dependence of the structure on solute concentration, the solute concentrations from 1.0 × 10⁻⁶ to 1.5 × 10⁻⁴ M were tested. The sample solution (15 or 40 μL, the latter for annealing treatment) was poured into a liquid cell placed on a freshly cleaved surface of a highly oriented pyrolytic graphite to prepare SAMNs at the interface. In order to anneal a sample, the cell containing the sample was heated at 80 °C in a sealed oven for 3 h and then allowed to cool to room temperature. All STM observations of the SAMNs were then conducted at the 1-HA/graphite interfaces at room temperature.The H3TTCA molecules were observed to exclusively form a honeycomb structure at the 1-HA/graphite interface at all solute concentrations (Fig. 4 and S2†). Since π-conjugated cores were observed as bright features in STM images because of their higher tunneling efficiency,54,55 bright triangles composed of three small doughnut-like features were assigned to the π-conjugated cores of H3TTCA. The honeycomb structure consists of the H3TTCA molecules with two different orientations of 60° (Fig. S3†). In the STM images, short rod-like features were observed at the periphery of the hexagonal pore, and these were attributed to co-adsorbed 1-HA molecules. The unit cell parameters of the honeycomb structure were measured to be a = b = 2.3 ± 0.1 nm and γ = 60.1 ± 0.4° (Fig. 4(a)), values consistent with those in the previous reports.43,44 The honeycomb structure adopts the chiral P6 symmetry group. The distance between the centers of the benzene rings of adjacent H3TTCA molecules was measured to be 0.8 ± 0.1 nm. Based on the unit cell parameters and this intermolecular distance, the network models were optimized using molecular mechanics (MM) simulation (COMPASS force field). In the optimized model, shown in Fig. 4(b), the O⋯H distance in the dimeric pair of carboxy groups between adjacent H3TTCA molecules is 0.175 nm,56,57 supporting the formation of complementary-type hydrogen bonding interactions (R22(8)). The honeycomb structure consists of only one enantiomer (R or L-H3TTCA, Fig. 4(d) and (e)), thus indicating the honeycomb structure to be chiral (R or L). This chirality is identical throughout the domains. The two enantiomorphic R and L domains were identified by the negative and positive signs of the value of the α angle between the short unit cell vector a and the one nearest to normal to the main symmetry axes of graphite. The |α| average angle value was determined to be 12 ± 1° (Fig. 4(c) and S4†). Both enantiomorphous domains appear with equal probability, confirming formation of a 2D-conglomerate (Fig. S4†).
Next, we investigated the SAMNs of DBACOOH at the 1-HA/graphite interface. DBACOOH forms three different SAMNs depending on its concentration and whether annealing is carried out (Fig. S5†). At solute concentrations from 1.0 × 10⁻⁶ to 1.0 × 10⁻⁵ M, type I and II structures were observed (Fig. 5 and 6). After an annealing treatment, at the same concentration range, a type III structure is formed (Fig. 7). At a solute concentration of 1.5 × 10⁻⁴ M, and regardless of whether an annealing treatment is applied, DBACOOH forms a non-periodic structure (Fig. S6†) in which the DBACOOH molecules adopting various orientations are packed densely on the surface.
In the type I structure, hexagonal and rectangular pores were observed to be arranged in a periodic manner (Fig. 5(b) and (c)). In these pores, we observed dim rod-like features (Fig. 5(c)), attributed to co-adsorbed 1-HA molecules. The unit cell parameters for the type I structure were measured to be a = b = 5.12 ± 0.06 nm and γ = 59.9 ± 0.4°. And the chiral P6 group was identified to be the plane group of the type I structure, when two DBA molecules located between the cyclic hexamers are not regarded as asymmetry units. In this type I structure, eight structurally distinct DBACOOH molecules were identified in the unit cell: six of them arranged in a hexamer and two located between hexamers. The distance between the centers of nearest benzene rings of adjacent DBACOOH molecules located at the vertices of a hexagonal pore was measured to be 0.70 ± 0.04 nm (red arrow in Fig. 5(c)). And for each of the two non-hexamer DBACOOH molecules, the distance between either DBACOOH molecule and the nearest DBACOOH molecule in the hexamer—specifically the distance between the centers of the nearest benzene rings—happened to be about the same, namely 0.9 ± 0.1 nm, despite their geometries being structurally inequivalent (blue and green arrows in Fig. 5(c)). The difference in the intermolecular distances between that within the hexamer and that between the hexamer and outside the hexamer suggested two different hydrogen bonding interaction modes. Accordingly, a network model was carefully constructed using MM simulation based on the unit cell parameters and these intermolecular distances (Fig. 5(b)). The hexagonal pore consisting, as described above, of the molecules having two different orientations of 60° suggests the formation of a homochiral L or R hexamer (Fig. 2(f)). To assess the chirality of remaining DBACOOH molecules located in between the hexamers, we modeled three possible molecular arrangements: (1) one having the same chirality of the molecules in the hexamer (Fig. S7(a)†), and (2) the other two molecules having the opposite chirality (Fig. S7(b) and (c)†). The network model consisting of the same chiral orientation nicely matches the experimental results. While the orientation of the carboxy groups could not be determined from the STM images, we considered that, to maximize the number of hydrogen bonding interactions, the DBA molecules in the hexamer adopt a Cs symmetry group with a different orientation for one of the three carboxy groups. The MM simulation yields two mean intermolecular O⋯H distances, namely 0.172 and 0.188 nm, for the two different types (R22(8) and D types) of hydrogen bonding interactions between the carboxy groups (Fig. 5(d) and (e)).56,57 Moreover, in the D type interaction, there is a weak hydrogen bonding interaction between a hydrogen atom of the benzene ring and an oxygen atom of the carboxy group (0.249 nm) (Fig. 5(d) and (e)).56,58 Further details on the network modeling are described in ESI (Fig. S7†). The type I structure was observed to be chiral throughout the domains, and this chirality could be differentiated by the sign (positive or negative) of the α angle value (R or L). An |α| average angle value of 27.5 ± 0.6° was measured (Fig. S8†). Both chiral domains appear with equal probability and thus the type I structure is regarded as a 2D-conglomerate.
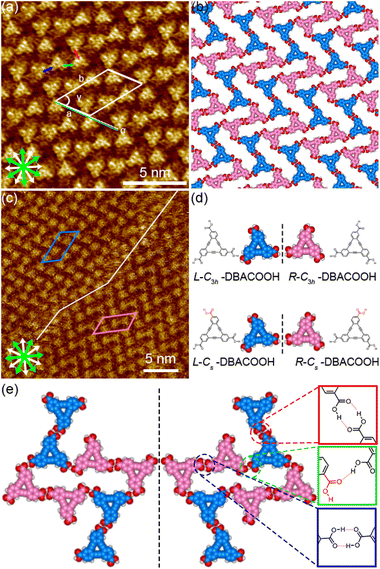
The type II structure was observed to contain a narrow rectangular pore, and to be composed of four independent DBACOOH molecules with different orientations. Our results indicated unit cell parameters of a = 2.8 ± 0.1 nm, b = 4.9 ± 0.1 nm, and γ = 54 ± 1° and a chiral P2 plane group for the type II structure. The distances between the benzene rings of the adjacent independent DBACOOH molecules were measured to be 0.8 ± 0.1 nm, 0.9 ± 0.1 nm, and 0.7 ± 0.1 nm, respectively (red, green, and blue arrows in Fig. 6(a)). A network model optimized by carrying out an MM simulation based on the unit cell parameters and these intermolecular distances are shown in Fig. 6(b).
Of the three possible network structures with a different combination of homo- or heterochiral molecular orientations—namely the homochiral (R,R,R,R or L,L,L,L) structure and heterochiral (R,R,L,L or L,L,R,R) and (R,R,R,L or L,L,L,R) structures (Fig. S9†)—the heterochiral (R,R,L,L or L,L,R,R) structure was found to be the one in good agreement with the π-core positions in the STM images (Fig. 6(d) and (e)). We assumed in the MM model the formation of a maximum number of intermolecular hydrogen bonding interactions between the carboxy groups (see ESI†). The four inequivalent DBACOOH molecules (R-C3h, R-Cs, L-C3h and L-Cs symmetry) are connected through the two types (R22(8) and D types, Fig. 6(e)) of hydrogen bonding interactions with the two mean O⋯H distances of 0.172 nm and 0.179 nm.56,57 Despite the type II structure containing equal numbers of the chiral R and L molecules, domains having two different orientations with respect to the graphite lattice underneath were identified. This handedness was again determined by the sign of the α angle (+ or − for R or L). The |α| average angle value was measured to be 0.2 ± 0.3° (Fig. 6 and S10†). Both enantiomorphous domains appear with equal probability.
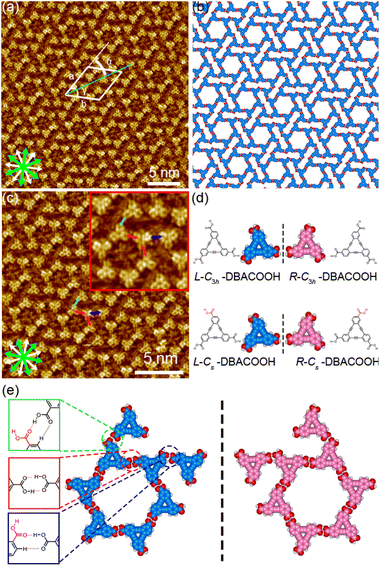
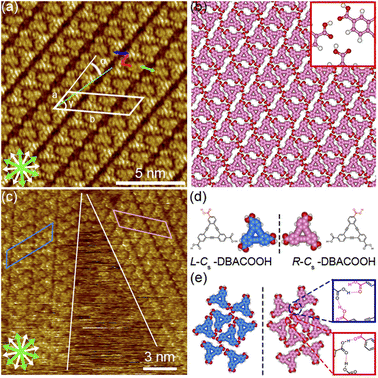
The type III structure appears exclusively after annealing treatment using the sample solutions at concentrations from 3.0 × 10⁻⁶ to 1.0 × 10⁻⁵ M (Fig. 7(a)). The structural change indicates the type III structure to be a thermodynamically favored phase relative to the type I and II structures. In the type III structure, the DBACOOH molecules were observed to be densely arranged in a linear fashion. Our results showed unit cell parameters of a = 1.5 ± 0.1 nm, b = 4.5 ± 0.1 nm, and γ = 70 ± 1° and the chiral P2 symmetry group for this type III structure. The distances between the benzene rings of the adjacent independent DBACOOH molecules were measured to be 0.7 ± 0.1 nm, 0.9 ± 0.1 nm, and 0.8 ± 0.1 nm, respectively (red, green, and blue arrows in Fig. 7(a)). Two possible structures, a homochiral alignment consisting of the molecules with the R- or L-orientation and a heterochiral alignment consisting of the molecules with both R- and L-orientations, were modeled (Fig. S11†). The homochiral alignment optimized by performing an MM simulation was found to nicely match the positions of each triangular π-core of DBACOOH in the STM image (Fig. 7(b)). In the MM model, there is one type of hydrogen bonding interaction (D type) between the carboxy groups (Fig. 7(d) and (e)), with a mean O⋯H distance of 0.173 nm.56,57 The supramolecular chirality of the type III structure was also determined by the sign (positive or negative) of the α angle (R or L, Fig. 7(c)), with the|α| average angle value measured to be 13 ± 1° (Fig. S12†). As both chiral domains appear with equal probability, the type III structure is concluded to be a 2D-conglomerate.
Structural rearrangement of H3TTCA SAMNs upon addition of guest molecules such as phthalocyanine and coronene has been reported.43,44 In this context, we investigated the effect of these guest molecules on the SAMN formation of DBACOOH.
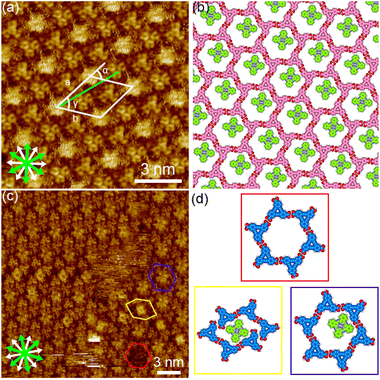
First phthalocyanine, with its large square π-core, was tested (Fig. 3(a) and S1†). We tested various pre-mixed solutions of DBACOOH and phthalocyanine with different guest/host (G/H) molar ratios but in which the concentration of DBACOOH was kept constant at 1.0 × 10⁻⁵ M. Extended domains of the honeycomb structure were observed at exclusively a G/H ratio of 5/1 (Fig. 8(a) and S13†). Inspection of the STM image of this SAMN showed fuzzy bright circular features at the hexagonal pores. We attributed these bright features to co-adsorbed phthalocyanine molecules (Fig. 8(c) and (d)). The fuzzy appearance is attributed to the lateral mobility of the guest molecules at the pore. Also, distorted hexagonal pores were observed at the domain borders, and a square bright feature was occasionally observed in these distorted pores (Fig. 8(c) and (d)). This square appearance is attributed to size complementarity between the guest molecule and distorted pore. Unit cell parameters for this honeycomb structure (P6 group) were measured to be a = b = 2.91 ± 0.07 nm and γ = 60.1 ± 0.4°. A corresponding molecular model optimized by performing an MM simulation based on experimental data is shown in Fig. 8(b). This optimization shows the DBACOOH molecules adopting two orientations with a difference of 60°, suggesting the formation of a homochiral hexamer. The complementary hydrogen bonding interactions of the R22(8) type between the carboxy groups sustain the cyclic hexamer (Fig. 8(b)). An O⋯H distance of 0.173 nm is in the MM model. The formation of L versus R supramolecular chirality was discerned by noting the sign (positive or negative) of the α angle. In the current work on DBACOOH with phthalocyanine, the |α| average angle value was measured to be 17 ± 1° (Fig. S14†). This result is indicative of the honeycomb structure being a 2D-conglomerate. The two-component honeycomb structure was transformed into a type III structure over the activation barrier for the structural rearrangement upon annealing (Fig. S13†). This result implied the two-component honeycomb structure to be a kinetically trapped phase.
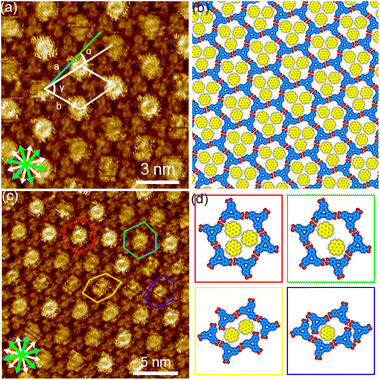
Next, coronene with its D6h symmetry was tested as a guest molecule (Fig. 3(b) and S1†). Note the symmetry of this molecule fitting that of the pore, but its size being smaller than that of the pore. Extended domains of the honeycomb structure were observed at exclusively a G/H ratio of 10/1 (Fig. 9(a) and S15†). Fuzzy features with different levels of brightness were observed at the pore, indicating the co-adsorption of coronene molecules (Fig. 9(c) and (d)). The diameter of the brightest feature in the pore was measured to be 1.9 ± 0.1 nm, a value corresponding to twice the coronene diameter. Therefore, these features were attributed to two or three co-adsorbed coronene molecules. Lackinger and coworkers attributed the different levels of brightness of the co-adsorbed coronene molecules in the honeycomb structures of TMA and BTB to different numbers of co-adsorbed coronene molecules59 and/or to lateral mobility of the guest molecules in the pore.60 The coronene molecules with lateral dynamics in the pore would reflect their appearance in the STM images. Moreover, fuzzy oval features were observed in the distorted hexagonal pores at the domain boundaries (Fig. 9(c) and (d)). Lengths of 1.8 ± 0.1 nm and 1.1 ± 0.1 nm were measured for, respectively, the long and short sides of the fuzzy oval features, indicating these features to be two co-adsorbed coronene molecules. Our measurements indicated unit cell parameters of a = b = 2.91 ± 0.08 nm and γ = 60.1 ± 0.6° for this honeycomb structure. An MM-optimized network model based on the above result is shown in Fig. 9(b). Moreover, the two-component honeycomb structure was also found to be chiral, and its handedness to be determined by the sign (positive or negative) of the α angle (R or L). The |α| average angle value was measured to be 17 ± 1° (Fig. S16†). This two-component honeycomb structure also transformed into the type III structure through desorption of the guest molecules upon annealing (Fig. S15†). This two-component honeycomb structure was also concluded to be a kinetically trapped phase.
H3TTCA forms only the chiral honeycomb structure, regardless of the solute concentration, and does so as a 2D-conglomerate. In contrast, DBACOOH shows structural polymorphism, with the four structures depending on solute concentration, whether the system is subjected to annealing, and the presence of the guest molecules. The type I and III structures as well as the two-component honeycomb structures are 2D-conglomerates. The type II structure is a 2D-racemate in terms of the composition of the L and R-molecules within the domain, while the domains show two chiral orientations.
We considered the difference in absorbance abilities of H3TTCA and DBACOOH to be a possible explanation for the structural polymorphism observed for DBACOOH but not for H3TTCA. Table 1 summarizes the total energies per unit area (Etotal) estimated by MM calculations. These calculations indicated the Etotal value of the honeycomb structure of H3TTCA to be lower than that of DBACOOH. This result is consistent with the STM observation, which indicates that the H3TTCA molecules form the honeycomb structure while the DBACOOH molecules do not. This is due to a lower molecular density on the surface for DBACOOH. Next, the relative stabilities of the type I, II, and III structures of DBACOOH are compared. This comparison shows a small difference in the Etotal values between the type I and II structures. And on the other hand, the calculations showed a highly negative Etotal value for the type III structure. This difference between the type III structure and the other structures is attributed to the type III structure having the highest surface molecular density. Again, the highly negative Etotal value for the type III agrees with the experimental observations. The calculations showed roughly comparable contributions of Emol–sub and Emol–mol to Etotal for H3TTCA, but much greater contributions of the Emol–sub values than of the Emol–mol values to Etotal for DBACOOH. We considered that the enlargement of the core, upon switching from H3TTCA to DBACOOH, altered the balance of these interactions resulting in the formation of various, yet high-density phases for DBACOOH.
| Compound | Structure | Na | Molecular density (nm−2) | Etotalb (kcal mol−1 nm−2) | Emol–molc (kcal mol−1 nm−2) | Emol–subd (kcal mol−1 nm−2) |
|---|---|---|---|---|---|---|
| a Number of the indicates molecules per unit cell.b Non-bonding interaction energy of the whole system including the substrate (bilayered graphene sheets).c Non-bonding interaction energy obtained from a single-point energy calculation of the molecules without the substrate.d Non-bonding interaction energy between the molecules and substrate, calculated using the equation Emol–sub = Etotal − Emol–mol.e A honeycomb structure of DBACOOH is a hypothetical model construed for a comparison. | ||||||
| H3TTCA | Honeycomb | 2 | 0.38 | −30.8 | −12.1 | −18.6 |
| DBACOOH | Honeycombe | 2 | 0.27 | −17.5 | −1.5 | −15.9 |
| DBACOOH | Type I | 8 | 0.35 | −21.6 | −0.8 | −20.8 |
| DBACOOH | Type II | 4 | 0.39 | −23.0 | 0.2 | −23.2 |
| DBACOOH | Type III | 4 | 0.56 | −39.9 | −2.6 | −37.3 |
Next, we estimated the interaction energies for the host–guest systems of DBACOOH from the results of MM simulations (Table 2). The Etotal values of the honeycomb structures with one co-adsorbed phthalocyanine molecule per pore and three co-adsorbed coronene molecules per pore were calculated to be lower than those of the type I and II structures, consistent with the experimental observations. The calculations indicated a lower Etotal value for the type III structure than for the honeycomb structure with coronene, results agreeing with the favorable formation of the type III structure upon annealing. The Etotal values for the honeycomb structure with phthalocyanine and the type III structure are essentially identical. The formation of the type III structure upon annealing would relate to the factors that were not considered in the MM simulations, such as solvation and wetting energies.
| Structure | Guest molecule | Etotal (kcal mol−1 nm−2) | Ehosta (kcal mol−1 nm−2) | Eguestb (kcal mol−1 nm−2) | Ehost–guestc (kcal mol−1 nm−2) |
|---|---|---|---|---|---|
| a Ehost values were obtained by performing single-point energy calculations for the host–guest systems in their optimized geometries without guest molecule(s).b Eguest values were obtained by performing single-point energy calculations for the host–guest systems in their optimized geometries without the host networks.c Calculated using the equation Ehost–guest = −(Etotal − Ehost − Eguest). | |||||
| Honeycomb | One phthalocyanine | −40.0 | −17.4 | −22.3 | 0.3 |
| Honeycomb | Three coronenes | −26.4 | −17.3 | −7.9 | 1.2 |
Conclusions
We investigated the structure and chirality of the SAMNs of the C3h-symmetric molecular building blocks H3TTCA and DBACOOH, highlighting the effect of the core size. At the 1-HA/graphite interfaces, H3TTCA exclusively forms the honeycomb structure which is a 2D-conglomerate. On the other hand, DBACOOH forms the type I, type II, and type III structures depending on the solute concentration and whether annealing is applied. The type I and type III structures were observed to consist of two homochiral domains in which the molecules had the same chiral orientation, forming 2D-conglomerates. On the other hand, the type II structure was found to be a 2D-racemate based on its composition. However, all observed structures show handedness with respect to the lattice of the graphite surface underneath. The formation of three structures of DBACOOH is attributed to its extensive molecule–substrate interactions, in turn due to its large core size. The honeycomb structure is kinetically formed for DBACOOH upon the addition of the guest molecules and their co-adsorption at the pore. The present study has provided useful information on the effect of the size of the core, in C3h-symmetric aromatic carboxylic acid derivatives, on the formation of SAMNs. We expect this information to be important for further designs and control of the structure and chirality of SAMNs using hydrogen bonding interactions between the carboxy groups.Conflicts of interest
There are no conflicts to declare.Acknowledgements
This work was supported by JSPS KAKENHI Grant Number JP20H02553.Notes and references
- J. A. A. W. Elemans, S. Lei and S. De Feyter, Angew. Chem., Int. Ed., 2009, 48, 7298–7333 CrossRef CAS.
- L. Sosa-Vargas, E. Kim and A.-J. Attias, Mater. Horiz., 2017, 4, 570–583 RSC.
- D. Cui, J. M. MacLeod and F. Rosei, Chem. Commun., 2018, 54, 10527–10539 RSC.
- D. P. Goronzy, M. Ebrahimi, F. Rosei, Arramel, Y. Fang, S. De Feyter, S. L. Tait, C. Wang, P. H. Beton, A. T. S. Wee, P. S. Weiss and D. F. Perepichka, ACS Nano, 2018, 12, 7445–7481 CrossRef CAS.
- T. Kudernac, S. Lei, J. A. A. W. Elemans and S. De Feyter, Chem. Soc. Rev., 2009, 38, 402–421 RSC.
- X. Zhang, Q. Zeng and C. Wang, RSC Adv., 2013, 3, 11351–11366 RSC.
- Y. Tobe, K. Tahara and S. De Feyter, Chem. Commun., 2021, 57, 962–977 RSC.
- K. Tahara, S. Furukawa, H. Uji-i, T. Uchino, T. Ichikawa, J. Zhang, W. Mamdouh, M. Sonoda, F. C. De Schryver, S. De Feyter and Y. Tobe, J. Am. Chem. Soc., 2006, 128, 16613–16625 CrossRef CAS PubMed.
- A. G. Slater, L. M. A. Perdigão, P. H. Beton and N. R. Champness, Acc. Chem. Res., 2014, 47, 3417–3427 CrossRef CAS.
- L. Dong, Z. Gao and N. Lin, Prog. Surf. Sci., 2016, 91, 101–135 CrossRef CAS.
- Y.-F. Geng, P. Li, J.-Z. Li, X.-M. Zhang, Q.-D. Zeng and C. Wang, Coord. Chem. Rev., 2017, 337, 145–177 CrossRef CAS.
- A. Mukherjee, J. Teyssandier, G. Hennrich, S. De Feyter and K. S. Mali, Chem. Sci., 2017, 8, 3759–3769 RSC.
- J. P. Rabe and S. Buchholz, Phys. Rev. Lett., 1991, 66, 2096–2099 CrossRef CAS.
- S. De Feyter and F. C. De Schryver, J. Phys. Chem. B, 2005, 109, 4290–4302 CrossRef CAS.
- A. Mukherjee, Cryst. Growth Des., 2015, 15, 3076–3085 CrossRef CAS.
- M. K. Corpinot and D.-K. Bucar, Cryst. Growth Des., 2019, 19, 1426–1453 CrossRef CAS.
- G. R. Desiraju, J. Am. Chem. Soc., 2013, 135, 9952–9967 CrossRef CAS.
- O. Ivasenko and D. F. Perepichka, Chem. Soc. Rev., 2011, 40, 191–206 RSC.
- K. Rissanen, Hot Topics in Crystal Engineering, Elsevier, Oxford, 2021, pp. 1–16 Search PubMed.
- M. Lackinger and W. M. Heckl, Langmuir, 2009, 25, 11307–11321 CrossRef CAS.
- J. Li, X. Zu, Y. Qian, W. Duan, X. Xiao and Q. Zeng, Chin. Chem. Lett., 2020, 31, 10–18 CrossRef CAS.
- J. F. Dienstmaier, K. Mahata, H. Walch, W. M. Heckl, M. Schmittel and M. Lackinger, Langmuir, 2010, 26, 10708–10716 CrossRef CAS.
- O. Ochs, M. Hocke, S. Spitzer, W. M. Heckl, N. Martsinovich and M. Lackinger, Chem. Mater., 2020, 32, 5057–5065 CrossRef CAS.
- A. Badami-Behjat, P. S. Deimel, F. Allegretti, E. Ringel, K. Mahata, M. Schmittel, J. V. Barth, W. M. Heckl and M. Lackinger, Chem. Mater., 2022, 34, 8876–8884 CrossRef CAS.
- L. Kampschulte, M. Lackinger, A.-K. Maier, R. S. K. Kishore, S. Griessl, M. Schmittel and W. M. Heckl, J. Phys. Chem. B, 2006, 110, 10829–10836 CrossRef CAS PubMed.
- R. Gutzler, S. Lappe, K. Mahata, M. Schmittel, W. M. Heckl and M. Lackinger, Chem. Commun., 2009, 680–682 RSC.
- J. Li, B. Tu, X. Li, C. Ma, C. Chen, W. Duan, X. Xiao and Q. Zeng, Chem. Commun., 2019, 55, 11599–11602 RSC.
- H. Dai, S. Wang, I. Hisaki, S. Nakagawa, N. Ikenaka, K. Deng, X. Xiao and Q. Zeng, Chem.–Asian J., 2017, 12, 2558–2564 CrossRef CAS PubMed.
- Y. Zhang, P. Lei, T. Meng, K. Deng, X. Xiao and Q. Zeng, New J. Chem., 2023, 47, 7716–7721 RSC.
- L. Y. Zhang, J. L. Li, S. H. Qiu, X. B. Huang and Z. B. Zeng, New J. Chem., 2017, 41, 3260–3264 RSC.
- J. M. MacLeod, O. Ivasenko, C. Y. Fu, T. Taerum, F. Rosei and D. F. Perepichka, J. Am. Chem. Soc., 2009, 131, 16844–16850 CrossRef CAS PubMed.
- Z. Ma, Y.-Y. Wang, P. Wang, W. Huang, Y.-B. Li, S.-B. Lei, Y.-L. Yang, X.-L. Fan and C. Wang, ACS Nano, 2007, 1, 160–167 CrossRef CAS.
- S. L. Lee, Y. Fang, G. Velpula, F. P. Cometto, M. Lingenfelder, K. Müllen, K. S. Mali and S. De Feyter, ACS Nano, 2015, 9, 11608–11617 CrossRef CAS PubMed.
- R. Gutzler, T. Sirtl, J. F. Dienstmaier, K. Mahata, W. M. Heckl, M. Schmittel and M. Lackinger, J. Am. Chem. Soc., 2010, 132, 5084–5090 CrossRef CAS PubMed.
- F. P. Cometto, K. Kern and M. Lingenfelder, ACS Nano, 2015, 9, 5544–5550 CrossRef CAS PubMed.
- S. Y. Li, X. Q. Yang, T. Chen, D. Wang, S. F. Wang and L. J. Wan, ACS Nano, 2019, 13, 6751–6759 CrossRef CAS PubMed.
- X. Zeng, S. B. Khan, A. Mahmood and S. L. Lee, Nanoscale, 2020, 12, 15072–15080 RSC.
- A. Mahmood, X. Zeng, A. S. Saleemi, K. Y. Cheng and S. L. Lee, Chem. Commun., 2020, 56, 8790–8793 RSC.
- C. Deng, Z. Liu, C. Ma, H. Zhang and L. Chi, Langmuir, 2020, 36, 5510–5516 CrossRef CAS.
- M. Saeed, A. Mahmood, A. S. Saleemi, X. Zeng and S. L. Lee, J. Phys. Chem. C, 2020, 124, 829–835 CrossRef CAS.
- A. Mahmood, M. Saeed, Y. Chan, A. S. Saleemi, J. Guo and S.-L. Lee, Langmuir, 2019, 35, 8031–8037 CrossRef CAS PubMed.
- C. N. Morrison, S. Ahn, J. K. Schnobrich and A. J. Matzger, Langmuir, 2011, 27, 936–942 CrossRef CAS.
- F. Hu, Y. Gong, X. Zhang, J. Xue, B. Liu, T. Lu, K. Deng, W. Duan, Q. Zeng and C. Wang, Nanoscale, 2014, 6, 4243–4249 RSC.
- S. Zhang, J. Zhang, K. Deng, J. Xie, W. Duan and Q. Zeng, Phys. Chem. Chem. Phys., 2015, 17, 24462–24467 RSC.
- J. A. Elemans, I. De Cat, H. Xu and S. De Feyter, Chem. Soc. Rev., 2009, 38, 722–736 RSC.
- K.-H. Ernst, Phys. Status Solidi B, 2012, 249, 2057–2088 CrossRef CAS.
- R. Raval, Chem. Soc. Rev., 2009, 38, 707–721 RSC.
- T. Chen, D. Wang and L.-J. Wan, Natl. Sci. Rev., 2015, 2, 205–216 CrossRef CAS.
- K. E. Plass, A. L. Grzesiak and A. J. Matzger, Acc. Chem. Res., 2007, 40, 287–293 CrossRef CAS PubMed.
- S. Dutta and A. J. Gellman, Chem. Soc. Rev., 2017, 46, 7787–7839 RSC.
- Y. Xu, J.-J. Duan, Z.-Y. Yi, K.-X. Zhang, T. Chen and D. Wang, Surf. Sci. Rep., 2021, 76, 100531 CrossRef CAS.
- I. Hisaki, Y. Sakamoto, H. Shigemitsu, N. Tohnai, M. Miyata, S. Seki, A. Saeki and S. Tagawa, Chem.–Eur. J., 2008, 14, 4178–4187 CrossRef CAS.
- J. Y. Choi, J. Kim, H. Furukawa and H. K. Chae, Chem. Lett., 2006, 35, 1054–1055 CrossRef CAS.
- R. Lazzaroni, A. Calderone, G. Lambin, J. P. Rabe and J. L. Brédas, Synth. Met., 1991, 41, 525–528 CrossRef CAS.
- H. S. Lee, S. Iyengar and I. H. Musselman, Langmuir, 1998, 14, 7475–7483 CrossRef CAS.
- T. Steiner and G. R. Desiraju, Chem. Commun., 1998, 8, 891–892 RSC.
- T. Steiner, Angew. Chem., Int. Ed., 2002, 41, 48–76 CrossRef CAS.
- G. R. Desiraju, Acc. Chem. Res., 1996, 29, 441–449 CrossRef CAS PubMed.
- G. Eder, S. Kloft, N. Martsinovich, K. Mahata, M. Schmittel, W. M. Heckl and M. Lackinger, Langmuir, 2011, 27, 13563–13571 CrossRef CAS PubMed.
- S. J. H. Griessl, M. Lackinger, F. Jamitzky, T. Markert, M. Hietschold and W. M. Heckl, Langmuir, 2004, 20, 9403–9407 CrossRef CAS PubMed.
Footnote |
| † Electronic supplementary information (ESI) available: Additional STM images, STM image analysis, details of MM calculations. See DOI: https://doi.org/10.1039/d3ra05762c |
| This journal is © The Royal Society of Chemistry 2023 |

