 Open Access Article
Creative Commons Attribution 3.0 Unported Licence
A colorimetric and fluorescent signaling probe for assaying Pd2+ in practical samples†
Myung Gil Choi ,
Juyoung Han,
Sangdoo Ahn
 * and
Suk-Kyu Chang
 *
*
Department of Chemistry, Chung-Ang University, Seoul 06974, Republic of Korea. E-mail: sangdoo@cau.ac.kr; skchang@cau.ac.kr; Fax: +82 2 825 4736; Tel: +82 2 820 5199
First published on 1st November 2023
Abstract
We developed an optical signaling probe to detect Pd2+ ions in Pd-containing catalyst and drug candidate. The Pd2+ signaling probe (Res-DT) was readily prepared by reacting the versatile fluorochrome resorufin with phenyl chlorodithioformate. In a phosphate-buffered saline solution (pH 7.4) containing sodium dodecyl sulfate (SDS) as a signal-boosting surfactant, Res-DT exhibited a pronounced colorimetric response with a chromogenic yellow to magenta shift, leading to a substantial increase in the fluorescence intensity. The Pd2+ signaling performance of Res-DT was attributed to the Pd2+-promoted hydrolysis of the dithioate moiety. The probe displayed high selectivity toward Pd2+ ions and remained unaffected by commonly encountered coexisting components. Moreover, the detection limit of Res-DT for Pd2+ ions was 10 nM, and the signaling was achieved within 7 min. Furthermore, to demonstrate the real-world applicability of Res-DT, a Pd2+ assay was performed in Pd-containing catalyst and drug candidate using an office scanner as an easily accessible measurement device. Our results highlight the prospects of Res-DT as a tool to detect Pd2+ ions in various practical samples, with potential applications in catalysis, medicine, and environmental science.
1. Introduction
Palladium (Pd) is a versatile and valuable Pt-group metal with diverse practical applications in industrial arenas such as dentistry, electronics, chemical synthesis, groundwater treatment, and exhaust gas treatment.1,2 Additionally, it is employed in therapeutics owing to its antiviral, antifungal, antimicrobial, anticancer, and cardioprotective properties.3 Furthermore, it is a vital component of fuel cells that generate energy through chemical reactions involving hydrogen and oxygen.4Pd-based catalysts are essential for producing myriad fine chemicals that are used to manufacture pharmaceuticals and agricultural products.5 In particular, several Pd-catalyzed organic reactions, including the Mizoroki–Heck reaction,6 Suzuki–Miyaura reaction,7 Sonogashira–Hagihara reaction,8 Buchwald–Hartwig amination,9 carbonylation,10 and cyanation,11 are performed in pharmaceutical preparations.12 Moreover, Pd complexes can be used as anticancer agents owing to their similar chemical and physical properties to those of the widely employed Pt complexes.13 However, the inherent toxicity of Pd has made Pd contamination a matter of considerable concern.14 In particular, Pd species can bind to important biological materials, such as amino acids, DNA, RNA, and proteins,15,16 thereby disrupting cellular processes and leading to severe health problems including weight loss, muscle weakness, seizures, and heart disease.17 Consequently, the determination of residual Pd in commercially available drug chemicals, agricultural products, and foods is crucial.
Various conventional analytical techniques have been employed to detect Pd in different analytes using sophisticated, specialized analytical instruments.18 However, these techniques typically require complex sample preparation protocols, stringent experimental conditions, and highly skilled operators.19 In contrast, colorimetric or fluorescent chemosensors and reaction-based probes hold greater promise for selective and sensitive metal ion/anion detection, including Pd. These methods offer straightforward operability, high sensitivity, no need for heavy instruments, and widespread applicability.20
To meet the increasing need for simpler and more convenient Pd analysis methods, several colorimetry or fluorescence-based chemosensors and reaction-based probes have been developed.19,21 Pd signaling sensors have been obtained using diverse ligands including pyridine-2,6-dicarboxamide,22 2-chloroethyl methyl sulfide,23 purine derivative,24 and 2-picolylamine.25 Additionally, several Pd-selective signaling probes have been developed by leveraging their Pd-selective reactions, signal-accumulating ability, and ease of design.26 For instance, deallylation of allyl carbamates,27 allyl carbonates,28 allyl ethers,29 and allyl ester,30 and depropargylation of propargyl ethers31 and propargyl carbamates32 have been extensively performed to design Pd signaling probes. In addition, probes that detect Pd via metal-induced organic transformations have been prepared using the Claisen rearrangement,33 dimerization,34 and oxidative cyclization reactions.35 Furthermore, several Pd signaling probes that exploit the hydrolysis of thiocarbamate and hydrazones of resorufin and rhodamine fluorochromes have been engineered.36 There have also been various studies exploring Pd2+ sensing probes, each contributing valuable insights into their development and applications.37 Representative optical Pd specific reaction-based probes have been summarized in Table S1 (ESI).†
In this study, we introduce a novel dual-mode probe (Res-DT) designed for the highly sensitive detection of Pd2+ ions through both colorimetric and fluorescent responses, facilitated by the hydrolysis of dithioate-modified resorufin. The probe ensures rapid, convenient, and naked-eye detectable responses, obviating the need for complex instrumentation. Res-DT demonstrates efficiency in swiftly and precisely assaying residual Pd2+ in a Pd-containing catalyst and a Pd-containing drug candidate noted for its antimicrobial and anticancer activities.
2. Experimental
2.1 Synthesis of Res-DT
Resorufin dithioate (Res-DT) was synthesized using a previously reported method with slight modifications.38 In a 100 mL round bottom flask, resorufin (0.43 g, 2.0 mmol) was dissolved in 30 mL of N,N-dimethylformamide (DMF). The solution was then mixed with triethylamine (TEA; 0.56 mL, 4.0 mmol) and stirred for 30 min at room temperature. Phenyl chlorodithioformate (0.45 mL, 3.0 mmol) was then added carefully to the solution, and the reaction was allowed to continue for 12 h with constant stirring. DMF was then removed by passing air over the system, and the remaining solid was dissolved in dichloromethane (50 mL). The resulting solution was washed with distilled water and brine and then evaporated. The obtained residue was purified by column chromatography (CH2Cl2![[thin space (1/6-em)]](https://www.rsc.org/images/entities/char_2009.gif) :
:![[thin space (1/6-em)]](https://www.rsc.org/images/entities/char_2009.gif) CH3OH = 49
CH3OH = 49![[thin space (1/6-em)]](https://www.rsc.org/images/entities/char_2009.gif) :
:![[thin space (1/6-em)]](https://www.rsc.org/images/entities/char_2009.gif) 1, v/v). Res-DT. 0.52 g, 71% yield as a vermillion-colored powder. 1H NMR (600 MHz, CDCl3) δ 7.81 (dt, J = 8.9, 1.2 Hz, 1H), 7.64–7.59 (m, 2H), 7.54–7.46 (m, 3H), 7.42 (d, J = 9.8 Hz, 1H), 7.13–7.10 (m, 2H), 6.86 (dd, J = 9.8, 2.0 Hz, 1H), 6.32 (d, J = 2.0 Hz, 1H); 13C NMR (150 MHz, CDCl3): δ 212.4, 186.2, 156.6, 149.1, 148.7, 144.4, 135.3, 135.2, 134.8, 131.8, 131.2, 130.7, 129.8, 129.7, 119.9, 110.6, 107.3; HRMS (EI+, m/z): calcd. for C19H11NO3S2+ [M]+: 365.0180, found 365.0179.
1, v/v). Res-DT. 0.52 g, 71% yield as a vermillion-colored powder. 1H NMR (600 MHz, CDCl3) δ 7.81 (dt, J = 8.9, 1.2 Hz, 1H), 7.64–7.59 (m, 2H), 7.54–7.46 (m, 3H), 7.42 (d, J = 9.8 Hz, 1H), 7.13–7.10 (m, 2H), 6.86 (dd, J = 9.8, 2.0 Hz, 1H), 6.32 (d, J = 2.0 Hz, 1H); 13C NMR (150 MHz, CDCl3): δ 212.4, 186.2, 156.6, 149.1, 148.7, 144.4, 135.3, 135.2, 134.8, 131.8, 131.2, 130.7, 129.8, 129.7, 119.9, 110.6, 107.3; HRMS (EI+, m/z): calcd. for C19H11NO3S2+ [M]+: 365.0180, found 365.0179.
2.2 Stock solution preparation
A stock solution containing probe Res-DT (0.5 mM) was made by dissolving Res-DT in dimethyl sulfoxide (DMSO). Pd-containing solutions (5.0 mM) were prepared by dissolving Pd(OAc)2, PdCl2, and Pd(PPh3)4 in DMSO, and K2PdCl6 in deionized (DI) water. Solutions of metal ions and anions (5.0 mM) were prepared using metal perchlorate salts and sodium salts of the anions, respectively, in DI water. Oxidant solutions (5.0 mM), including H2O2, HOCl, peracetic acid, O2−, perborate, percarbonate, and ammonium persulfate, were prepared and standardized as described previously.392.3 Investigation of Pd2+ signaling with Res-DT
We investigated the Pd2+ sensing behavior of Res-DT in a pH 7.4 phosphate-buffered saline (PBS) solution, using 2% DMSO as a solubilizer. To that end, the analyte stock solution (15 μL, 5.0 mM) was first added to a sample tube and diluted with DI water (2.34 mL) and a predetermined amount of DMSO. Then, a PBS solution (0.30 mL, 100 mM) and SDS (0.30 mL, 100 mM) were added to the mixture, followed by Res-DT (30 μL, 0.50 mM). The final concentrations of Res-DT, the analyte, PBS, and SDS were 5.0 μM, 25 μM, 10.0 mM, and 10.0 mM respectively. Error bars were determined based on the standard deviation derived from three sets of experiments.2.4 Mechanism study of Pd2+ signaling
In a 100 mL round bottom flask, Res-DT (37 mg, 100 μmol) was dissolved in CH3CN (20 mL). The resulting solution was then mixed with palladium acetate (56 mg, 250 μmol). Upon verifying the completion of the reaction by thin-layer chromatography, the precipitate was collected using a centrifuge (4000 rpm) and washed with CH3CN. The precipitate was dried and analyzed using field-emission scanning electron microscopy (FE-SEM) equipped with energy-dispersive X-ray spectroscopy (EDX). The remaining solution was evaporated under reduced pressure and the residue was purified by column chromatography. The purified product of the Pd2+ signaling of Res-DT was scrutinized by 1H NMR and mass spectrometry measurements.2.5 Office scanner-based determination of Pd2+ concentration in Pd-containing catalyst and drug candidate
To determine the Pd2+ concentration in Pd-containing catalyst and drug candidate, five samples with varying Pd2+ levels were tested. These samples were prepared by mixing a predetermined amount of the Pd-containing catalyst or drug (ranging from 0 to 6 μL; 1.0 mM), DI water (2.34 mL), DMSO (15 μL), PBS (0.30 mL, 0.10 M), SDS (0.30 mL, 0.10 M), and Res-DT (30 μL, 0.50 mM) in a sample vial. The resulting solutions (0.30 mL) were then individually transferred into a 96-well plate. A calibration plot of the color channel levels (RGB) against the Pd species concentration was constructed thereafter using an office scanner (V550, Epson) in transmittance mode.3. Results and discussion
Sulfur-based chemosignaling probes have been extensively used to detect thiophilic metal ions and common oxidants through the desulfurization and oxidative hydrolysis reactions.38,40 In the present study, the dithioate moiety, which is prone to desulfurization-induced hydrolysis in the presence of hypochlorite ions,38 was targeted in this study to develop a colorimetric, fluorescent signaling probe for analyzing Pd2+ in catalysts and drugs. The undesired response toward hypochlorite ions can be readily suppressed using hypochlorite-scavenging DMSO.41 Based on this rationale, a simple but optically vibrant dithioate-based Pd2+ signaling probe, called Res-DT, was developed. Probe Res-DT was synthesized by reacting resorufin with phenyl chlorodithioformate (Scheme 1) and then characterized by NMR spectroscopy and mass spectrometry.First, the Pd2+ signaling condition of Res-DT was optimized by measuring the changes in absorbance at 572 nm. Preliminary results indicated that Res-DT exhibited moderate Pd2+ signaling activity in pH 7.4 PBS with 2% DMSO which acted both as a solubilizer and a scavenger for potential hypochlorite interferants (Fig. S1, ESI†). However, the signaling performance was relatively sluggish for practical applications, given that the reaction was incomplete even after 30 min. Therefore, to improve the reaction rate of Res-DT for Pd2+ ions, three types of surfactants were employed: anionic (SDS), cationic (cetyltrimethylammonium bromide (CTAB)), and nonionic (Tween 20). According to the results (Fig. S2a, ESI†), the Pd2+ signaling behavior of Res-DT was substantially improved upon using SDS (10.0 mM). The other surfactant solutions (CTAB and Tween 20) also enhanced the Pd2+ signaling speed of Res-DT (Fig. S2b and c, ESI†). However, Res-DT was slightly hydrolyzed when the CTAB solution (1.0 mM) was used, and undesirable precipitates were formed when the Tween 20-containing solution (0.09 mM) was employed (Fig. S3, ESI†). Therefore, subsequent Pd2+ signaling experiments with Res-DT were performed using the SDS surfactant solution as a signal booster.
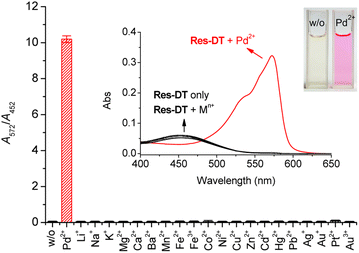
The colorimetric and fluorescence signaling properties of Res-DT for representative metal ions and anions were investigated under optimized conditions. First, the colorimetric signaling response of Res-DT was examined upon exposure to various common metal ions (Fig. 1). Res-DT exhibited a weak absorption band at 452 nm with pale-yellow coloration in the measurement solution. However, after treatment with Pd2+ ions, it showed a strong increase and moderate decrease in the absorbance at 572 and 452 nm, respectively. Concomitantly, the solution turned magenta from pale yellow (Fig. 1, inset). Furthermore, the other tested metal ions did not induce noticeable changes in the UV-vis spectra or color. Because the signaling ability of Res-DT for Pd2+ was related to the absorbance variation at two widely separated wavelengths, 572 nm and 452 nm, the selectivity for Pd2+ was assessed by ratiometry using the absorbance ratio (A572/A452) (Fig. 1). The A572/A452 value of Res-DT with Pd2+ was 10.2, whereas those of the other tested metal ions were remarkably low and similar to that of Res-DT alone (values ranging from 0.04 (Mg2+) to 0.11 (Pt2+)). Additionally, the Pd2+ selectivity of Res-DT was also confirmed in the presence of several representative anions (Fig. S4, ESI†) by showing the low A572/A452 values of Res-DT for anions (ranging from 0.06 (Cl−) to 0.08 (N3−)). Furthermore, taking into the fact that the dithioate-based probe has been used for hypochlorite sensing,38 the changes in the absorbance ratio of Res-DT upon treatment with representative oxidants were measured. The results (Fig. S5, ESI†) indicated that the tested oxidants, including hypochlorite ions, negligibly altered the A572/A452 ratio (ranging from 0.05 for perborate (PB) to 0.06 for tert-butyl hydroperoxide (TBHP)). The photophysical properties of Res-DT, both pre- and post-Pd2+ signaling, are detailed in Table S2 (ESI).†
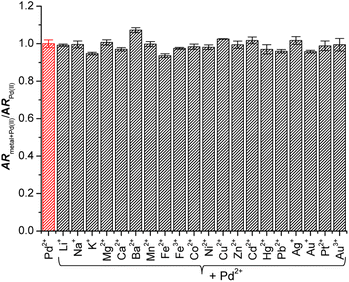
Next, to confirm the influence of background ions on the Pd2+ signaling tendency of Res-DT, sensing experiments with coexisting metal ions and anions were performed. According to the results (Fig. 2), the Pd2+ signaling behavior of Res-DT was unaffected by the presence of coexisting metal ions. Essentially, the A572/A452 value of the samples after the Pd2+ signaling experiments varied only slightly, ranging from 93.6% (for Fe2+) to 107.3% (for Ba2+) of the control result. In addition, the Pd2+ signaling performance of Res-DT was not altered by the presence of different anions, given the narrow range of the A572/A452 values (92.5% for N3− to 103.0% for F−) (Fig. S6, ESI†).
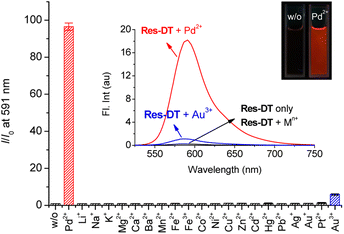
Resorufin-based sensing probes typically exhibit significant fluorescence features as well as remarkable colorimetric signaling behavior.42 Therefore, the Pd2+ signaling performance of Res-DT was evaluated based on the changes in the fluorescence response occurring under the same sensing conditions. Based on the results (Fig. 3, inset), Res-DT exhibited faint fluorescence emission at approximately 586 nm (ΦRes-DT = 0.009) owing to the photophysical characteristics of the phenolic moiety-protected resorufin fluorophore.43 However, upon exposure to Pd2+ ions, Res-DT revealed strong fluorescence emission (ΦRes-DT+Pd(II) = 0.58), exhibiting over a 90-fold fluorescence enhancement at 591 nm (Fig. 3). All other tested metal ions showed insignificant fluorescence responses except for Au3+ ions (I/I0 = 5.88), with I/I0 generally fluctuating between 0.97 (for Li+) and 1.32 (for Pt2+). Furthermore, no measurable changes were observed in the fluorescence emission of Res-DT toward the encountered anions, with I/I0 varying from 0.99 (for Cl−) to 1.50 (for N3−) (Fig. S7, ESI†). These results highlight the fluorometric potential of Res-DT to sense Pd2+ ions in chemical and industrial applications. However, the Pd2+ sensing behavior of Res-DT was investigated using colorimetric measurements which allowed the ratiometric analysis, rather than the method relying on a simple turn-on type fluorescence enhancement at a single wavelength. Ratiometry offers several advantages including increased sensitivity, improved selectivity, and reduced interference from the effects of interfering substances in the sample matrix.44
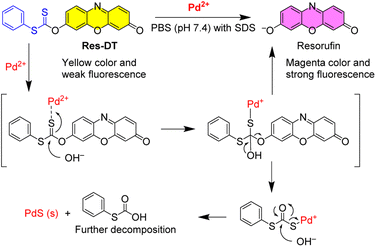
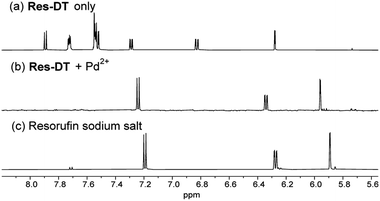
The Pd2+ signaling was hypothesized to be caused by the generation of the resorufin fluorochrome via Pd2+-mediated hydrolysis of the dithioate moiety of Res-DT (Scheme 2). In the proposed sensing mechanism of Res-DT, the initial stage involves complex formation between the sulfur atom of the C![[double bond, length as m-dash]](https://www.rsc.org/images/entities/char_e001.gif) S bond and thiophilic Pd2+ ions.45 The complex is then hydrolyzed, yielding resorufin dye with its distinctive magenta color and strong fluorescence signals. To confirm the sensing mechanism of Res-DT, the Pd2+ signaling product was scrutinized using 1H NMR measurements. The results indicated that the NMR pattern of Res-DT was similar to that of typical phenol-protected resorufin compounds (Fig. 4).40 Moreover, the purified Pd2+ sensing product (Res-DT + Pd2+) exhibited three well-defined resonances in the 1H NMR spectrum that were likely associated with resorufin. Furthermore, our investigation using thin-layer chromatography of the Pd2+ signaling solution of Res-DT revealed that resorufin is produced (Fig. S8, ESI†). Through FAB mass spectrometry, a diagnostic peak at m/z = 214 was identified in the Pd2+ signaling product, which matches the calculated mass of resorufin (C12H8NO3+ [M + H] = 214) (Fig. S9, ESI†). Additionally, we isolated a greenish-black colored precipitate from the Pd2+ signaling solution and confirmed it to be PdS using FE-SEM equipped with EDX (Fig. S10, ESI†).
S bond and thiophilic Pd2+ ions.45 The complex is then hydrolyzed, yielding resorufin dye with its distinctive magenta color and strong fluorescence signals. To confirm the sensing mechanism of Res-DT, the Pd2+ signaling product was scrutinized using 1H NMR measurements. The results indicated that the NMR pattern of Res-DT was similar to that of typical phenol-protected resorufin compounds (Fig. 4).40 Moreover, the purified Pd2+ sensing product (Res-DT + Pd2+) exhibited three well-defined resonances in the 1H NMR spectrum that were likely associated with resorufin. Furthermore, our investigation using thin-layer chromatography of the Pd2+ signaling solution of Res-DT revealed that resorufin is produced (Fig. S8, ESI†). Through FAB mass spectrometry, a diagnostic peak at m/z = 214 was identified in the Pd2+ signaling product, which matches the calculated mass of resorufin (C12H8NO3+ [M + H] = 214) (Fig. S9, ESI†). Additionally, we isolated a greenish-black colored precipitate from the Pd2+ signaling solution and confirmed it to be PdS using FE-SEM equipped with EDX (Fig. S10, ESI†).
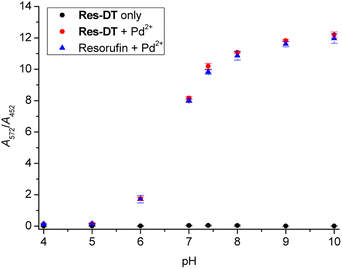
The influence of pH on the Pd2+ signaling performance of Res-DT was tested to assess its practical usability. The results showed that the A572/A452 value of pristine Res-DT remained constant across the pH range 4.0–10.0 (Fig. 5). In contrast, that of the Pd2+ signaling sample (Res-DT + Pd2+) increased significantly from pH 6.0 onward and stabilized at around pH 8; this tendency was mirrored by that of the reference compound resorufin in the presence of coexisting Pd2+ ions. This finding suggested that the pH profile of the Pd2+ signaling was due to the pH dependency of the spectroscopic properties of resorufin. Next, to verify the signaling performance of Res-DT for Pd species with different oxidation states, the response of the probe to Pd(II)OAc2, Pd(II)Cl2, Pd(0)(PPh3)4, and K2Pd(IV)Cl6 was monitored. The results indicated that Res-DT exhibited similar signaling behavior, as evidenced by the absorbance ratios, for the different Pd species in the employed pH 7.4 PBS solution (Fig. S11, ESI†).
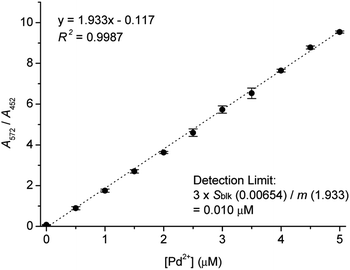
UV-vis titration of Res-DT with Pd2+ was subsequently performed to determine the minimum Pd2+ ion concentration detected using Res-DT. The absorbance ratio A572/A452 increased linearly up to a Pd2+ concentration of 5.0 μM (R2 = 0.9987) (Fig. 6). Using the titration plot and IUPAC recommended equation (3sblk/m), where sblk and m denote standard deviation of the blank signal and analytical sensitivity, respectively, the detection limit was calculated to be 10 nM.46 Additionally, we studied the quantitative analytical behavior of Res-DT for Pd2+ sensing by fluorescence titration (Fig. S12, ESI†). The fluorescence emission changes at 591 nm demonstrated a linear correlation with increasing concentrations of Pd2+ (R2 = 0.9870). From these results, the detection limit for Pd2+ ions was calculated to be 7.3 nM.46 Furthermore, we estimated the detection time of Res-DT for Pd2+ ions by observing the time-dependent change in the absorbance ratio (A572/A452), and it was found to be 7 min (Fig. S13, ESI†).
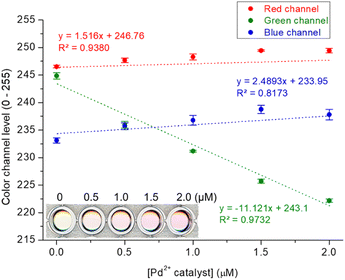
Finally, to assess the practical applicability of the devised probe, Pd assay in Pd-containing catalyst and drug candidate was performed using an office scanner as a readily accessible device for detection.47 We used the white catalyst as the Pd-containing catalyst, and a Pd2+–2-picolinic acid complex as the Pd-containing drug candidate.48 The Res-DT with the tested catalyst and drug candidate exhibited a noticeable color shift from yellow to magenta, and the variation in color could be conveniently characterized through analysis of the RGB color channel levels of the scanned image (Fig. 7 and S14, ESI†). Consequently, acceptable calibration curves based on the green channel, rather than the red and blue channels, were obtained for the catalyst and drug candidate, which yielded satisfactory R2 values of 0.9732 and 0.9887 for the catalyst and drug candidate, respectively. The results of the colorimetric signaling-based Pd2+ assay for the catalyst and drug candidate performed using the office scanner (recovery = 94.1–107.2%) were consistent with those of UV-vis spectrometry (recovery = 91.0–101.3%) (Table S3, ESI†). This result implies that the Res-DT could be successfully applied to the analysis of Pd2+ ions in palladium relevant catalysts and drugs.
4. Conclusions
A simple colorimetric and fluorescent probe (Res-DT) was developed for the convenient determination of Pd species in Pd-containing catalyst and drug candidate. Res-DT exhibited selective, sensitive signaling behavior toward Pd species without interference from common metal ions, anions, and oxidants. The signaling was achieved by Pd-induced hydrolysis of the dithioate moiety of Res-DT, generating resorufin dye that exhibits a magenta color, visible to the naked eye, and intense fluorescence. The probe was immune to interference from several other metal ions and anions when detecting Pd ions. Additionally, the Pd signaling was achieved within 7 min, and the detection limit of the probe was determined to be 10 nM. Finally, Res-DT was successfully employed to analyze Pd2+ ions in Pd-containing catalyst and drug candidate. The designed Res-DT can potentially be applied in various practical and industrial settings featuring Pd-related systems.Conflicts of interest
There are no conflicts of interest to declare.Acknowledgements
This research was supported by the Chung-Ang University Graduate Research Scholarship in 2022 (JH) and the National Research Foundation of Korea (NRF) grant funded by the Korea government (MSIT) (No. 2022R1F1A1072643).Notes and references
- C. M. Crudden, M. Sateesh and R. Lewis, J. Am. Chem. Soc., 2005, 127, 10045–10050 CrossRef CAS PubMed.
- (a) X. F. Wu, P. Anbarasan, H. Neumann and M. Beller, Angew. Chem., Int. Ed., 2010, 49, 9047–9050 CrossRef CAS PubMed; (b) C. C. C. J. Seechurn, M. O. Kitching, T. J. Colacot and V. Snieckus, Angew. Chem., Int. Ed., 2012, 51, 5062–5085 CrossRef PubMed.
- N. P. Sudheesh, T. A. Ajith, K. K. Janardhanan and C. V. Krishnan, Food Chem. Toxicol., 2010, 48, 1858–1862 CrossRef CAS.
- E. Antolini, Energy Environ. Sci., 2009, 2, 915–931 RSC.
- S. Bhaskaran, M. S. A. Padusha and A. M. Sajith, ChemistrySelect, 2020, 5, 9005–9016 CrossRef CAS.
- I. Shinkai, A. O. King and R. D. Larsen, Pure Appl. Chem., 1994, 66, 1551–1556 CrossRef CAS.
- S. Haber, in Aqueous-Phase Organometallic Catalysis, ed. B. Cornils and W. A. Herrmann, Wiley-VCH, Weinheim, 1998 Search PubMed.
- U. Beutler, J. Mazacek, G. Penn, B. Schenkel and D. Wasmuth, Chimia, 1996, 50, 154–156 CrossRef CAS.
- D. B. Damon, R. W. Dugger, S. E. Hubbs, J. M. Scott and R. W. Scott, Org. Process Res. Dev., 2006, 10, 472–480 CrossRef CAS.
- E. J. Lang, K. H. Lee, J. S. Lee and Y. G. Kim, J. Mol. Catal. A: Chem., 1999, 138, 25–36 CrossRef.
- L. S. Lin, T. J. Lanza, J. J. P. Jewell, P. Liu, S. K. Shah, H. Qi, X. Tong, J. Wang, S. S. Xu, T. M. Fong, C.-P. Shen, J. Lao, J. C. Xiao, L. P. Shearman, D. S. Stribling, K. Rosko, A. Strack, D. J. Marsh, Y. Feng, S. Kumar, K. Samuel, W. Yin, L. V. der Ploeg, S. G. Mills, M. MacCoss, M. T. Goulet and W. K. Hagmann, J. Med. Chem., 2006, 49, 7584–7587 CrossRef CAS.
- C. Torborg and M. Beller, Adv. Synth. Catal., 2009, 351, 3027–3043 CrossRef CAS.
- A. S. Abu-Surrah, H. H. Al-Sa'doni and M. Y. Abdalla, Cancer Ther., 2008, 6, 1–10 CAS.
- F. Zereini, C. Wiseman and W. Püttmann, Environ. Sci. Technol., 2007, 41, 451–456 CrossRef CAS PubMed.
- C. D. Spicer, T. Triemer and B. G. Davis, J. Am. Chem. Soc., 2012, 134, 800–803 CrossRef CAS PubMed.
- R. M. Yusop, A. Unciti-Broceta, E. M. V. Johansson, R. M. Sánchez-Martín and M. Bradley, Nat. Chem., 2011, 3, 239–243 CrossRef CAS.
- J. Kielhorna, C. Melberb, D. Kellerb and I. Mangelsdorfa, Int. J. Hyg. Environ. Health, 2002, 205, 417–432 CrossRef.
- H. Li, J. Fan and X. Peng, Chem. Soc. Rev., 2013, 42, 7943–7962 RSC.
- R. Balamurugan, J.-H. Liu and B.-T. Liu, Coord. Chem. Rev., 2018, 376, 196–224 CrossRef CAS.
- X. Jin, J. Gao, T. Wang, W. Feng, R. Li, P. Xie, L. Si, H. Zhou and X. Zhang, Spectrochim. Acta, Part A, 2020, 224, 117467 CrossRef CAS PubMed.
- M. P. Tracey, D. Pham and K. Koide, Chem. Soc. Rev., 2015, 44, 4769–4791 RSC.
- P. Kumar, V. Kumar and R. Gupta, RSC Adv., 2017, 7, 7734–7741 RSC.
- X. Chen, H. Wang, X. Ma, M. Wang, Y. Zhang, G. Gao, J. Liu and S. Hou, Dyes Pigm., 2018, 148, 286–291 CrossRef CAS.
- G. Wu, Z. Wang, W. Zhang, W. Chen, X. Jin and H. Lu, Inorg. Chem. Commun., 2019, 102, 233–239 CrossRef CAS.
- X. Fang, Y. Zhang, M. Li, Z. Zhang, Y. Qi, X. Zhang, X. Zhang, Y. Liu, J. Li and H. Yu, Dyes Pigm., 2023, 209, 110929 CrossRef CAS.
- M. E. Jun, B. Roy and K. H. Ahn, Chem. Commun., 2011, 47, 7583–7601 RSC.
- (a) M. Du, Y. Zhang, Y. Yu, H. Zhao, Y. Guo and Y. Yang, Anal. Methods, 2019, 11, 6053–6061 RSC; (b) Y. Zhang, M. Yang and M. Ji, New J. Chem., 2020, 44, 20434 RSC.
- (a) W. Luo, J. Li and W. Liu, Org. Biomol. Chem., 2017, 15, 5846–5850 RSC; (b) Q. Xia, S. Feng, D. Liu and G. Feng, Sens. Actuators, B, 2018, 258, 98–104 CrossRef CAS.
- M. Kumar, N. Kumar and V. Bhalla, RSC Adv., 2013, 3, 1097–1102 RSC.
- J. Zhou, S. Xu, Z. Yu, X. Ye, X. Dong and W. Zhao, Dyes Pigm., 2019, 170, 107656 CrossRef CAS.
- T. Chen, T. Wei, Z. Zhang, Y. Chen, J. Qiang, F. Wang and X. Chen, Dyes Pigm., 2017, 140, 392–398 CrossRef CAS.
- W. Liu, J. Jiang, C. Chen, X. Tang, J. Shi, P. Zhang, K. Zhang, Z. Li, W. Dou, L. Yang and W. Liu, Inorg. Chem., 2014, 53, 12590–12594 CrossRef CAS PubMed.
- X. Li, H. Huang, Y. Zhu, H. Zhao and Z. Wang, RSC Adv., 2015, 5, 105810–105813 RSC.
- A. Higashi, N. Kishikawa, K. Ohyama and N. Kuroda, Tetrahedron Lett., 2017, 58, 2774–2778 CrossRef CAS.
- M. E. Jun and K. H. Ahn, Org. Lett., 2010, 12, 2790–2793 CrossRef CAS.
- (a) M. G. Choi, J.-Y. Seo, E. J. Cho and S.-K. Chang, J. Photochem. Photobiol., A, 2022, 429, 113920 CrossRef CAS; (b) A. Ghosh, S. Nandi, A. Sengupta, A. Chattopadhyay, S. Lohar and D. Das, Inorg. Chim. Acta, 2015, 436, 52–56 CrossRef CAS.
- (a) W. Feng, L. Bai, S. Jia and G. Feng, Sens. Actuators, B, 2018, 260, 554–562 CrossRef CAS; (b) L. Wang, M. Ren, Z. Li, L. Dai and W. Lin, New J. Chem., 2019, 43, 552–555 RSC; (c) S. Mondal, S. K. Manna, S. Pathak, A. Al Masum and S. Mukhopadhyay, New J. Chem., 2019, 43, 3513–3519 RSC; (d) F.-K. Tang, S.-M. Chan, T. Wang, C.-S. Kwan, R. Huang, Z. Cai and K. C.-F. Leung, Talanta, 2020, 210, 120634 CrossRef CAS PubMed.
- M. G. Choi, Y. J. Lee, K. M. Lee, K. Y. Park, T. J. Park and S.-K. Chang, Analyst, 2019, 144, 7263–7269 RSC.
- (a) L. Qiao, H. Nie, Y. Wu, F. Xin, C. Gao, J. Jing and X. Zhang, J. Mater. Chem. B, 2017, 5, 525–530 RSC; (b) L. Wu, Q. Yang, L. Liu, A. C. Sedgwick, A. J. Cresswell, S. D. Bull, C. Huang and T. D. James, Chem. Commun., 2018, 54, 8522–8525 RSC.
- M. G. Choi, S. Y. Park, K. Y. Park and S.-K. Chang, Sci. Rep., 2019, 9, 3348 CrossRef PubMed.
- F. C. Lopez, A. Shankar, M. Thompson, B. Shealy, D. Locklear, T. Rawalpally, T. Cleary and C. Gagliardi, Org. Process Res. Dev., 2005, 9, 1003–1008 CrossRef CAS.
- L. Tian, H. Feng, Z. Dai and R. Zhang, J. Mater. Chem. B, 2021, 9, 53–79 RSC.
- M. G. Choi, S. Kwon and S.-K. Chang, Dyes Pigm., 2021, 192, 109394 CrossRef CAS.
- J. S. Kim, M. G. Choi, K. C. Song, K. T. No, S. Ahn and S.-K. Chang, Org. Lett., 2007, 9, 1129–1132 CrossRef CAS PubMed.
- B. J. Stenton, B. L. Oliveira, M. J. Matos, L. Sinatra and G. J. L. Bernardes, Chem. Sci., 2018, 9, 4185–4189 RSC.
- D. C. Harris, in Quantitative Chemical Analysis, W.H. Freeman and Company, New York, 8th edn, 2010, pp. 103–105 Search PubMed.
- D. C. Christodouleas, A. Nemiroski, A. A. Kumar and G. M. Whitesides, Anal. Chem., 2015, 87, 9170–9178 CrossRef CAS PubMed.
- F. A. Al-Saif, J. Y. Al-Humaidi, D. N. Binjawhar and M. S. Refat, J. Mol. Struct., 2020, 1218, 128547 CrossRef CAS.
Footnote |
| † Electronic supplementary information (ESI) available: Results of Pd2+-selective UV-vis and fluorescence signaling experiments; 1H, 13C NMR, and mass spectra of the Res-DT. See DOI: https://doi.org/10.1039/d3ra05549c |
| This journal is © The Royal Society of Chemistry 2023 |


