Cell membrane-specific self-assembly of peptide nanomedicine induces tumor immunogenic death to enhance cancer therapy†
Pengsheng
Fan‡
ab,
Yinghua
Guan‡
ab,
Xiaoying
Zhang
b,
Jiaqi
Wang
b,
Yinsheng
Xu
b,
Benli
Song
b,
Suling
Zhang
b,
Hao
Wang
 b,
Ya
Liu
 *a and
Zeng-Ying
Qiao
 *b
*b
aCollege of Marine Life Science, Ocean University of China, No. 5 Yushan Road, Qingdao 266003, China. E-mail: yaliu@ouc.edu.cn
bLaboratory for Biological Effects of Nanomaterials and Nanosafety, National Center for Nanoscience and Technology (NCNST), Beijing 100190, China. E-mail: qiaozy@nanoctr.cn
First published on 16th June 2023
Abstract
Immunogenic cell death (ICD), as an unusual cell death pattern, mediates cancer cells to release a series of damage-associated molecular patterns (DAMPs), and is widely used in the field of cancer immunotherapy. Injuring the cell membrane can serve as a novel ICD initiation strategy. In this study, a peptide nanomedicine (PNpC) is designed using the fragment CM11 of cecropin, which is effective in disrupting cell membranes because of its α-helical structure. PNpC self-assembles in situ in the presence of high levels of alkaline phosphatase (ALP) on the tumor cell membrane, transforming from nanoparticles to nanofibers, which reduces the cellular internalization of the nanomedicine and increases the interaction between CM11 and tumor cell membranes. Both in vitro and in vivo results indicate that PNpC plays a significant role in killing tumor cells by triggering ICD. The ICD induced by the destruction of the cancer cell membrane is accompanied by the release of DAMPs, which promotes the maturation of DCs and facilitates the presentation of tumor-associated antigens (TAA), resulting in the infiltration of CD8+ T cells. We believe that PNpC can trigger ICD while killing cancer cells, providing a new reference for cancer immunotherapy.
New conceptsImmunogenic cell death (ICD) is widely used in the field of cancer immunotherapy, and the cell membrane disruption can serve as a novel ICD initiation strategy. However, there is a lack of a powerful strategy to crumble the tumor cell membrane effectively. Developing cell membrane-specific self-assembly of penetrating peptides is expected to improve the effect of cell membrane disruption. In this study, a peptide nanomedicine (PNpC) with a penetrating peptide (CM11), an assembled peptide and a responsive group is developed. PNpC self-assembles in situ in the presence of high levels of alkaline phosphatase (ALP) on the tumor cell membrane, transforming from nanoparticles to nanofibers, which reduces the cellular internalization of nanomedicine and increases the interaction between CM11 and tumor cell membranes. Both in vitro and in vivo results indicate that PNpC plays a significant role in killing tumor cells by triggering ICD. The ICD induced by the destruction of the cancer cell membrane is accompanied by the release of DAMPs, which promotes the maturation of DCs and facilitates the presentation of tumor-associated antigens (TAA), resulting in the infiltration of CD8+ T cells. We believe that PNpC can trigger ICD while killing cancer cells, providing a new reference for cancer immunotherapy. |
Introduction
Immunogenic cell death (ICD)1–4 is a special style of cell apoptosis, which releases danger-associated molecular patterns (DAMPs)5,6 and tumor-associated antigens (TAAs).7 DAMPs mainly include calreticulin (CALR),8 high mobility group B1 (HMGB1)9 and adenosine triphosphate (ATP),10 and the release of these three substances represents different “signals”. First, the release of ATP generates a “seeking” signal that induces dendritic cells (DCs) to reach the tumor site.11 Second, CALR migrates from the cytoplasm to the tumor cell membrane, releasing a “phagocytosis” signal that attracts DCs to phagocytose tumor cells.12 Third, HMGB1 is released from the nucleus after tumor cell death, inducing the maturation of DCs,13 so that DCs can present tumor-associated antigens to T cells, promoting T cell activation and differentiation to enhance the tumor immune effect.As a superior ICD inducer, doxorubicin (Dox) is usually used to induce ICD in cancer cells.14 For example, Dox-loaded mesoporous silicon nanoparticles (MSNs) precisely released Dox into the intracellular endo/lysosomal compartment, inducing ICD to promote T cell infiltration.14 A carrier-free nano assembled acid-activated PEG@D:siRNA encompassing the Dox prodrug and small interfering RNA (siRNA) was reported for the combinatorial induction of ICD. PEG@D:siRNA boosted the ICD effect of DOX prodrugs, thereby enhancing anticancer immune responses to inhibit tumor growth.15 The fluorinated mitochondrial disrupting helix polypeptides (MDHPs) initiated the elicitation of ICD mediated by endoplasmic reticulum (ER) stress,16,17 which provided a high helical structure and powerful anti-cancer ability. The helical polypeptide destroyed the stability of the outer mitochondrial membrane, triggering cell apoptosis.
As the outermost barrier of cells, the cell membrane plays an irreplaceable role in protecting cells. It ensures the relative stability of the intracellular environment and enables various biochemical reactions to proceed in an orderly manner, so the destruction of the cell membrane can directly induce the release of DAMPs and resultant ICD. The process includes the colocalization of ICD biomarkers CALR to the cell surface and the rapid release of immunogenic signals including ATP and HMGB1.18,19 Exploiting ultrasonic treatment, reactive oxygen species (ROS) and penetrating peptides,20–22 the cell membrane can be crumbled effectively.23–25 Penetrating peptides are independent of energy and mainly attack cell membranes through the “carpet model”.26 Due to the mutual attraction between the positive charge of the peptide and the negative charge of the phospholipid membrane, the penetrating peptide covers the outer surface of the cell membrane, and then the interaction between the hydrophobic amino acid of the penetrating peptide and the hydrophobic core of the cell membrane leads to the destruction of the cell membrane. However, studies on the induction of ICD by using penetrating peptides have not been reported.
Penetrating peptides are easily decomposed by lysosomal hydrolase, resulting in a low concentration on the cell membrane surface and a short residence time, which cannot effectively crumble the tumor cell membrane. Our previous research revealed that nanofibers designed in an in vivo self-assembly strategy27–32 could significantly elevate the effective concentration and retention time of “functional peptides”.31 Developing cell membrane-specific self-assembly of penetrating peptides to achieve its enrichment and retention is expected to improve the effect of cell membrane disruption.
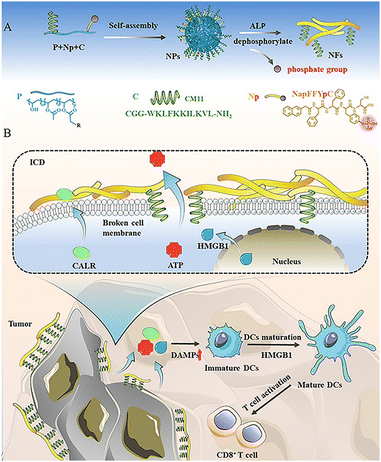
Herein, we design an enzyme-responsive polymer–peptide conjugate (PPC) to damage cancer cell membranes through in situ assembly, triggering ICD and improving cancer therapeutics. We used the peptides CM1133 and NapFFYpC, which were conjugated to poly(vinyl alcohol) (PVA), constructing alkaline phosphatase (ALP)-responsive PPCs as a tumor-suppressing drug named PNpC (Scheme 1A). PNpC nanoparticles initially accumulated at the tumor site by the enhanced permeability and retention (EPR)34,35 effect through intravenous injection. Owing to the presence of specific and highly expressed ALP4,36,37 on the membrane of cancer cells, the morphology changed from nanoparticles to fibrous structures. The exposed CM11 peptide on nanofibers could insert into the cell membrane effectively through the multisite interaction, which destroyed the structure of the cancer cell membrane and triggered the ICD of the tumor cells. The transition from non-immunogenic cell death to immunogenic cell death in cancer cells accelerated the release of DAMPs and further facilitated the activation of DCs in the tumor microenvironment (Scheme 1B). The maturation of DCs enhances the phagocytosis and presentation of tumor-related antigens, promotes the activation and differentiation of effector T cells, improves the efficacy of tumor immunity,38–41 and achieves efficient killing and removal of cancer cells.
Results and discussion
Characterization of PPCs
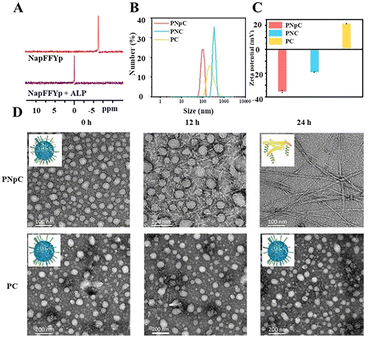
The structure of acryl-PVA was analyzed using 1H NMR spectra, and the modification ratio of the acrylate was 18% (Fig. S1, ESI†). The peptides of CM11 (MW = 1633, Fig. S2, ESI†) and NapFFYpC (MW = 826, Fig. S3, ESI†) were also synthesized successfully. In order to study the ALP-responsive properties, the 31P spectra of the NapFFYpC before and after ALP treatment were first characterized using a 400 MHz NMR spectrometer. The position of the 31P peak at −6 ppm of NapFFYpC shifted to 0 ppm after ALP treatment (Fig. 1A), which proved that NapFFYpC could be dephosphorylated in the presence of ALP. The 1H NMR spectra of PNpC showed that the characteristic peaks of the acrylate double bond around δ = 6.0 ppm disappeared, and the characteristic peaks of the peptides at δ = 7.0–8.0 ppm appeared, which demonstrated that PNpC was successfully synthesized (Fig. S4, ESI†). As a control PPC, PC without the functional peptide of NapFFYpC could not realize ALP-responsive transformation.ALP-responsive assembly of PNpC
PNpC could self-assemble into nanoparticles due to the hydrophilic/hydrophobic balance in aqueous solution with a CMC of 6.54 μM (Fig. S5, ESI†). Measured by DLS, the average particle sizes of PNpC and PC (Fig. 1B) were around 136 ± 60 nm and 355 ± 55 nm, respectively. PNpC solution was added to ALP (2 U mL−1) and incubated at 37 °C for 24 h to generate PNC. And the particle size of PNC was larger than that of PNpC, proving that the PNpC treated with ALP underwent a morphology change. Compared with PC and PNC, PNpC had a smaller size, which was more favorable for circulation in the blood. The zeta potential after ALP treatment of PNpC was negatively charged (Fig. 1C). In contrast, PC was positively charged, because there was no functional peptide of negative NapFFYpC in PC.Furthermore, the morphological images of PNpC and PC under TEM were observed at a higher concentration than the CMC, and the morphological changes of PNpC were observed after adding ALP. The morphology of PNpC changed after ALP incubation, and it was a relatively uniform particle size (Fig. 1D). After adding ALP, the phosphate group was degraded from the Yp in PNpC, and the transformation changed from granular PNpC to fibrous PNC. A mixture of nanoparticles and nanofibers was produced after 12 h of treatment. After adding ALP for 24 h, it was found that all the nanoparticles were transformed into nanofibers.
Cell membrane-specific self-assembly and cytotoxic effect
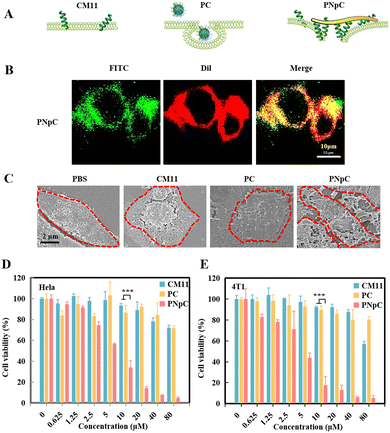
After literature survey and topography analysis, we predicted the schematic diagram of CM11, PC and PNpC on the cell membrane (Fig. 2A). The role of CM11, PC and PNpC in the process of injuring cancer cells was explored through co-localization with the cell membrane (Fig. 2B and S6, ESI†). By analyzing the fluorescence intensity (FITC) of cell sections, there was no difference in the distribution of CM11 and PC on the cell membrane and in the cell, while PNpC was almost all distributed on the cell membrane.The SEM images further proved the assembly morphology change of PNpC (Fig. 2C). For the PNpC group, obvious fibrous structures were observed on the surface of the tumor cell membrane, which were in accordance with the results of fluorescence images. In the presence of ALP on the tumor cell membrane, PNpC nanoparticles transformed into nanofibers, which bound onto the membrane. In contrast, no obvious structures were discovered on the cell membrane treated by PC, because the non-responsive PC nanoparticles were more easily taken up by tumor cells than nanofibers. On the other hand, CM11 peptides might attach onto the tumor cell membrane, but this could not be observed due to the lack of assembly properties.
In order to characterize the enhanced killing effect of membrane-specific self-assembly on tumor cells, HeLa and 4T1 cells were incubated, and the cell viability was measured after 24 h using a CCK-8 kit to reflect the cytotoxicity of peptide nanomedicine. As shown in Fig. 2D and E, PNpC showed an excellent ability in killing tumor cells, and the IC50 for both cells was around 5 μM. The tumor toxicity of the PNpC came from the CM11 peptide, which could easily form holes in the tumor cell membrane, due to the presence of the amphiphilic N-terminus and the secondary structure of the α-helix. However, a higher concentration was required for single molecule CM11 to kill cells, showing an IC50 higher than 80 μM. PC nanoparticles also had lower tumor-killing abilities, which might be attributed to the fact that spherical PC was easier to be endocytosed into tumor cells than fibrous PNpC, reducing the toxicity to tumor cells. Therefore, we could conclude that the dephosphorylation of the assembled peptide NapFFYpC in the presence of ALP abundantly expressed in HeLa and 4T1 cells drove the spherical PNpC to undergo morphological transformation, improving the toxicity to tumor cells through enhanced interaction with the cell membrane.
Cancer cells were incubated with PNpC, CM11 and PC for 24 h and then detected by flow cytometry to analyze the cell death pathways. CM11 induced late apoptosis in 2.97% of HeLa cells and early apoptosis in 2.19% of cells (Fig. S7A, ESI†). PC could cause late apoptosis in 21.7%, early apoptosis in 1.43%, and necrosis in 13.3% of tumor cells. PNpC could cause necrosis in up to 56.9% of cells. The death pathway of 4T1 cells was different from that of HeLa cells (Fig. S7B, ESI†). 95.5% of cells treated with PNpC showed late apoptosis. The ability of PNpC to induce apoptosis and necrosis of both tumor cells was stronger than that of CM11 and PC, which also proved that the killing effect of PPC nanomedicines on tumor cells could be significantly improved through the fibroblast pathway.
Detection of ICD and maturation of DCs in vitro
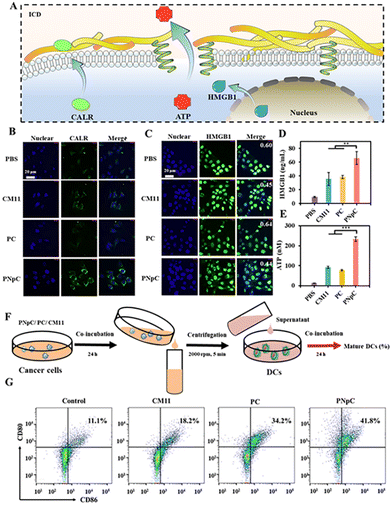
The three indicators were applied to detect the level of ICD, including the migration of CALR to the cell membrane, the release of HMGB1 and ATP (Fig. 3A). As shown in Fig. 3B, tumor cell membranes showed different levels of CALR expression after treatment with PNpC, PC and CM11. Tumor cells treated with PBS were used as negative controls. Through confocal microscopy observation, it could be found that the surface of tumor cells treated with PNpC exhibited the highest CALR content, because the transformable PNpC had a stronger ability to induce ICD in cancer cells than CM11 and PC. Measured by flow cytometry, the expression level of CALR on tumor cell membranes after incubation with PNpC reached 16.1%, which was significantly higher than 8.97% in the PC group and 4.89% in the CM11 group (Fig. S8, ESI†). The above results verified that PNpC had a stronger ability to induce ICD. When cancer cells developed ICD, the HMGB1 would be released from the nucleus, inducing the decreased amount in the nucleus and increased amount in the cytoplasm and outside the cell. Compared with the PBS group, after PNpC, PC and CM11 treatment, the content of HMGB1 in the nucleus of cancer cells was reduced, and HMGB1 protein also appeared in the cytoplasm to different degrees (Fig. 3C). The green fluorescence intensity in the nucleus of cells treated by PNpC was the lowest compared with the PC and CM11 groups, and a stronger green fluorescence also appeared in the cytoplasm. Furthermore, the ELISA test results showed that the extracellular HMGB1 induced by PNpC had a higher concentration of 55.2 ng mL−1 than other groups (Fig. 3D), according to the standard curve of HMGB1 (Fig. S9, ESI†). The amount of HMGB1 released in the PNpC group was 2 times that of the CM11 group and 1.5 times that of the PC group. Therefore, it could be speculated that PNpC with an enzyme-responsive transformable ability had the strongest ICD-inducing ability. The release of ATP from cancer cells was also measured in the extracellular microenvironment. The PNpC treatment group showed the highest extracellular ATP concentration, reaching 233.5 μM, which was twice that of CM11 (Fig. 3E and S10, ESI†). All the results of CALR, HMGB1 and ATP proved that peptide nanomedicine could induce ICD in tumor cells to a certain extent, and PNpC with a cell membrane-specific self-assembly capacity had the strongest ability to induce ICD.As mentioned above, the cancer cells treated by peptide nanomedicines could release DAMPs due to the ICD effect, which might cause the maturation of DCs. The supernatant of PNpC, PC and CM11 treated cancer cells was added into DC2.4 cells (Fig. 3F), and the maturation of DCs was detected by flow cytometry (Fig. 3G). There were 41.8%, 18.2% and 34.2% CD80+ CD86+ cells in the PNpC group, CM11 group and PC group, respectively. All three groups were higher than the PBS group. The above results could prove that the DAMPs released from cancer cells treated with PNpC, PC and CM11 could promote the DC maturation that was positively correlated with the ability to induce ICD. Therefore, the cell membrane-specific self-assembly strategy was beneficial to the ICD of cancer cells and resultant maturation of DCs.
Tumor accumulation and anti-tumor ability of PNpC in vivo
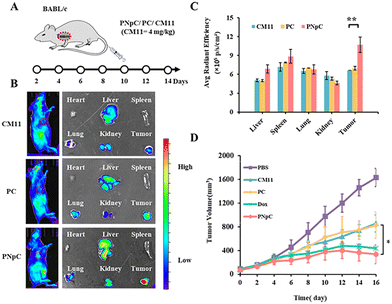
All animal experiments comply with the requirements of the National Institutes of Health Laboratory Animal Protection Regulations and the National Center for Nanoscience and Technology Laboratory Animal Care Committee. The distribution of peptide nanomedicine in mice was analyzed to investigate the targeted accumulation in the tumor site. CM11, PC and PNpC were labeled by the NIR fluorescence probe Cy5 and then injected into the mice through the tail vein, followed by NIR fluorescence imaging in vivo (Fig. 4A and B). It was found that the PNpC treatment group showed obvious fluorescence in the tumor site, which was stronger than that of the PC and CM11 groups. After 24 hours, the organs and tumors were dissected out, and quantitative analysis results of the fluorescence intensity of each organ and tumor are shown in Fig. 4C. The fluorescence intensity of the tumor in the PNpC-treated group was ∼1.5 times higher than that in the CM11 and PC groups, indicating the enhanced accumulation of PNpC in tumor sites. After PNpC reached the tumor site through the blood circulation, the highly expressed ALP on the cell membranes induced the morphology transformation of PNpC, and the resultant fibrous structure could be enriched at the tumor site effectively.The antitumor efficacy of peptide nanomedicines in vivo was evaluated in the treatment of 4T1 tumors. The tumor inhibition effect of PPCs was measured by adding a Dox treatment group, which could also induce the ICD effect.15 Tumor-bearing mice were treated by tail vein injection of CM11, PC, PNpC and Dox (Fig. 4A). The tumor growth rate of the PBS group was significantly faster than that of the other groups and reached more than 1400 mm3 on the 14th day after treatment (Fig. 4D and S11, ESI†). However, the growth rate of tumors in the three groups treated by drugs slowed down significantly, showing the excellent killing effect on tumor cells. Among the three peptide nanomedicines, the PNpC group finally suppressed the tumor volume below 350 mm3, comparable to the Dox group, which displayed a better tumor inhibitory effect than the other two peptide nanomedicines. In the tumor microenvironment, the ALP-responsive PNpC reassembled into nanofibers on the cell membrane, and the enhanced interaction with the cell membrane caused the effective destruction of tumor cells, inducing the ICD effect. The subsequent maturation of distant DCs might increase the efficiency of antigen presentation and promote the activation of tumor immunity.
Detection of ICD and maturation of DCs in vivo
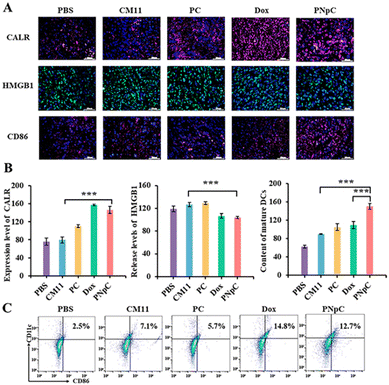
The levels of PNpC, PC and CM11 in inducing ICD of cancer cells were explored in vivo. CALR and HMGB1 in tumor tissues were labeled by immunofluorescence. The immunofluorescence of CALR, HMGB1 and CD 86 in tumor tissues of mice treated with PNpC, PC, CM11 and Dox showed stronger fluorescence than that of the PBS group (Fig. 5A). It was worth noting that the fluorescence intensity of the PNpC group, compared with the DOX group, was ∼1.3 times and ∼2 times stronger than that of the PC group and CM11 group, respectively (Fig. 5B). After treatment with PNpC, PC, CM11 and Dox, it was found that the content of HMGB1 in the nucleus of cancer cells decreased for the Dox group and PNpC group. For the CM11 group and the PC group, there was no obvious extranuclear release of HMGB1 (Fig. 5B). All the phenomena were in accordance with the results in the cell level, further confirming that the transformable ability of PNpC not only significantly improved the killing ability of cancer cells, but also induced tumor cells to develop ICD in vivo.It was verified that tumor cells treated with peptide nanomedicines could significantly promote the maturation of DCs in vitro, which were further investigated in vivo. The maturation of DCs was measured by observing the level of CD86+ cells in the tumor tissue by immunofluorescence. The fluorescence intensity of labeled CD86+ cells in the tumor tissue treated with PNpC and Dox was stronger than that in the CM11 group. Flow cytometry analysis was also performed (Fig. 5C), and the content of CD86+ cells in tumor sites of the PNpC group and Dox group was 12.7% and 14.8%, respectively. The content of mature DCs in the PNpC-treated group was significantly higher than that in the Dox-treated group (Fig. 5B), which proved that PNpC was more capable of triggering the ICD-induced maturation of DCs. All the results proved that PNpC has great potential in promoting the maturation of DCs, which could be attributed to the cell membrane-specific self-assembly triggered ICD effect and resultant release of immunogenic substances DAMPs.
Activation of the immune response by PNpC
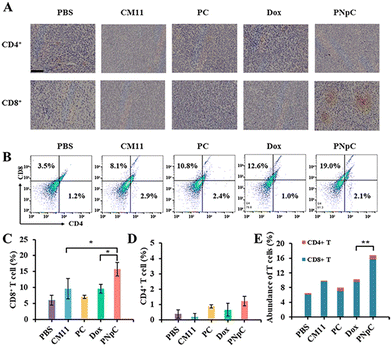
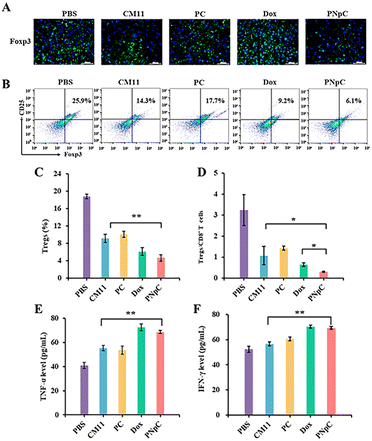
The infiltration of CD8+ T cells and CD4+ T cells in tumor tissue was analyzed by immunohistochemistry. As shown in Fig. 6A, the infiltration degree of CD8+ T cells in the PNpC group was significantly higher than that in other groups, while there was no significant difference in CD4+ T cells. The content of CD8+ T lymphocytes in the tumor tissue microenvironment after treatment with different polypeptide nanomedicines and Dox increased compared with the control group in the PBS-treated group (Fig. 6B–D). Among them, the experimental group with the highest content of CD8+ T cells in the tumor microenvironment was the PNpC-treated group, with the content reaching 19%, while the PBS-treated group was 3.5%, the CM11 group was 8.1%, the PC group was 10.8%, and the Dox group was 12.6% (Fig. 6C). This could be attributed to the fact that PNpC had the strongest ability to induce ICD in tumor cells compared with CM11 and PC. The abundance of immune cells, especially T cell subsets, played a critical role in cancer immunology and therapy. The abundance of T cells was obtained by superimposing the contents of CD8+ T cells and CD4+ T cells (Fig. 6E). The abundance of T cells in the PNpC group was significantly higher than that in the Dox group, proving that the degree of T cell infiltration in the PNpC group was more conducive to inhibiting tumor growth during the treatment process. Compared with Dox, PNpC could promote more T cell infiltration during cancer treatment, especially CD8+ T cells, which is of great significance in cancer treatment.The tumor tissue microenvironment is an immunosuppressive type, and one of the reasons for this phenomenon is the existence of Tregs in the tumor tissue.42 In the process of tumor immune escape, Tregs can secrete TGF-β, IL-10 and IL-35, down-regulate anti-tumor immunity, and inhibit the antigen-presenting ability of DCs and the differentiation of CD8+ T cells.42 To evaluate the level of immunosuppression at the tumor site in each group after treatment, CD25+ Foxp3+ cells in tumor tissue sections were labelled by immunofluorescence, showing that the green fluorescence of peptide nanomedicine was significantly lower than that of the PBS-treated group, which proved that Tregs infiltration in the tumor tissue microenvironment was reduced, and the effect on tumor immunosuppression was weakened (Fig. 7A). The content of Tregs in the tumor microenvironment was assessed by flow cytometry and immunofluorescence. It could be determined that the content of Tregs in tumor tissue was significantly reduced after treatment with peptide nanomedicine, and the PNpC group exhibited the strongest weakening of immunosuppression (Fig. 7B). Compared with that in the CM11 group, the Tregs content was reduced from 14.3% to 6.1%, and the decrease in the Tregs content could also provide auxiliary support for the PNpC-treated group to inhibit tumor proliferation. Quantitative analysis of the green fluorescence of labeled Tregs showed that the Tregs content of the PNpC-treated group was slightly lower than that of the Dox-treated group, and was significantly lower than that of the CM11-treated group (Fig. 7C). PNpC could significantly reduce the content of Tregs in tumor tissue during cancer treatment, and the effect was superior to Dox. Tregs/CD8+ ratio is an important parameter to evaluate the effect of immunotherapy. The lower the ratio the better the immunotherapy effect. The Tregs/CD8+ ratio in the PNpC treatment group was lower than that in the Dox treatment group, proving that PNpC has greater potential than Dox in the application of immune management (Fig. 7D).
T lymphocytes can kill tumor cells by releasing anti-tumor cytokines TNF-α and IFN-γ in serum, so the level of TNF-α and IFN-γ can reflect the anti-tumor immune effect of the body. The levels of TNF-α and IFN-γ in the serum of mice in different treatment groups were measured using ELISA (Fig. 7E and F). All the CM11, PC, PNpC and Dox treatment groups showed higher levels of TNF-α and IFN-γ than the PBS group. The level of IFN-γ was higher for PNpC and Dox groups. It was worth noting that the serum of the PNpC-treated group showed comparable levels of tumor necrosis factor and interferon to the anticancer drug Dox, which could also explain that the tumor-suppressive effect was significantly stronger than that of the CM11-treated group.
Toxicity profile
For in vivo application, the stability profiles of PNpC and PC in PBS were determined (Fig. S12, ESI†), and the size remained stable in 7 days. Owing to its amphipathic N-terminal and α-helix secondary structure, pure CM11 could easily lead to red blood cell membrane disruption and hemolysis (Fig. S13, ESI†). However, PNpC and PC showed a very low hemolysis rate (<5%), even if the concentration reached 1 mg mL−1, which could be attributed to the better hemocompatibility of PNpC and PC after assembly into nanoparticles compared with the fully exposed peptide CM11 (Fig. S14, ESI†). PNpC and PC showed negligible cytotoxicity toward L929 cells in vitro, implying their good biocompatibility (Fig. S15, ESI†). In order to evaluate the biosafety of nanodrugs, the body weight of the tumor-bearing mice was recorded (Fig. S16, ESI†), and the mice treated with Dox showed a slight decrease in body weight on day 8 and began to recover slowly on day 14. Moreover, the levels of blood urea nitrogen (BUN), bilirubin, aspartate aminotransferase (AST), and alanine aminotransferase43 in all individuals were within the normal range (Fig. S17, ESI†).Furthermore, the H&E histopathological staining results of the main organs of tumor-bearing mice, including the heart, liver, spleen, lungs, and kidneys, showed that there was no significant difference in the organs of the CM11, PC, and PNpC-treated groups compared with the PBS-treated group (Fig. S18, ESI†). Therefore, the peptide nanomedicine did not cause systemic toxicity in mice.
Conclusions
PNpC can be converted from nanoparticles to nanofibers in the presence of ALP, which enhances its tumor cytotoxicity, ICD initiation efficiency, and its enrichment ability in tumor tissue. The self-assembly strategy can increase the release of DAMPs, thereby promoting the maturation of DCs. PNpC exhibited a stronger ICD-inducing ability and tumor-suppressing ability than other experimental groups in vivo, which could increase the content of effector T cells and mature DCs in tumor tissue, and did not increase the content of Tregs, enhancing the tumor immune effect. Therefore, the cell membrane-specific self-assembly strategy shows great potential for developing novel peptide nanomedicine to enhance cancer immunotherapy.Author contributions
Pengsheng Fan and Yinghua Guan contributed equally to this paper.Conflicts of interest
There are no conflicts to declare.Acknowledgements
This research was supported by the National Key R&D Program of China (2021YFB3801002), the National Natural Science Foundation of China (22222503), the Strategic Priority Research Program of Chinese Academy of Sciences (XDB36000000, the Beijing Nova Program of Science and Technology (Z211100002121148), the Natural Science Foundation of Shangdong Province (ZR2021MC127) and Qingdao Marine Science and Technology Center Shandong Province Special Fund “Frontier Technology Free Exploration” (No. 12-04). Z.-Y. Q. thanks the Youth Innovation Promotion Association, CAS.References
- S. D. Jeong, B. K. Jung, H. M. Ahn, D. Lee, J. Ha, I. Noh, C. O. Yun and Y. C. Kim, Adv. Sci., 2021, 8, 2001308 CrossRef CAS PubMed.
- S. Sen, M. Won, M. S. Levine, Y. Noh, A. C. Sedgwick, J. S. Kim, J. L. Sessler and J. F. Arambula, Chem. Soc. Rev., 2022, 51, 1212–1233 RSC.
- S. Zhang, J. Wang, Z. Kong, X. Sun, Z. He, B. Sun, C. Luo and J. Sun, Biomaterials, 2022, 282, 121433 CrossRef CAS PubMed.
- S. Ji, J. Li, X. Duan, J. Zhang, Y. Zhang, M. Song, S. Li, H. Chen and D. Ding, Angew. Chem., Int. Ed., 2021, 60, 26994–27004 CrossRef CAS PubMed.
- D. V. Krysko, A. D. Garg, A. Kaczmarek, O. Krysko, P. Agostinis and P. Vandenabeele, Nat. Rev. Cancer, 2012, 12, 860–875 CrossRef CAS PubMed.
- D. R. Green, T. Ferguson, L. Zitvogel and G. Kroemer, Nat. Rev. Immunol., 2009, 9, 353–363 CrossRef CAS PubMed.
- M. H. Andersen, I. M. Svane, J. C. Becker and P. T. Straten, Clin. Cancer Res., 2007, 13, 5991–5994 CrossRef CAS PubMed.
- J. Fucikova, R. Spisek, G. Kroemer and L. Galluzzi, Cell Res., 2021, 31, 5–16 CrossRef CAS PubMed.
- A. Tripathi, K. Shrinet and A. Kumar, Toxicol. Reptiles, 2019, 6, 253–261 CAS.
- I. Martins, Y. Wang, M. Michaud, Y. Ma, A. Q. Sukkurwala, S. Shen, O. Kepp, D. Metivier, L. Galluzzi, J. L. Perfettini, L. Zitvogel and G. Kroemer, Cell Death Differ., 2014, 21, 79–91 CrossRef CAS PubMed.
- D. H. Charych, U. Hoch, J. L. Langowski, S. R. Lee, M. K. Addepalli, P. B. Kirk, D. Sheng, X. Liu, P. W. Sims, L. A. VanderVeen, C. F. Ali, T. K. Chang, M. Konakova, R. L. Pena, R. S. Kanhere, Y. M. Kirksey, C. Ji, Y. Wang, J. Huang, T. D. Sweeney, S. S. Kantak and S. K. Doberstein, Clin. Cancer Res., 2016, 22, 680–690 CrossRef CAS PubMed.
- M. Obeid, A. Tesniere, F. Ghiringhelli, G. M. Fimia, L. Apetoh, J. L. Perfettini, M. Castedo, G. Mignot, T. Panaretakis, N. Casares, D. Metivier, N. Larochette, P. van Endert, F. Ciccosanti, M. Piacentini, L. Zitvogel and G. Kroemer, Nat. Med., 2007, 13, 54–61 CrossRef CAS PubMed.
- C. W. J. Bell, W. Reich, C. F. 3Rd and D. S. Pisetsky, Am. J. Physiol.: Cell Physiol., 2006, 291, C1318–1325 CrossRef CAS PubMed.
- Q. Li, J. Liu, H. Fan, L. Shi, Y. Deng, L. Zhao, M. Xiang, Y. Xu, X. Jiang, G. Wang, L. Wang and Z. Wang, Biomaterials, 2021, 269, 120388 CrossRef CAS PubMed.
- S. Chen, D. Li, X. Du, X. He, M. Huang, Y. Wang, X. Yang and J. Wang, Nano Today, 2020, 35, 100924 CrossRef CAS.
- L. Qiao, X. Shao, S. Gao, Z. Ming, X. Fu and Q. Wei, Colloids Surf., B, 2021, 208, 112046 CrossRef CAS PubMed.
- M. J. R. Tham, M. V. Babak and W. H. Ang, Angew. Chem., Int. Ed., 2020, 59, 19070–19078 CrossRef CAS PubMed.
- M. Ogawa, Y. Tomita, Y. Nakamura, M. J. Lee, S. Lee, S. Tomita, T. Nagaya, K. Sato, T. Yamauchi, H. Iwai, A. Kumar, T. Haystead, H. Shroff, P. L. Choyke, J. B. Trepel and H. Kobayashi, Oncotarget, 2017, 8, 10425–10436 CrossRef PubMed.
- M. Bretscher, Sci. Am., 1985, 253, 100–109 CrossRef CAS PubMed.
- D. S. D'Astolfo, R. J. Pagliero, A. Pras, W. R. Karthaus, H. Clevers, V. Prasad, R. J. Lebbink, H. Rehmann and N. Geijsen, Cell, 2015, 161, 674–690 CrossRef PubMed.
- M. P. Stewart, A. Sharei, X. Ding, G. Sahay, R. Langer and K. F. Jensen, Nature, 2016, 538, 183–192 CrossRef CAS PubMed.
- C. Douat, C. Aisenbrey, S. Antunes, M. Decossas, O. Lambert, B. Bechinger, A. Kichler and G. Guichard, Angew. Chem., Int. Ed., 2015, 54, 11133–11137 CrossRef CAS PubMed.
- P. S. J. P. Allison, Science, 2015, 348, 56–61 CrossRef PubMed.
- O. Kepp, L. Menger, E. Vacchelli, C. Locher, S. Adjemian, T. Yamazaki, I. Martins, A. Q. Sukkurwala, M. Michaud, L. Senovilla, L. Galluzzi, G. Kroemer and L. Zitvogel, Cytokine Growth Factor Rev., 2013, 24, 311–318 CrossRef CAS PubMed.
- D. T. Rutkowski and R. J. Kaufman, Trends Cell Biol., 2004, 14, 20–28 CrossRef CAS PubMed.
- M. Heiat, H. Aghamollaei, M. M. Moghaddam and H. Kooshki, Minerva Biotechnol., 2014, 26, 149–157 Search PubMed.
- P. P. He, X. D. Li, L. Wang and H. Wang, Acc. Chem. Res., 2019, 52, 367–378 CrossRef CAS PubMed.
- X. Du, J. Zhou, H. Wang, J. Shi, Y. Kuang, W. Zeng, Z. Yang and B. Xu, Cell Death Dis., 2017, 8, e2614 CrossRef CAS PubMed.
- Z. Feng, H. Wang, S. Wang, Q. Zhang, X. Zhang, A. A. Rodal and B. Xu, J. Am. Chem. Soc., 2018, 140, 9566–9573 CrossRef CAS PubMed.
- Z. Feng, H. Wang, X. Chen and B. Xu, J. Am. Chem. Soc., 2017, 139, 15377–15384 CrossRef CAS PubMed.
- W. Y. Xiao, Y. Wang, H. W. An, D. Hou, M. Mamuti, M. D. Wang, J. Wang, W. Xu, L. Hu and H. Wang, ACS Appl. Mater. Interfaces, 2020, 12, 40042–40051 CrossRef CAS PubMed.
- X.-G. C. Ya Liu and Hao Wang, J. Controlled Release, 2017, 259, e161–e162 Search PubMed.
- M. M. Moghaddam, F. Abolhassani, H. Babavalian, R. Mirnejad, K. Azizi Barjini and J. Amani, Probiotics Antimicrob. Proteins, 2012, 4, 133–139 CrossRef CAS PubMed.
- T. Stylianopoulos, Ther. Delivery, 2013, 4, 421–423 CrossRef CAS PubMed.
- J. W. H. Maeda, T. Sawa, Y. Matsumura and K. Hori, J. Controlled Release, 2000, 65, 271–284 CrossRef PubMed.
- Q. Yao, Z. Huang, D. Liu, J. Chen and Y. Gao, Adv. Mater., 2019, 31, e1804814 CrossRef PubMed.
- C. Liang, D. Zheng, F. Shi, T. Xu, C. Yang, J. Liu, L. Wang and Z. Yang, Nanoscale, 2017, 9, 11987–11993 RSC.
- C. S. Yuan, Z. Teng, S. Yang, Z. He, L. Y. Meng, X. G. Chen and Y. Liu, J. Controlled Release, 2022, 351, 255–271 CrossRef CAS PubMed.
- T. Wang, Z. He, C. S. Yuan, Z. W. Deng, F. Li, X. G. Chen and Y. Liu, J. Controlled Release, 2022, 343, 765–776 CrossRef CAS PubMed.
- Y. H. Guan, N. Wang, Z. W. Deng, X. G. Chen and Y. Liu, Biomaterials, 2022, 282, 121434 CrossRef CAS PubMed.
- Z.-W. Deng, C.-S. Yuan, T. Wang, X.-G. Chen and Y. Liu, Appl. Mater. Today, 2021, 23, 101063 CrossRef.
- C. Li, P. Jiang, S. Wei, X. Xu and J. Wang, Mol. Cancer, 2020, 19, 116 CrossRef PubMed.
- L. Galluzzi, I. Vitale, S. A. Aaronson, J. M. Abrams, D. Adam, P. Agostinis, E. S. Alnemri, L. Altucci, I. Amelio, D. W. Andrews, M. Annicchiarico-Petruzzelli, A. V. Antonov, E. Arama, E. H. Baehrecke, N. A. Barlev, N. G. Bazan, F. Bernassola, M. J. M. Bertrand, K. Bianchi, M. V. Blagosklonny, K. Blomgren, C. Borner, P. Boya, C. Brenner, M. Campanella, E. Candi, D. Carmona-Gutierrez, F. Cecconi, F. K. Chan, N. S. Chandel, E. H. Cheng, J. E. Chipuk, J. A. Cidlowski, A. Ciechanover, G. M. Cohen, M. Conrad, J. R. Cubillos-Ruiz, P. E. Czabotar, V. D'Angiolella, T. M. Dawson, V. L. Dawson, V. De Laurenzi, R. De Maria, K. M. Debatin, R. J. DeBerardinis, M. Deshmukh, N. Di Daniele, F. Di Virgilio, V. M. Dixit, S. J. Dixon, C. S. Duckett, B. D. Dynlacht, W. S. El-Deiry, J. W. Elrod, G. M. Fimia, S. Fulda, A. J. Garcia-Saez, A. D. Garg, C. Garrido, E. Gavathiotis, P. Golstein, E. Gottlieb, D. R. Green, L. A. Greene, H. Gronemeyer, A. Gross, G. Hajnoczky, J. M. Hardwick, I. S. Harris, M. O. Hengartner, C. Hetz, H. Ichijo, M. Jaattela, B. Joseph, P. J. Jost, P. P. Juin, W. J. Kaiser, M. Karin, T. Kaufmann, O. Kepp, A. Kimchi, R. N. Kitsis, D. J. Klionsky, R. A. Knight, S. Kumar, S. W. Lee, J. J. Lemasters, B. Levine, A. Linkermann, S. A. Lipton, R. A. Lockshin, C. Lopez-Otin, S. W. Lowe, T. Luedde, E. Lugli, M. MacFarlane, F. Madeo, M. Malewicz, W. Malorni, G. Manic, J. C. Marine, S. J. Martin, J. C. Martinou, J. P. Medema, P. Mehlen, P. Meier, S. Melino, E. A. Miao, J. D. Molkentin, U. M. Moll, C. Munoz-Pinedo, S. Nagata, G. Nunez, A. Oberst, M. Oren, M. Overholtzer, M. Pagano, T. Panaretakis, M. Pasparakis, J. M. Penninger, D. M. Pereira, S. Pervaiz, M. E. Peter, M. Piacentini, P. Pinton, J. H. M. Prehn, H. Puthalakath, G. A. Rabinovich, M. Rehm, R. Rizzuto, C. M. P. Rodrigues, D. C. Rubinsztein, T. Rudel, K. M. Ryan, E. Sayan, L. Scorrano, F. Shao, Y. Shi, J. Silke, H. U. Simon, A. Sistigu, B. R. Stockwell, A. Strasser, G. Szabadkai, S. W. G. Tait, D. Tang, N. Tavernarakis, A. Thorburn, Y. Tsujimoto, B. Turk, T. Vanden Berghe, P. Vandenabeele, M. G. Vander Heiden, A. Villunger, H. W. Virgin, K. H. Vousden, D. Vucic, E. F. Wagner, H. Walczak, D. Wallach, Y. Wang, J. A. Wells, W. Wood, J. Yuan, Z. Zakeri, B. Zhivotovsky, L. Zitvogel, G. Melino and G. Kroemer, Cell Death Differ., 2018, 25, 486–541 CrossRef PubMed.
Footnotes |
| † Electronic supplementary information (ESI) available. See DOI: https://doi.org/10.1039/d3nh00173c |
| ‡ Pengsheng Fan and Yinghua Guan contributed equally to this paper. |
| This journal is © The Royal Society of Chemistry 2023 |

