
Molecular transformation and metabolic insights of microbial electrolysis treatment and valorization of post-hydrothermal liquefaction wastewater†
Jinyue
Jiang
ab,
Juan A.
Lopez-Ruiz
 c,
Aaron
Leininger
ab,
Lin
Du
ab,
Yuqing
Yan
ab,
Harold D.
May
b and
Zhiyong Jason
Ren
*ab
c,
Aaron
Leininger
ab,
Lin
Du
ab,
Yuqing
Yan
ab,
Harold D.
May
b and
Zhiyong Jason
Ren
*ab
aDepartment of Civil and Environmental Engineering, Princeton University, Princeton, NJ 08544, USA. E-mail: zjren@princeton.edu
bThe Andlinger Center for Energy and the Environment, Princeton University, Princeton, NJ 08544, USA
cInstitute for Integrated Catalysis, Energy and Environment Directorate, Pacific Northwest National Laboratory, 902 Battelle Blvd., Richland, WA 99352, USA
First published on 5th September 2023
Abstract
Hydrothermal liquefaction presents a promising approach for the conversion of wet waste into biocrude and biofuels. However, the post-hydrothermal liquefaction wastewater poses significant challenges for treatment and valorization due to its high concentration and complex nature. In this study, we investigated the conversion pathways of major organic contaminants within the microbial electrolytic treatment of wastewater from food waste hydrothermal liquefaction. To achieve this, we employed high-performance liquid chromatography and 2D nuclear magnetic resonance. Our findings demonstrate volatile fatty acids and monohydric and polyhydric alcohols were effectively transformed through the synergistic metabolism of fermentative and electroactive bacteria, which led to over 70% chemical oxygen demand removal of the recalcitrant compounds and a record high H2 production rate (1.62 L L−1 d−1). We also employed the liquid-state 15N nuclear magnetic resonance on wastewater samples for the first time and revealed that the nitrogen-containing heteroaromatics were persistent to microbial electrochemical treatment. By integrating the chemical profiles with bioanode community profiles, we constructed a metabolic network that provides insights for enhancing treatment efficiency and facilitating resource recovery.
1. Introduction
The urgent needs for carbon circularity highlight the necessity for clean energy alternatives beyond conventional fossil fuels. Among these alternatives, hydrothermal liquefaction (HTL) emerged as a promising technology for converting wet waste, such as food waste, algal biomass, and animal manure into biocrude, which can be further refined into jet fuel through hydrotreatment using H2 as a reducing agent.1 However, the HTL process generates a highly concentrated stream, known as post-hydrothermal liquefaction wastewater (PHW), which has high organic concentrations and high N content. According to the U.S. Department of Energy (DOE), the valorization of PHW is one of the key improvements that need to be made to achieve the targeted fuel selling price of $3 per gallon gasoline equivalent performance goal.2 Previous study identified a wide array of organic molecules including carboxylic acids, alcohols, ketones, aldehydes, phenolics, esters, ethers, amides and heterocyclic compounds as the primary constituents of PHW.3 The complex organic matrix, particularly the nitrogenous organic compounds, pose challenges to traditional wastewater treatment and exhibit potential cytotoxicity.4Previous studies have explored various approaches for PHW treatment, and extraction of value-added chemicals was reported from PHW derived from simple substrates such as rice straw5,6 or with model PHW solution.7 However, the complexity of PHW presents barriers in terms of increased separation cost and difficulty. Gasification, for example, can reduce organics while producing H2 and CH4,8–10 but the energy needs for drying and operation can be prohibitive. Anaerobic fermentation, on the other hand, converts organics to CH4-rich biogas, but the performance was inhibited due to PHW toxicity.11,12 Microbial electrolysis cells (MECs) has been recently investigated in treating recalcitrant wastewater and recovering high rate H2,13–16 and it demonstrated a good synergy with HTL, because not only the aqueous phase can be cleaned via microbial electrochemical process, the produced high quality H2 can be used onsite for biocrude upgrading. For instance, Shen et al. reported MEC treatment of swine manure PHW with an excellent COD removal of 97.87 ± 0.13% after serious dilutions.17 In addition, a moderate H2 production rate of 168.01 ± 7.01 mL L−1 d−1 was achieved.18 However, almost all studies only reported the general metrics such as COD, total organic carbon (TOC) or total nitrogen (TN), but little is known about the constituents of the organics and nitrogen species and how they are transformed during these treatment processes. Such knowledge is critical in understanding the conversion pathways especially for those recalcitrant compounds and helping to develop more efficient technologies.
In this study, we demonstrated that MEC could achieve high-rate H2 production using PHW as the sole substrate. Moreover, for the first time we studied the evolution of PHW chemical profile during MEC treatment by using a combination of high-performance liquid chromatography (HPLC), nuclear magnetic resonance (NMR) and gas chromatography/mass spectroscopy (GC-MS). We deciphered the transformation processes and mechanisms of volatile fatty acids (VFAs) and mono- and polyhydric alcohols, and we identified that heterocyclic nitrogen compounds were recalcitrant to MEC treatment. We further analyzed and correlated the anode biofilm ecology with chemical profile changes. The transformation patterns outlined in the study will guide the future development and optimization of MEC and other PHW treatment technologies, and the methodology described herein extends beyond the scope of this work and presents a compelling paradigm for understanding the transformation pathways.
2. Experimental section
2.1. HTL PHW feedstock
The HTL system used in generating the PHW is located at the Process Development Laboratory in the Pacific Northwest National Laboratory (PNNL). Food waste slurry Engineered Bioslurry (EBS®) was obtained from Waste Management Inc. as the HTL feedstock. The slurry was pretreated with JWC muffin monster and Hockmeyer immersion mill to improve homogeneity and pumpability. The modular HTL system is divided into areas for feedstock preparation and staging, hydrothermal liquefaction, and product separation. The feed rate was set at 12 L h−1 with a liquid hourly space velocity of 4 L L−1 h−1. The HTL was performed at a temperature of 349 °C and a pressure of 192 bar (2790 psig), with a time on stream of 24 h. The generated PHW was collected and stored in −20 °C before shipping for MEC studies.2.2. MEC construction and operation
Two-chamber MECs were used for all the PHW experiments. The cell modules are acrylic cubes with cylindrical inner chamber of 5 cm diameter. Carbon brush anodes (5 cm in diameter, 5 cm in length) and platinized titanium sheet cathodes (Fuel Cell Store, USA) with a dimension of 3 × 4 cm were used in all tests. The anode and cathode chambers have a working volume of 90 mL and 30 mL respectively, and are separated with a bipolar membrane (Fumasep FBM, FumaTech, Germany) to balance out pH gradient. Anodic effluent containing electroactive microbes from other operating MEC reactors was used as the inoculum source, which was mixed with standard MEC anolyte (1![[thin space (1/6-em)]](https://www.rsc.org/images/entities/char_2009.gif) :10 v/v) with sodium acetate as the electron donor. Phosphate buffer solution (PBS) was used as catholyte. The anode was poised at a constant potential of −0.35 V vs. Ag/AgCl using a potentiostat (Biologic, France) during inoculation with a three-electrode setting. After a stable current profile was obtained, a power source was used to provide the external poise of each reactor. The scanning electron microscope (SEM) images of the anode brush were obtained using FEI Quanta ESEM. Prior to imaging, the carbon brush samples were dried and then sputter coated with approximately 3 nm of iridium (Leica EM ACE600).19
:10 v/v) with sodium acetate as the electron donor. Phosphate buffer solution (PBS) was used as catholyte. The anode was poised at a constant potential of −0.35 V vs. Ag/AgCl using a potentiostat (Biologic, France) during inoculation with a three-electrode setting. After a stable current profile was obtained, a power source was used to provide the external poise of each reactor. The scanning electron microscope (SEM) images of the anode brush were obtained using FEI Quanta ESEM. Prior to imaging, the carbon brush samples were dried and then sputter coated with approximately 3 nm of iridium (Leica EM ACE600).19
When conducting MEC experiments using PHW as feedstock, we first diluted PHW using PBS with different dilution ratios (10×, 20× and 40×) as noted in the results section. Different concentrations of PBS (pH = 7.05 ± 0.05) were tested: 20 mM, 50 mM, and 100 mM. 100 mM PBS is composed of 9.16 g L−1 Na2HPO4 and 4.90 g L−1 NaH2PO4, and other concentrations were prepared by proportional dilutions. The concentration of PBS used in each reactor was consistent, i.e., if a reactor was inoculated using 50 mM PBS, then it was also tested using 50 mM PBS for dilution and as catholyte. The produced H2 was collected using a 100 mL gas bag (Calibrated Instruments, USA) attached to the gas-tight cathode chamber. The gas composition was analyzed with a gas chromatography equipped with a TCD detector and with ultra-high purity nitrogen as carrier gas (SRI 310, SRI Instrument, USA). The H2 production rate is calculated by:
The COD to H2 yield (kg-H2 per kg-COD) is calculated as follows:
The cathodic H2 recovery (rcat) is calculated as follows:
 485 C mol−1).
All experiments were conducted in triplicate reactors under 25 °C. The reactors were operated in batch mode where the electrolyte was changed every five days, except for parameter optimization experiments where the electrolyte was changed after each day.
2.3. Chemical characterization
The raw PHW and treated effluent from MEC were analyzed by a HPLC (Agilent 1260 Infinity II, Agilent Technologies, USA) with an ion-exclusion column (Hi-Plex H, Agilent Technologies, USA) and a refractive index detector. 4 mM H2SO4 solution was used as mobile phase running at a flow rate of 0.6 mL min−1. External standards were used to establish elution time as well as standard curves for calculating concentrations from signal area. COD, total nitrogen (TN), ammonia-nitrogen (NH3-N) and nitrate-nitrogen (NO3-N) were measured using standard Hach TNT and TNTplus protocol (Hach Company, USA). Organic nitrogen (ORG-N) concentrations were calculated by subtracting NH3-N and NO3-N concentrations from TN concentrations. Nitrite-nitrogen concentrations were always below detection limit for all samples. The dissolved organic carbon (DOC) and inorganic carbon (IC) concentrations were determined by a TOC analyzer (Shimadzu, Japan).The heterocyclic compounds were analyzed using Agilent 5975C GC-MS with Agilent HP-5MS 30 m × 0.25 mm × 0.25 μm film thickness with helium as carrier gas at 1.0 mL min−1. Oven temperature was initially held for 0.1 min at 35 °C, ramped at 6 °C min−1 with a final temperature of 325 °C. Final oven hold of 1 minute was used. The inlet was heated at 270 °C and 1 μL of sample was injected using a splitless injection.
To prepare the samples for NMR characterization, we first filtered PHW through 0.22 μm filter, then pipette 5 mL of filtrate to a tube. We then froze-dry the samples overnight and redissolve the sample with D2O (3 mL unless otherwise noted). The sample was then transferred to an NMR tube. 1H, 1H–13C HSQC NMR experiments were conducted using a 500 MHz instrument equipped with cryoprobe (Bruker, USA). The number of scans were 16 times with 1024 points in the 1H dimension and 512 points in the 13C dimension. The pulse delay time was 1.3 s. For 1H–15N heteronuclear multiple bond correlation (HMBC) experiments, a 10 times higher concentration factor is used by increasing the amount of filtrate while using the same amount of D2O. The number of scans were 16 times with 2048 points in the 1H dimension and 512 points in the 15N dimension for HMBC experiments. The pulse delay was 1.7 s. The acquired spectra were then processed with Mnova software following standard processing steps including apodization, zero filling and phase correction.
2.4. Microbial community characterization
We collected microbial samples from carbon brushes and electrolyte at two time points: (1) after a stable current was obtained from inoculation, but before supplying PHW as electrolyte, referred to as “before exposure to PHW”; (2) at the end of the experimental period, referred to as “after exposure to PHW”. Genomic DNA was extracted from 0.25 g of carbon brush samples using DNeasy PowerSoil kits (Qiagen) and the concentrations were measured using a Qubit 2.0 fluorometer. Library preparation and paired-end amplicon sequencing of the V4 region of the 16S rRNA genes were performed on Illumina MiSeq (2 × 150 bp) at the Lewis-Sigler Institute for Integrative Genomics at Princeton University.Raw sequencing reads was then analyzed using DADA2 pipeline to construct amplicon sequence variants (ASV).20 The taxonomic assignment of ASVs was conducted using the SILVA database (Version 138.1). Community analysis was conducted in R using the phyloseq package.21 The metabolic network was constructed by first consolidating the metabolites identified through HPLC, and the microbial genera identified through 16S rRNA genes sequencing. Then we list possible metabolic pathways of these genera which involves the identified metabolites through metabolic pathway database MetaCyc (https://metacyc.org/). Following trimming repetitive pathways and abbreviating long pathways, we proposed the metabolic network.
3. Results and discussion
3.1. PHW characterization and treatment by MEC
The detailed characteristics of the PHW generated from HTL processing food waste are shown in Table S1.† The wastewater contained highly concentrated organics, and the COD value was 57500 ± 200 mg L−1, approximately two orders of magnitude higher than domestic wastewater. The DOC content of the PHW was 17853 ± 287 mg L−1. The COD and DOC value combined will give an average degree of reduction of carbon of 4.8, marking the average carbon in PHW is slightly more reduced than biomass. The water was slightly alkalic with a pH of 7.97, and the conductivity was 18.4 mS cm−1, indicating high ionic strength. Both inorganic salts and ionizable organic compounds such as VFAs contribute to the conductivity. The total inorganic concentration of the PHW was 404 ± 12 mg L−1, which includes carbonate (CO32−), bicarbonate (HCO3−) and dissolved CO2. The high conductivity and high alkalinity are beneficial to MEC treatment, as they facilitate electron transfer and provide high buffering capacity to alleviate pH gradient between electrode chambers.22,23
A tailored HPLC database was built to characterize the organic compounds in the PHW (Table S2†), and volatile fatty acids (VFAs) and alcohols were identified as the primary organic groups. Acetate (4319 ± 6 mg L−1) and glycerol (4992 ± 253 mg L−1) were the species that had the highest concentrations. VFAs such as acetate were generated during HTL via several different routes, including hydrolysis of lipid and deamination of amino acids.1 Acetate could also originate from the acetyl group of the hemicellulose backbone.24 Glycerol, on the other hand, almost exclusively came from the hydrolysis of lipids. The high concentration of glycerol also indicates a high proportion of lipids in the original food waste feedstock. Besides acetate, other VFAs such as propionate, butyrate and isovalerate are also present in significant amounts. Longer-chain VFAs, on the other hand, tend to partition into the biocrude phase instead of aqueous phase. It is worth noting that 1,3-propanediol (1,3-PDO), a valuable platform chemical, is also present in high concentration (1247 ± 17 mg L−1). 1,3-PDO is a three-carbon diol with one less hydroxyl group than glycerol and is well known as a glycerol fermentation product.25 However, to the best of our knowledge, the production pathway for 1,3-PDO during HTL has not been reported or studied, and thus warrants future investigation.
Interestingly, mono- and di-saccharides such as glucose, fructose and sucrose were not detected in appreciable amounts. These saccharides are formed from hydrolysis of lignocelluloses and non-cellulosic carbohydrates, but they can also undergo further transformation in HTL process. Previous literature reported a relationship between HTL reaction temperature and glucose concentration in the PHW, with lower temperature (200 °C) led to higher glucose concentration.26 Our PHW was produced from high-temperature HTL (349 °C), so it is likely mono- and disaccharides have undergone further transformations.
The TN concentration in the PHW was 2812 ± 101 mg L−1, which was mostly contributed by ORG-N and NH3-N. NH3-N is typically high in PHW as deamination of protein would result in ammonia production. The high concentration of organic nitrogen is another distinct feature of PHW and poses major challenges to its treatment, because such compounds are rarely present in common wastewater streams that most technologies are not designed to remove them. We summarized the COD and TN profile of the PHW used in this study along with other literature values in Fig. 1A. The PHW used here exhibits similar COD and TN concentration to PHW derived from manure, sludge, and lignocellulose feedstock. However, the TN concentration is relatively low compared to PHW derived from algal biomass because of the lower proportion of protein in the feedstock. For fast-growing microalgae strains, protein is typically the dominant organic compound, a characteristic that does not extend to mixed food waste.
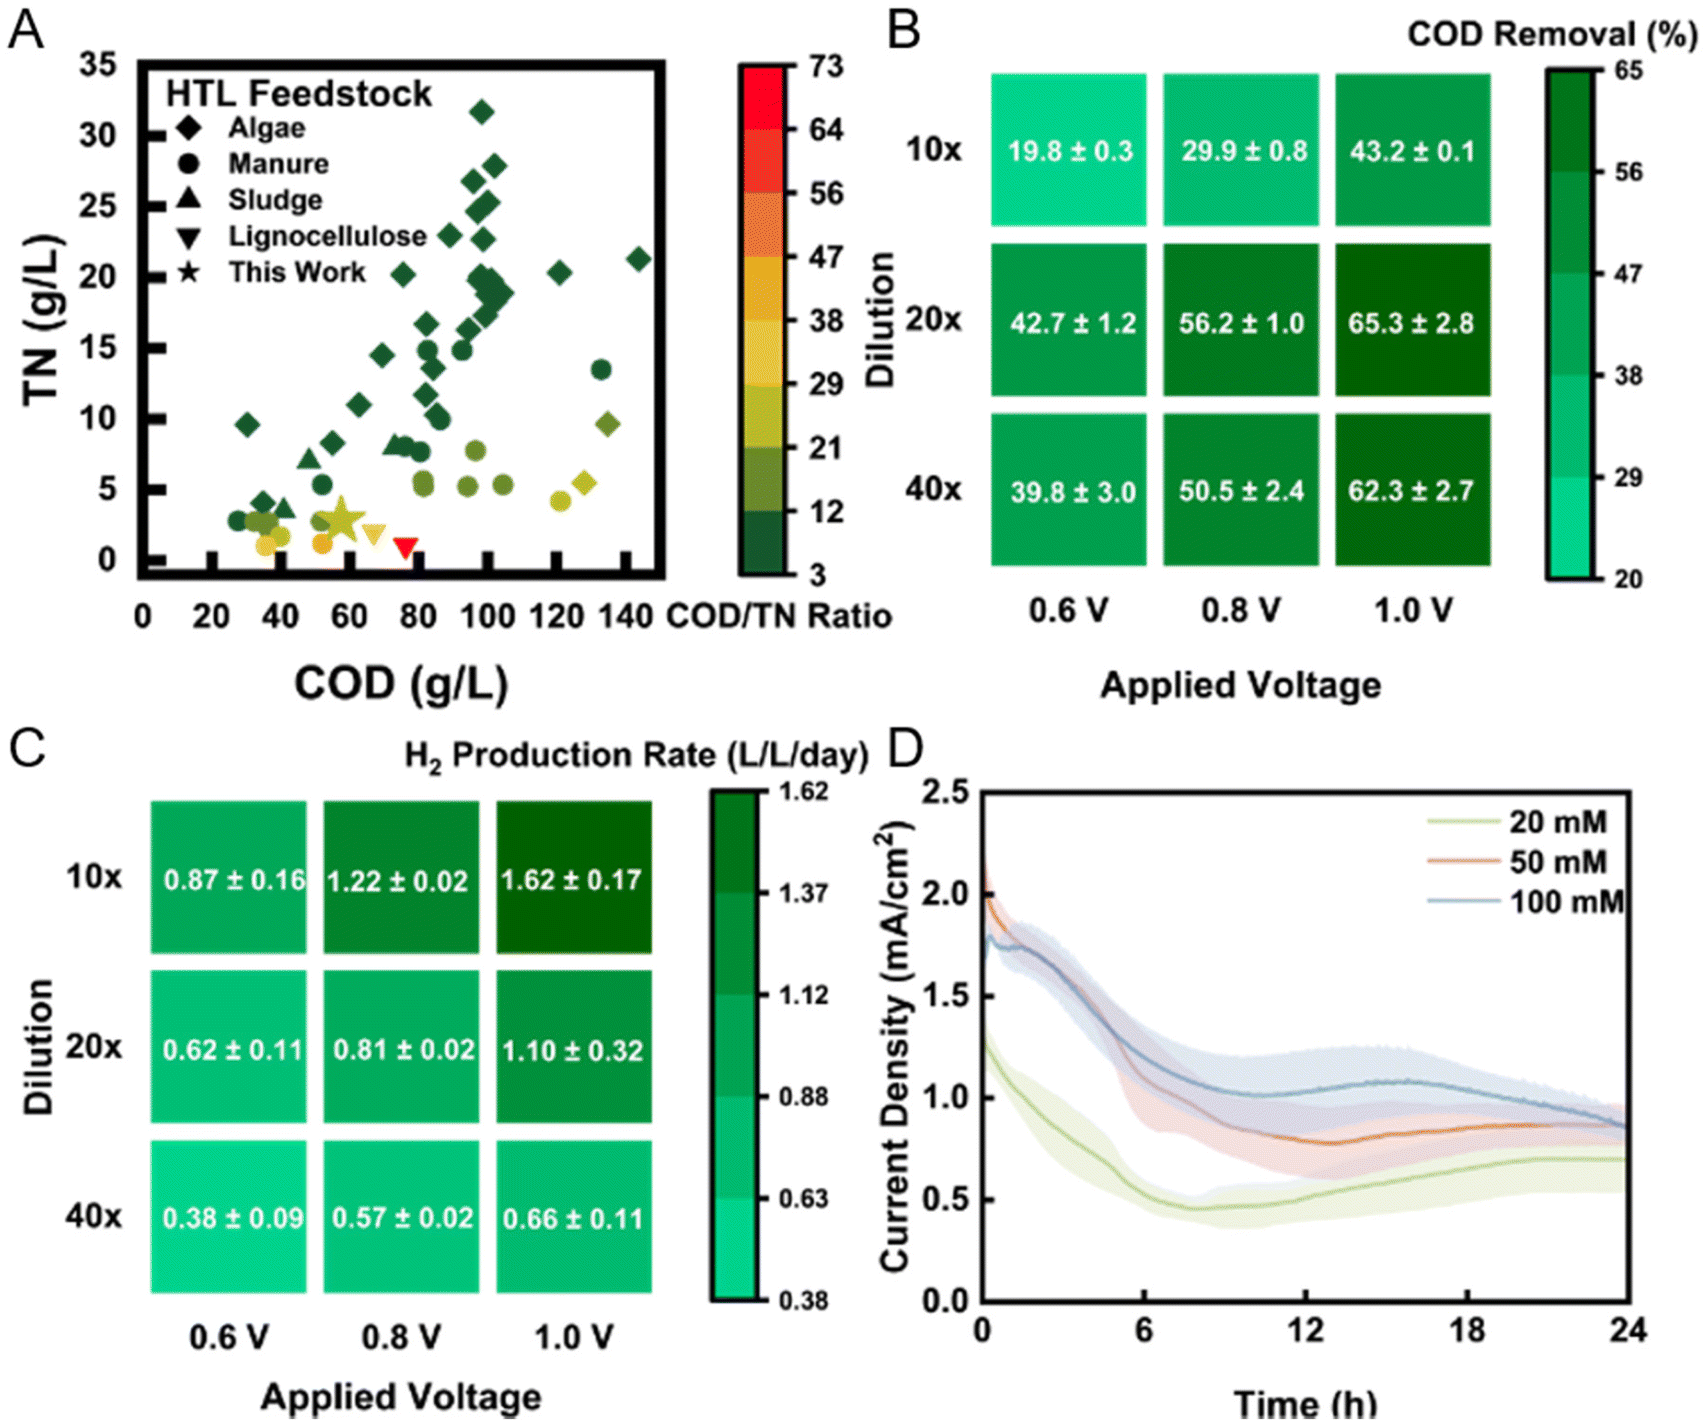 | ||
| Fig. 1 (A) COD/TN composition of feedstock PHW used in this study and other PHW studies. Literature data were collected from Watson et al. (2020).27 The COD removal (B) and H2 production rate (C) of PHW-fed MEC in 3-day period under different applied voltage and dilution ratio. (D) The current density profile under different buffer strength after introduction of fresh electrolyte. The shadows represent standard deviation from triplicate experiments. | ||
Based on the characteristics of the PHW, we carried out matrix experiments using different dilution ratios and applied voltages to identify the optimal operating conditions for the treatment of PHW and generation of H2 from MEC reactors. Since the organic concentration is much higher than typical wastewater, we employed a range of dilution ratio from 40× (1.5 g L−1 COD) to 10× (6 g L−1 COD). Results show that COD removal peaked at a dilution ratio of 20× (3 g L−1 COD), with a removal rate of 65% after one day under an applied voltage of 1.0 V (Fig. 1B). Detailed organic transformation process is discussed in Fig. 2. Kinetically, higher organic concentration leads to faster electron transfer toward the cathode, which consequently improves H2 production rate (Fig. 1C). However, the total amount of organic to be removed also increased, which result in a lower removal efficiency for 10× dilution group. The highest H2 production rate achieved was 1.62 L L−1 day−1, under an applied voltage of 1.0 V with 10× dilution. This value is one order of magnitude higher than previous achieved rate (0.17 L L−1 day−1) using swine manure PHW as feedstock under an applied voltage of 1.2 V.17 The COD to H2 yield also shows a significant improve, with 0.074 kg-H2 per kg-COD under this condition, compared to 1.028 × 10⁻⁵ kg-H2 per kg-COD in the previous study. The high H2 production rate reported here could be attributed to a robust electroactive community on the bioanode, whereas the high COD to H2 yield indicates a relatively high contribution of electroactive bacteria to COD removal compared to non-electroactive species. The microbial characterization results will be discussed later.
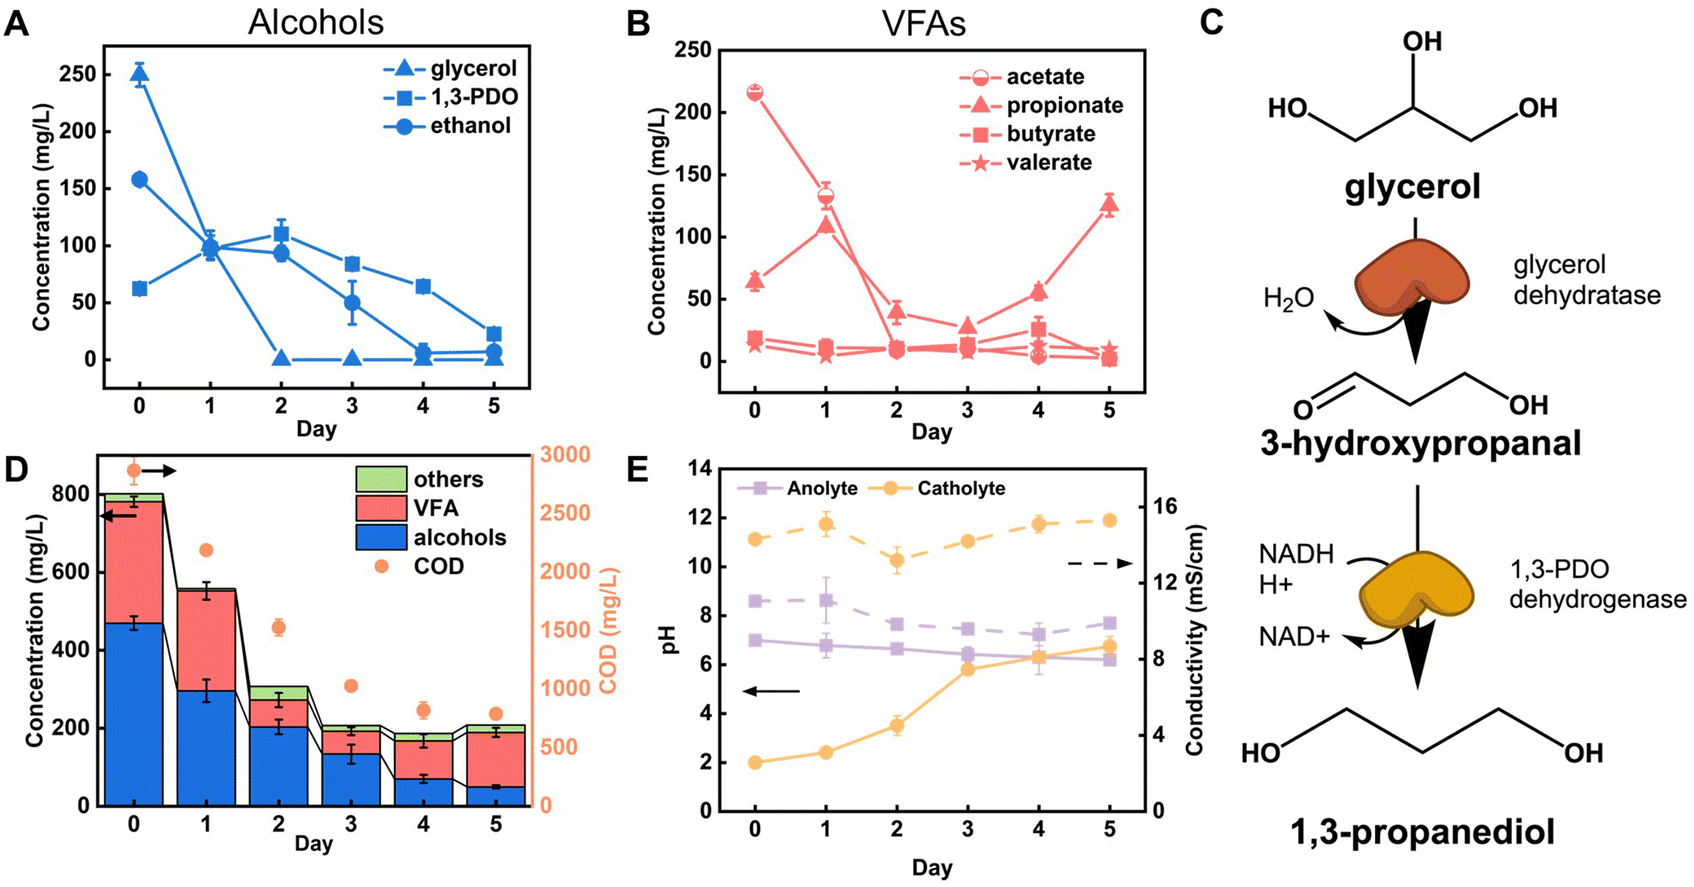 | ||
| Fig. 2 The concentration profile of (A) alcohols and (B) VFAs throughout the MEC treatment as identified by HPLC with an ion-exclusion column. (C) The metabolic pathway of glycerol fermentation to 1,3-PDO. (D) The combined concentration profile of HPLC identified chemicals and the COD degradation profile. (E) The pH and conductivity change of electrolyte throughout the MEC treatment. pH is presented by solid lines and conductivity by dashed line. | ||
We subsequently chose 1.0 V and 20× for the following experiments as it yielded the highest COD removal while providing a high H2 production rate. We collected the current density profile under different PBS buffer strengths (Fig. 1D) and found that the current density positively correlates with the buffer strength used for dilution. Typically, buffer plays two roles in microbial electrochemical systems: (1) to maintain stable pH against fluctuation; (2) to provide a good conductivity. In this case, the buffer mainly contributes to pH stability, as the conductivity of PHW (18.4 mS cm−1) was in fact higher than that of buffer. Except for the initial current decrease, the current profile was maintained relatively stable until substrate depletion. The optimal current density (∼2 mA cm−1) achieved is among the higher end of MECs.18
3.2. PHW degradation and chemical transformation
With the optimal parameters identified above (20× dilution, 1 V applied voltage, 100 mM PBS), we carried out MEC treatment of PHW and tracked the concentration of organic compounds throughout the experimental period. As shown in Fig. 2A and B, the two major components – glycerol and acetate, were both quickly depleted after two days, but other compounds such ethanol and propionate showed different patterns. The fast depletion of acetate is in line with previous findings, as acetate is a known favorable substrate for electroactive microbes. Many studies have shown that acetate led to the highest electron transfer efficiency by the common electroactive Geobacter spp. compared to other organics such as lactate and formate.28,29Different from acetate, glycerol cannot be directly metabolized by electroactive microbes, but its quick degradation was believed to be due to anaerobic fermentation. This is supported by the increase in concentration of 1,3-PDO, which is a common fermentation product of glycerol (Fig. 2C). In this pathway, glycerol is first dehydrated to 3-hydroxypropanal with glycerol dehydratase, which is then consequently reduced to 1,3-PDO through 1,3-PDO dehydrogenase.25Fig. 2A shows 1,3-PDO concentration peaked after two days of PHW treatment, coordinated with glycerol depletion. 1,3-PDO concentration started to decrease after that, presumably due to consumption. Previously, sulfate-reducing bacteria strains isolated from freshwater sediments have been proven capable of using 1,3-PDO as substrate and converting it to acetate and CO2 while reducing sulfate to sulfide.30 It is likely that similar pathways are responsible for the 1,3-PDO decrease observed in our reactors, especially considering that many sulfate-reducing strains are also electroactive.31 The biofilm characterization results indeed showed an enrichment of Desulfovibrio spp., which will be discussed in the latter section. Ethanol is another possible product from fermentation of glycerol as well as many other carbon sources.32,33 However, its concentration showed a constant decrease, indicating that the ethanol utilization rate is higher than its production rate (Fig. 2A).
Unlike acetate that showed a quick depletion, or butyrate and valerate which maintained at low level, propionate went through the largest variation throughout PHW conversion process (Fig. 2B). Its concentration increased on day one as a result of glycerol fermentation, as some strains of genera Propionibacterium and Anaerotignum (some previously belongs to Clostridium) are shown to have such fermentation pathways, and Anaerotignum spp. were indeed identified in the bioanode comunity.34,35 Subsequently, its concentration decreased, presumably due to its consumption by electroactive bacteria, as propionate is a known substrate for electroactive microbes.36–38 Interestingly, the concentration exhibited another increase after day three. Among the HPLC identified chemicals, this could only be explained by 1,3-PDO transformation to propionate as glycerol is already depleted after day 2. Although these two compounds are both three-carbon compounds, the biotransformation between 1,3-PDO and propionate is not documented to the best of our knowledge. It should be noted that HPLC does not offer a full chemical profile of the PHW composition. Therefore, propionate production after day 3 could also be coming from metabolites unidentified by HPLC.
During each regular batch operation, VFAs and alcohols were both effectively removed with a removal level of 55.1% and 89.4% respectively after 5 days of MEC treatment (Fig. 2D). This correlates with the 72.5% COD removal from 2871 ± 120 mg L−1 to 790 ± 35.4 mg L−1. The COD profile shows a similar pattern to VFAs and alcohols: over 60% COD removal occurred during the first three days of MEC treatment, whereas removal kinetics became more sluggish on day 4 and 5 as substrate was depleted. The anolyte and catholyte conductivity were kept stable throughout the process and anolyte pH did not show significant drop due to the incorporation of the bipolar membrane (Fig. 2E). The stability of anolyte pH is of particular importance as slightly acidic (pH < 5) environment could severely inhibit the microbial activity.39
The cumulative H2 production also demonstrated a similar time pattern, where the first 3 days contributed 89% of H2 production (Fig. S1†). The cathodic H2 recovery, on the other hand, was always kept over 90% during the experimental period, indicating little to no side reaction besides H2 evolution reaction.
Open-circuit control reactors were tested under the same conditions. The VFA and alcohols showed slow and gradual removal of 26.4% and 31.9% in five days, respectively (Fig. S2†). The removal of alcohols was attributed to the fermentation of glycerol – which led to products of smaller molecular weight such as ethanol and acetate. The VFA removal was also marginal, as the anode cannot be used as the terminal electron acceptors in open-circuit condition. These results further stress the importance of applying a suitable voltage to drive the microbial electrochemical reactions.
3.3. 2D NMR, SEC, and GC-MS reveals detailed molecular transformation
While COD provided general measures of organic removal and HPLC provided concentration changes on selected compounds based on an existing library, they both have limitations on understanding the broader picture of organic transformation present in the complex PHW.40 Therefore, we employed NMR spectroscopy to reveal a more complete spectrum of the conversion process. Rather than adopting the common 1H NMR that has been used in wastewater characterization, we applied 1H–13C HSQC NMR that probes the proton-carbon single bond correlations on the raw PHW and the effluent after MEC treatment. This is because the narrow chemical shift range (commonly from 0–12 ppm) in 1H NMR may result in signal overlap in complex organic samples such as PHW.41 As shown in Fig. 3A, the raw PHW exhibited a high structural diversity with 1H signal spanning from 0.5–8.5 ppm and 13C signal spanning from 0–150 ppm. The most prominent peaks came from the region which indicates HnCO structures (δH/δC 3.0–4.5/50–90 ppm) including monohydric/polyhydric alcohols and ethers. Among them, three peaks which correspond to glycerol are clearly visible with blue ones indicating the terminal CH2 group and the red one indicating the middle CH group. The compounds which were identified by HPLC analysis were mapped towards the HSQC spectrum. Unsurprisingly, the compounds identified by HPLC only constitute a small portion of the visible peaks, further confirming the necessity of NMR on capturing comprehensive chemical information in wastewater. Most notably, many peaks residing in the region indicating HnCO structures were not mapped to HPLC-quantified chemicals. This suggests that besides those in the tailored HPLC database, other alcohols or ethers may also be present in the PHW. Besides HnCO structures, a significant number of peaks were present in the aromatic region (δH/δC 6.5–8.0/100–150 ppm) which were not detected by HPLC, indicating a high concentration of aromatic compounds. No peaks were observed in the region of anomeric C1 peaks for oligosaccharides (δH/δC 98–114/4.3–5.6 ppm), further confirming our observations from HPLC: the oligosaccharides contained in the feedstock has gone through further transformation due to the relatively high temperature used in the HTL process.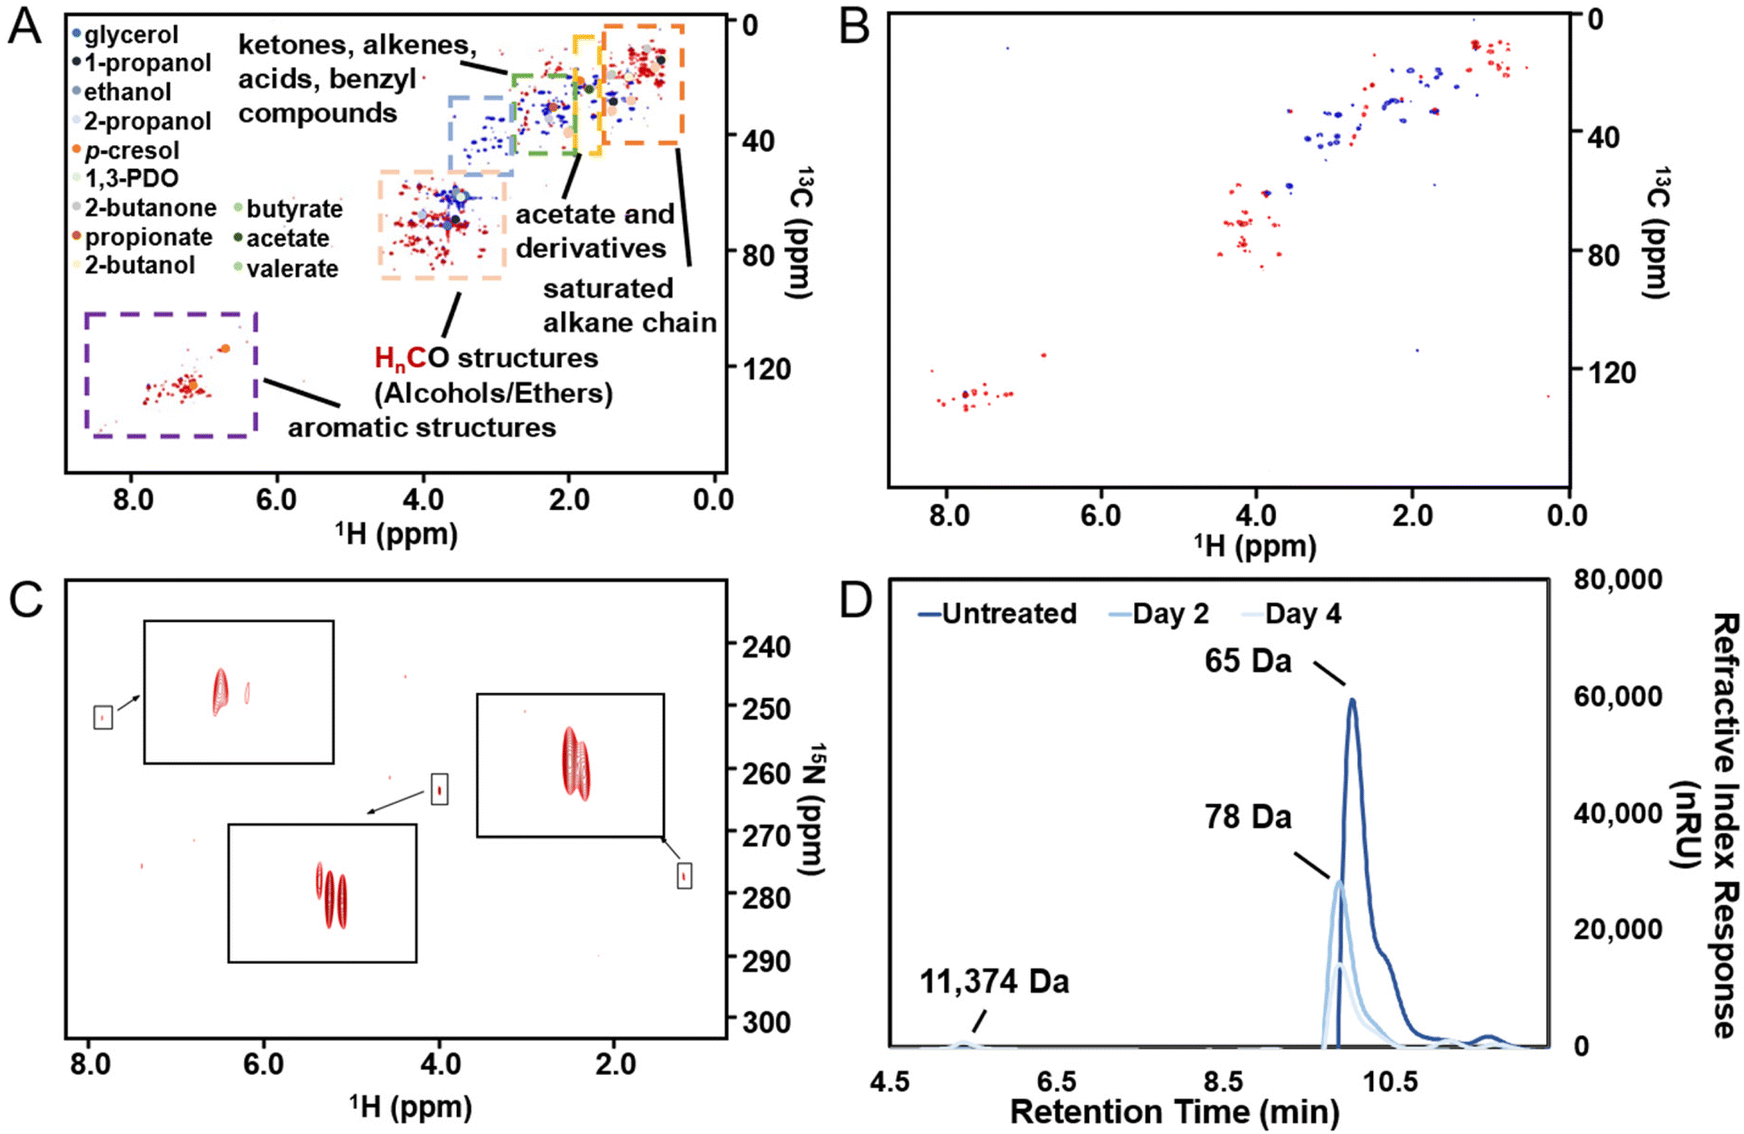 | ||
| Fig. 3 1H–13C HSQC NMR spectra of (A) untreated PHW; (B) PHW after 5 days of MEC treatment. Note that the edited HSQC shows CH2 in blue and CH/CH3 in red. (C) 1H–15N HMBC NMR spectrum of untreated PHW, with the insets showing enlarged view of each peak. (D) Size-exclusion chromatography of PHW at different stages of MEC treatment. | ||
Overall, the HSQC spectrum provides an intuitive visualization of the chemical information contained in the PHW, and this advantage is even more significant when the spectra across time were combined and animated. Readers are referred to the ESI (Video S1†) which contains an animation showing the time-series HSQC spectra of the PHW during MEC treatment. The most prominent change of HSQC spectra took place during the 1st day of MEC treatment, where a significant number of peaks faded away and the intensity decreased for most remaining peaks. The changes in the spectra were more subtle after day 2, indicating less metabolic activity going on. This observation is in line with the COD/DOC profile during MEC treatment where 58% of COD degradation and 73% of DOC removal took place during the first two days. This information could be especially helpful for determining the appropriate hydraulic retention time (HRT) for continuous operation. A zoom-in view of the HnCO region of the spectrum (Fig. S3†) confirmed the HPLC results where the glycerol was depleted after two days and the 1,3-PDO concentration experienced an increase followed by a decrease.
The HSQC spectrum of the PHW after MEC treatment (Fig. 3B) depicts much less signal than the raw PHW, indicating successful removal of organic compounds. The animated time series spectra of the aromatic region showed although there are recalcitrant aromatic compounds that were not degraded during MEC treatment, many peaks within this region were shifting downfield (Video S2†), indicating possible transformation of the aromatic compounds. Such transformation was likely due to microbial conversion.42 For example, anaerobic electroactive bacteria such as Geobacter metallireducens has been known to possess enzyme that catalyze dearomatizing reaction of benzoyl-CoA, a central intermediate for anaerobic aromatic degradation.43
The ORG-N content in the PHW was high (1476 ± 89 mg L−1), representing more than half of the total nitrogen. During the MEC treatment, although NH3-N was effectively consumed which resulted in >50% TN removal, the ORG-N removal was limited to 22% (Fig. S4†). Therefore, understanding the chemical nature of the ORG-N presents a prerequisite to improving nitrogen removal efficiency. In HTL, ORG-N is mostly produced via Maillard reaction where the reducing sugars react with amino acids and form nitrogen-containing heterocyclic compounds such as pyrrole, pyridine, pyrazine, and their derivatives.3,44 In order to elucidate the nature of these organic nitrogen, we applied 1H–15N HMBC NMR on the untreated PHW. Three major peaks were identified from the HMBC spectrum (Fig. 3C), with δN in the range of 250–280 ppm which corresponds to pyridine- and pyrrole-like nitrogen. This result shows that the majority of the organic nitrogen atoms contained in PHW should be those on the heterocyclic rings. This would also partly explain the peaks in the aromatic region shown on the HSQC NMR spectrum. To confirm the results by 1H–15N HMBC NMR, we further extracted the heterocyclic compounds contained in PHW and used GC-MS to qualitatively identify their chemical formula. It should be noted that the majority of these heteroaromatic compounds have a relatively small molecular weight as larger compounds typically partition into HTL biocrude phase. Readers are referred to Table S3† for the complete table. Indeed, multiple nitrogenous heterocyclic compounds were identified from the raw PHW, a majority of which are heteroaromatic compounds (Table 1). The heteroaromatic structures identified in this study align well with previous literature on PHW characterization. For instance, a stream of PHW from HTL of Spirulina algae contained pyridine and pyridine derivatives.4 Indole and pyrrole derivatives were found in another PHW from HTL of macroalgae Laminaria saccharina.45 Interestingly, the two most prevalent nitrogenous compounds in the above Spirulina-derived PHW, 2-Piperidinone (δ-valerolactam) and caprolactam, are nonaromatic. Similar heterocyclic yet nonaromatic structures are also observed in our analysis, including derivatives of pyrrolidinone, piperazine and caprolactam (Table S3†). The relatively low removal on ORG-N indicates that traditional bioanode metabolism has limited capability of removing nitrogen on the heteroaromatic rings. Biological wastewater treatment processes have been shown capable of degrading ORG-N, but those ORG-N are mainly biogenic protein or peptides.46 The anthropogenic ORG-N in PHW formed from Maillard reaction, on the other hand, are indeed less susceptible to microbial metabolism. Combining MEC with upstream or downstream processes that are specifically tailored for removing the refractory nitrogenous species is therefore recommended to further enhance treatment efficiency. For instance, adsorption has been shown to successfully remove heteroaromatics in aqueous phase.47,48 Alternatively, advanced reduction process can be applied to mineralize the heteroaromatic compounds.49 Biological degradation are also feasible, as certain amino acids such as tryptophan and histidine also possess heterocyclic structure. However, it is recommended to use pretreatment such as ozonation to improve its biodegradability.50
| Compound name | Structure | Formula | MW (g mol−1) | CAS # |
|---|---|---|---|---|
| 2-Methylpyrazine |
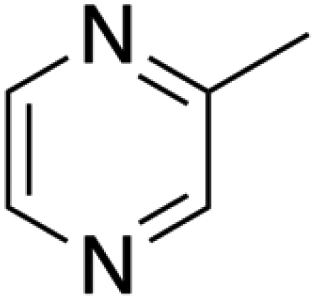
|
C5H6N2 | 94.11 | 109-08-0 |
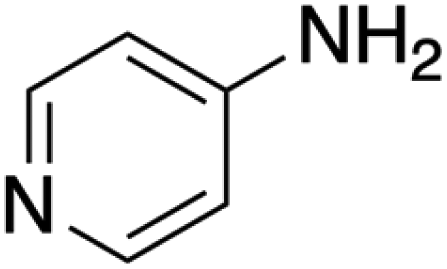
| 3-Aminopyridine |
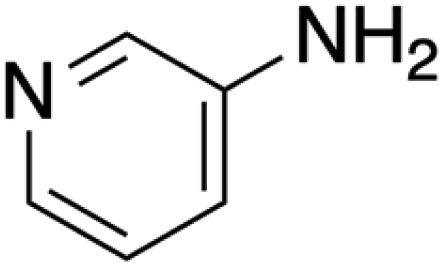
|
C5H6N2 | 94.11 | 462-08-8 |
| 2-Formylhistamine |

|
C6H9N3O | 139.16 | — |
| 4-Aminopyridine |
|
C5H6N2 | 94.11 | 504-24-5 |
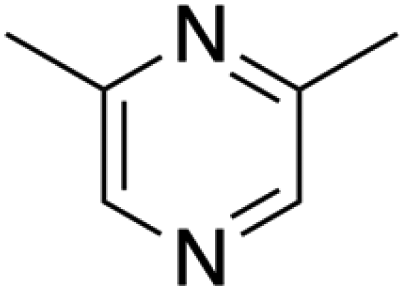
| 2,6-Dimethylpyrazine |
|
C6H8N2 | 108.14 | 108-50-9 |
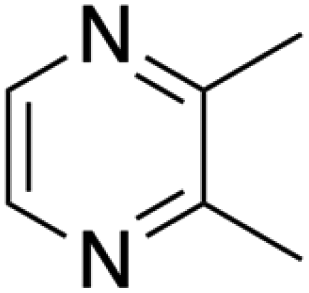
| 2,3-Dimethylpyrazine |
|
C6H8N2 | 108.14 | 108-50-9 |
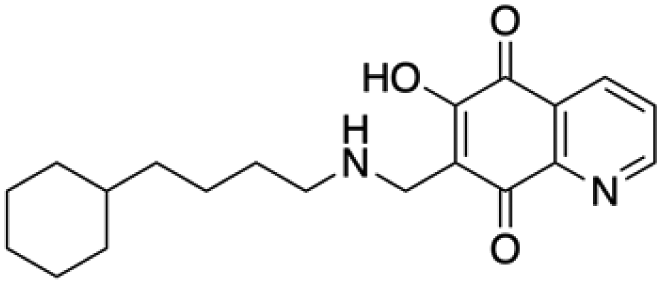
| Quinoline-5,8-dione-6-ol, 7-[[(4-cyclohexylbutyl)amino]methyl]- |
|
C20H26N2O3 | 342.40 | — |
| 2-(2-Fluorophenyl)-2H-1,2,3-triazole-4-carboxylic acid |
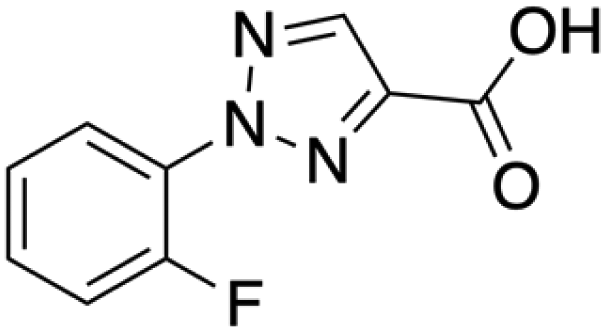
|
C9H6FN3O2 | 207.16 | 51306-44-6 |
| Imidazole-4,5-dicarboxamide |
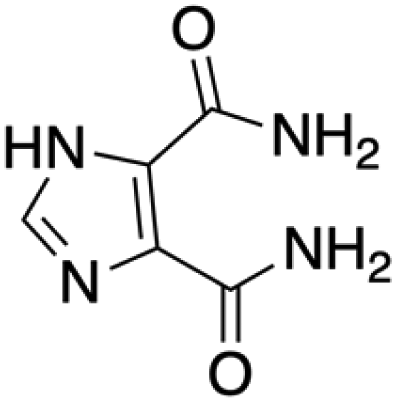
|
C5H6N4O2 | 154.13 | 83-39-6 |
The molecular weight distribution was determined by SEC. Untreated PHW has an average molecular weight of 65 Da, further confirming that larger molecules tend to partition into the biocrude phase instead of aqueous phase. The average molecular weight went through slight increase during the MEC treatment, indicating that the smaller molecules are more readily removed than larger ones. Interestingly, a peak at 11374 Da emerged after 4 days of treatment – this could be attributed to the extracellular polymeric substances excreted by anode biofilm. Compared to another PHW derived from sewage sludge which has an average molecular weight over 300 Da, the average molecular weight of PHW is this study is significantly lower.51 This is likely a result of higher HTL reaction temperature, as the average molecular weight has been found to be negatively correlated with the reaction temperature. The relatively low molecular weight of organics in this PHW further suggested that it is well-suited for biodegradation, as minimum hydrolysis of large molecules is needed prior to microbial metabolism.
3.4. Biofilm ecology and metabolic network
A compact layer of biofilm was observed on the anode carbon fibers after MEC operation (Fig. 4A). To characterize the microbial communities and understand their functions in terms of organic and nitrogen transformation in the MEC, we collected initial biofilm samples right after inoculation and at the end of the experimental period. It was found that Geobacter spp. accounts for 70% abundance in both samples, indicating robust electroactive activities (Fig. 4B). The dominantly high abundance of Geobacter spp. could be originated from the relatively low anode potential (−0.35 V vs. Ag/AgCl) during inoculation, which has been shown to select for electroactive bacteria conducting direct extracellular electron transfer.52 The most notable difference in biofilm ecology after PHW treatment is the increase in sulfate-reducing bacteria – Desulfovibrio spp., from 0.2% to 7.5%. The increase could be attributed to the presence of 1,3-PDO in PHW, which Desulfovibrio spp. have been shown to degrade with sulfate as the terminal electron acceptor.53 The Anaerotignum spp. could be responsible for propionate production during MEC treatment, as Anaerotignum propionicum (formerly known as Clostridium propionicum) has been demonstrated to ferment glycerol to propionate with a yield of 79.6%.34 The other major genera – Acetobacterium and Lactococcus, are all anaerobes which conduct either fermentation or anaerobic respiration. The presence of methanogens, including Methanobrevibacter and Methanomassiliicoccus, indicate possible CO2 recycling where the CO2 produced from COD oxidation were subsequently converted to methane.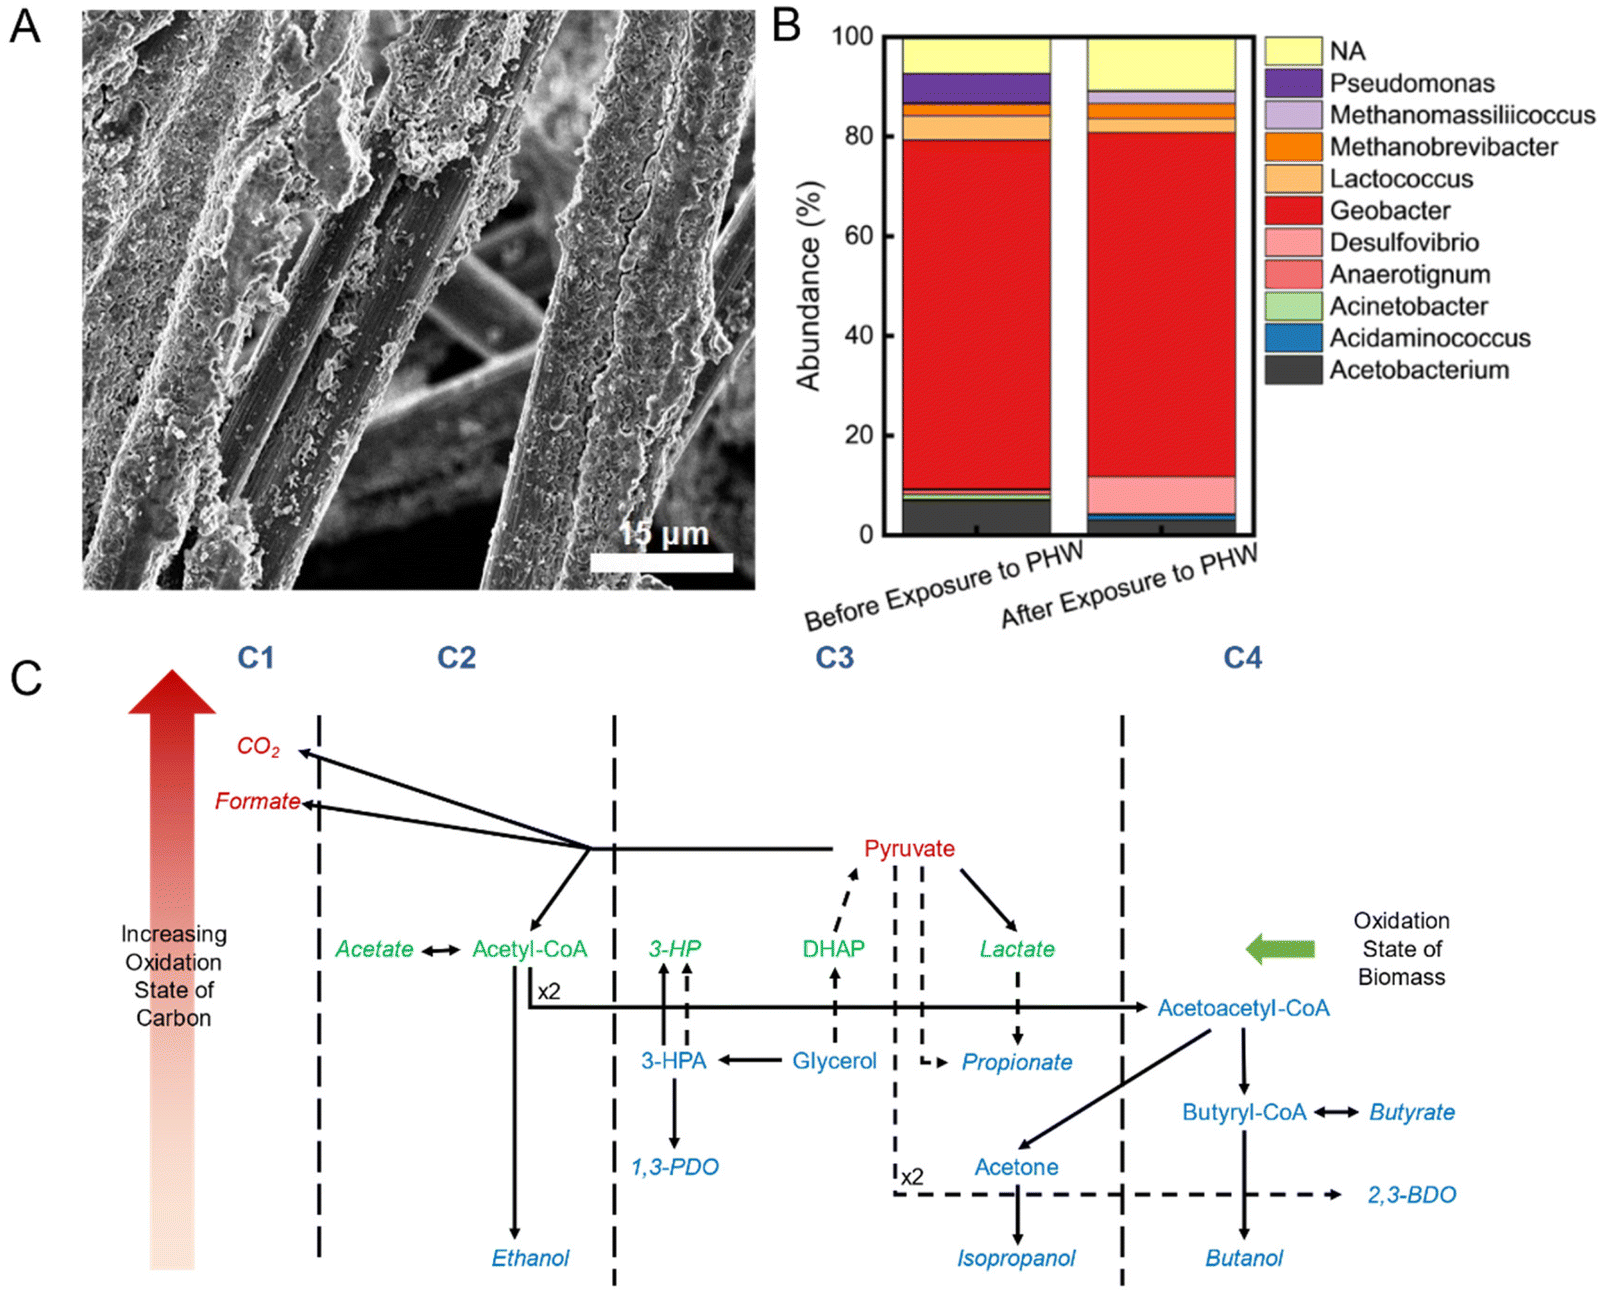 | ||
| Fig. 4 (A) SEM image of the layer of biofilm formed on carbon fibers. (B) Genus-level biofilm composition before and after exposure to PHW. (C) The proposed metabolic network in the anode chamber. Dashed arrows represent multiple-step processes. The metabolites are arranged in ascending order of carbon valency from bottom to top, and in increasing order of the number of carbon atoms from left to right. Metabolites written in italic represent possible direct electron donors for electroactive bacteria. The color of the metabolites suggests the average degree of reduction of the carbon, with blue indicating more reduced than biomass, green indicating the same degree of reduction as biomass, and red indicating more oxidized than biomass. | ||
The fermentative bacteria together account for <30% abundance on the anode biofilm, yet they played an important role in COD degradation. The raw PHW contains a high concentration of glycerol (4992 ± 253 mg L−1) that is not readily available for electroactive bacteria. Glycerol is therefore first fermented through various pathways to fermentation end products such as 1,3-PDO, ethanol, acetate, and propionate, as shown in HPLC analysis, which were then subsequently available as electron donor to electroactive bacteria such as Geobacter spp. (Fig. 4C). The utilization of these fermentation end products, in turn, thermodynamically promotes the fermentation pathways as the products are promptly removed. Such syntrophic interactions between electroactive bacteria and fermentative bacteria have also been reported in previous studies.54,55 The high abundance of electroactive bacteria identified in the sequencing is believed due to their preference in attached growth compared to fermenters. Our 16S rRNA gene sequencing of electrolyte samples unfortunately yielded low purified DNA concentrations that prohibited further analysis. This is partially due to the inhibition by chemicals in PHW on microbes and a result from regular replenishment of electrolyte. Despite their low abundance, fermentative bacteria were able to synergistically metabolize with electroactive bacteria due to their faster rate of fermentation compared to respiration, which is evidenced by the facile depletion of glycerol in the electrolyte. Besides the interspecies interaction, the presence of electrode potential could also alter the metabolic behavior of the fermentative bacteria – a process now known as electro-fermentation.56,57 For example, a reductive current has led to a twofold increase in 1,3-PDO production yield in a glycerol fermentation system.58 For the purpose of COD removal and H2 generation, the fermentation end-products distribution did not have much effects since the metabolites would serve as the electron donor for electroactive microbes. However, the knowledge on such metabolic pathways shed light on the development of downstream processes for enhanced removal or biosynthesis of value-added products.
The metabolic network proposed here is based on the possible metabolic pathways of the microbial genera identified through 16S rRNA genes sequencing. It should be viewed as a qualitative representation and does not indicate quantitative information such as the abundance and rate of each pathway. Metagenomics and metatranscriptomics, on the other hand, could provide a more quantitative understanding of the functional profile of the anodic community.59 Future studies that employ such methods could shed light on the abundance and expression profile of important metabolic genes, especially those that are responsible for the degradation of nitrogenous heterocyclic compounds.
4. Summary
PHW management has been a barrier for HTL development, so in this work we analyzed the metabolic pathways and the associated molecular transformations during MEC treatment of PHW, which filled knowledge gaps and demonstrated feasibility of microbial electrochemical treatment and valorization of PHW. We identified the recalcitrant species through a combination of 1H–15N HMBC NMR and GC-MS. Historically, 15N NMR on aqueous samples has been a challenge due to the low natural abundance of 15N (0.37%) and low gyromagnetic ratio of the nucleus. The overall receptivity of 15N vs.13C is only 0.0219, making it a less ideal nucleus to probe on. When the same concentrating factor for the HSQC was used, the signal to noise ratio was indeed too low to acquire useful information (Fig. S5†). By increasing the concentrating factor, and appropriate signal processing, we successfully revealed the major form of ORG-N, which were subsequently confirmed by GC-MS. To the best of our knowledge, this is the first study reported the successful implementation of 15N NMR on aqueous wastewater samples. Such NMR techniques would provide a handy, non-targeted and non-destructive way to probe the detailed chemical information in complex environmental samples such as wastewater, and would be especially useful for biological processes that have historically relied on COD as a generic metric. The record-high current density and H2 production rate in PHW-fed MECs achieved in this study further confirms its potential in PHW valorization. Future research could be focused on combining MECs with other processes such as advanced reduction or electro-Fenton to improve the removal of heteroaromatic compounds.Conflicts of interest
There are no conflicts to declare.Acknowledgements
We appreciate the financial support from the U.S. Department of Energy Bioenergy Technologies Office (BETO) (Project No. EE0009269). The authors thank Dr István Pelczer of Princeton University Department of Chemistry for his guidance with NMR analysis and Dr Sarah Fischer at University of Missouri-Columbia for her help with size-exclusion chromatography. The graphical abstract is created with BioRender.com.References
- B. Hao, D. Xu, G. Jiang, T. A. Sabri, Z. Jing and Y. Guo, Green Chem., 2021, 23, 1562–1583 RSC.
- A. Schwab, Bioenergy Technologies Office Multi-Year Program Plan, March 2016, 2016 Search PubMed.
- I. A. Basar, H. Liu, H. Carrere, E. Trably and C. Eskicioglu, Green Chem., 2021, 23, 1404–1446 RSC.
- M. Pham, L. Schideman, J. Scott, N. Rajagopalan and M. J. Plewa, Environ. Sci. Technol., 2013, 47, 2131–2138 CrossRef CAS PubMed.
- K. Chen, H. Lyu, S. Hao, G. Luo, S. Zhang and J. Chen, Bioresour. Technol., 2015, 182, 160–168 CrossRef CAS PubMed.
- H. Lyu, K. Chen, X. Yang, R. Younas, X. Zhu, G. Luo, S. Zhang and J. Chen, Sep. Purif. Technol., 2015, 147, 276–283 CrossRef.
- X. Zhang, J. Scott, B. K. Sharma and N. Rajagopalan, Environ. Sci., 2018, 4, 520–528 CAS.
- P.-G. Duan, S.-K. Yang, Y.-P. Xu, F. Wang, D. Zhao, Y.-J. Weng and X.-L. Shi, Energy, 2018, 155, 734–745 CrossRef CAS.
- R. Cherad, J. A. Onwudili, P. Biller, P. T. Williams and A. B. Ross, Fuel, 2016, 166, 24–28 CrossRef CAS.
- J. Watson, B. Si, H. Li, Z. Liu and Y. Zhang, Int. J. Hydrogen Energy, 2017, 42, 20503–20511 CrossRef CAS.
- U. Jena, N. Vaidyanathan, S. Chinnasamy and K. C. Das, Bioresour. Technol., 2011, 102, 3380–3387 CrossRef CAS PubMed.
- D. Quispe-Arpasi, R. de Souza, M. Stablein, Z. Liu, N. Duan, H. Lu, Y. Zhang, A. L. de Oliveira, R. Ribeiro and G. Tommaso, Bioresour. Technol. Rep., 2018, 3, 247–255 CrossRef.
- H. Wang and Z. J. Ren, Biotechnol. Adv., 2013, 31, 1796–1807 CrossRef CAS PubMed.
- A. Marone, A. A. Carmona-Martínez, Y. Sire, E. Meudec, J. P. Steyer, N. Bernet and E. Trably, Water Res., 2016, 100, 316–325 CrossRef CAS PubMed.
- J. Jiang, J. A. Lopez-Ruiz, Y. Bian, D. Sun, Y. Yan, X. Chen, J. Zhu, H. D. May and Z. J. Ren, Water Res., 2023, 241, 120139 CrossRef CAS PubMed.
- J. Jiang, X. Chen, X. Chen and Z. J. Ren, Resour., Conserv. Recycl., 2022, 186, 106529 CrossRef CAS.
- R. Shen, Y. Jiang, Z. Ge, J. Lu, Y. Zhang, Z. Liu and Z. J. Ren, Appl. Energy, 2018, 212, 509–515 CrossRef CAS.
- J. Tang, Y. Bian, S. Jin, D. Sun and Z. J. Ren, ACS Environ. Au, 2022, 2, 20–29 CrossRef CAS PubMed.
- A. Leininger and Z. J. Ren, Bioresour. Technol., 2021, 332, 125130 CrossRef CAS PubMed.
- B. J. Callahan, P. J. McMurdie, M. J. Rosen, A. W. Han, A. J. A. Johnson and S. P. Holmes, Nat. Methods, 2016, 13, 581–583 CrossRef CAS PubMed.
- P. J. McMurdie and S. Holmes, PLoS One, 2013, 8, e61217 CrossRef CAS PubMed.
- R. Lacroix, S. Da Silva, M. V. Gaig, R. Rousseau, M. L. Délia and A. Bergel, Phys. Chem. Chem. Phys., 2014, 16, 22892–22902 RSC.
- R. Rousseau, X. Dominguez-Benetton, M.-L. Délia and A. Bergel, Electrochem. Commun., 2013, 33, 1–4 CrossRef CAS.
- M. Usman, H. Chen, K. Chen, S. Ren, J. H. Clark, J. Fan, G. Luo and S. Zhang, Green Chem., 2019, 21, 1553–1572 RSC.
- J. M. Clomburg and R. Gonzalez, Trends Biotechnol., 2013, 31, 20–28 CrossRef CAS PubMed.
- R. Posmanik, R. A. Labatut, A. H. Kim, J. G. Usack, J. W. Tester and L. T. Angenent, Bioresour. Technol., 2017, 233, 134–143 CrossRef CAS PubMed.
- J. Watson, T. Wang, B. Si, W. T. Chen, A. Aierzhati and Y. Zhang, Prog. Energy Combust. Sci., 2020, 77, 100819 CrossRef.
- H. Liu, S. Cheng and B. E. Logan, Environ. Sci. Technol., 2005, 39, 658–662 CrossRef CAS PubMed.
- A. M. Speers and G. Reguera, Appl. Environ. Microbiol., 2012, 78, 437–444 CrossRef CAS PubMed.
- B. Oppenberg and B. Schink, Antonie van Leeuwenhoek, 1990, 57, 205–213 CrossRef CAS PubMed.
- D. R. Lovley and D. E. Holmes, Nat. Rev. Microbiol., 2022, 20, 5–19 CrossRef CAS PubMed.
- J. M. Flynn, D. E. Ross, K. A. Hunt, D. R. Bond and J. A. Gralnick, mBio, 2010, 1, 10–128 CrossRef PubMed.
- A. M. Speers, J. M. Young and G. Reguera, Environ. Sci. Technol., 2014, 48, 6350–6358 CrossRef CAS PubMed.
- F. Barbirato, D. Chedaille and A. Bories, Appl. Microbiol. Biotechnol., 1997, 47, 441–446 CrossRef CAS.
- E. H. Himmi, A. Bories, A. Boussaid and L. Hassani, Appl. Microbiol. Biotechnol., 2000, 53, 435–440 CrossRef CAS PubMed.
- R. M. Alonso, A. Escapa, A. Sotres and A. Morán, Fuel, 2020, 267, 117158 CrossRef CAS.
- A. R. Hari, K. P. Katuri, B. E. Logan and P. E. Saikaly, Sci. Rep., 2016, 6, 38690 CrossRef CAS PubMed.
- D. A. de Cárcer, P. T. Ha, J. K. Jang and I. S. Chang, Appl. Microbiol. Biotechnol., 2011, 89, 605–612 CrossRef PubMed.
- S. A. Patil, F. Harnisch, C. Koch, T. Hübschmann, I. Fetzer, A. A. Carmona-Martínez, S. Müller and U. Schröder, Bioresour. Technol., 2011, 102, 9683–9690 CrossRef CAS PubMed.
- B. E. Logan, Environ. Sci. Technol., 2006, 11, 438–445 Search PubMed.
- M. T. Anaraki, D. H. Lysak, K. Downey, F. V. C. Kock, X. You, R. D. Majumdar, A. Barison, L. M. Lião, A. G. Ferreira, V. Decker, B. Goerling, M. Spraul, M. Godejohann, P. A. Helm, S. Kleywegt, K. Jobst, R. Soong, M. J. Simpson and A. J. Simpson, Prog. Nucl. Magn. Reson. Spectrosc., 2021, 126–127, 121–180 CrossRef CAS PubMed.
- G. Fuchs, M. Boll and J. Heider, Nat. Rev. Microbiol., 2011, 9, 803–816 CrossRef CAS PubMed.
- J. W. Kung, C. Löffler, K. Dörner, D. Heintz, S. Gallien, A. Van Dorsselaer, T. Friedrich and M. Boll, Proc. Natl. Acad. Sci. U. S. A., 2009, 106, 17687–17692 CrossRef CAS PubMed.
- C. Zhang, X. Tang, L. Sheng and X. Yang, Green Chem., 2016, 18, 2542–2553 RSC.
- K. Anastasakis and A. B. Ross, Bioresour. Technol., 2011, 102, 4876–4883 CrossRef CAS PubMed.
- P. J. Westgate and C. Park, Environ. Sci. Technol., 2010, 44, 5352–5357 CrossRef CAS PubMed.
- D. H. Lataye, I. M. Mishra and I. D. Mall, Ind. Eng. Chem. Res., 2006, 45, 3934–3943 CrossRef CAS.
- X. Han, H. Lin and Y. Zheng, J. Hazard. Mater., 2015, 297, 217–223 CrossRef CAS PubMed.
- S. Liu, J. Han, Y. Ding, X. Gao, H. Cheng, H. Wang, C. Liu and A. Wang, Chemosphere, 2022, 287, 132240 CrossRef CAS PubMed.
- L. Yang, B. Si, M. A. Martins, J. Watson, H. Chu, Y. Zhang, X. Tan, X. Zhou and Y. Zhang, Water Sci. Technol., 2018, 2017, 248–255 CrossRef PubMed.
- S. Hao, S. Ren, N. Zhou, H. Chen, M. Usman, C. He, Q. Shi, G. Luo and S. Zhang, J. Hazard. Mater., 2020, 383, 121163 CrossRef CAS PubMed.
- C. I. Torres, R. Krajmalnik-Brown, P. Parameswaran, A. K. Marcus, G. Wanger, Y. A. Gorby and B. E. Rittmann, Environ. Sci. Technol., 2009, 43, 9519–9524 CrossRef CAS PubMed.
- A. I. Qatibi, J. L. Cayol and J. L. Garcia, FEMS Microbiol. Lett., 1991, 85, 233–240 CrossRef CAS.
- B. E. Logan and J. M. Regan, Trends Microbiol., 2006, 14, 512–518 CrossRef CAS PubMed.
- Z. Ren, T. E. Ward and J. M. Regan, Environ. Sci. Technol., 2007, 41, 4781–4786 CrossRef CAS PubMed.
- R. Moscoviz, J. Toledo-Alarcón, E. Trably and N. Bernet, Trends Biotechnol., 2016, 34, 856–865 CrossRef CAS PubMed.
- Y. Jiang, H. D. May, L. Lu, P. Liang, X. Huang and Z. J. Ren, Water Res., 2019, 149, 42–55 CrossRef CAS PubMed.
- M. Zhou, J. Chen, S. Freguia, K. Rabaey and J. Keller, Environ. Sci. Technol., 2013, 47, 11199–11205 CrossRef CAS PubMed.
- C. Simon and R. Daniel, Appl. Environ. Microbiol., 2011, 77, 1153–1161 CrossRef CAS PubMed.
Footnote |
| † Electronic supplementary information (ESI) available. See DOI: https://doi.org/10.1039/d3gc02252h |
| This journal is © The Royal Society of Chemistry 2023 |