 Open Access Article
Creative Commons Attribution 3.0 Unported Licence
Thermally activated delayed fluorescence in an optically accessed soft matter environment
Maria
Micheva
a,
Stanislav
Baluschev
 *ab and
Katharina
Landfester
 *a
*a
aMax Planck Institute for Polymer Research, Ackermannweg 10, D-55128 Mainz, Germany. E-mail: balouche@mpip-mainz.mpg.de
bOptics and Spectroscopy Department, Faculty of Physics, Sofia University, “St. Kliment Ochridski”, 5 James Bourchier, 1164 Sofia, Bulgaria
First published on 11th January 2022
Abstract
Organic material compositions, able to demonstrate bright delayed fluorescence either by electrical excitation or by optical excitation, are being applied in various fields of research ranging from sunlight-powered photonic devices and organic light emitting diodes, to real-time minimally invasive thermometry and/or oximetry in cell-cultures. This review will provide extensive discussion on the influence of thermal phenomena on organic material compositions that demonstrate effective delayed fluorescence. In particular, emphasis will be placed on the technological flexibility of different approaches together with examples and prospects of their applications and optimization strategies. In particular, for the triplet–triplet annihilation photon energy upconversion devices, oxygen quenching and/or local temperature increase represent serious issues, minimizing the photon flux obtained and leading to the acceleration of device aging. However, such types of delayed fluorescence photonic applications, based on optically excited triplet states, are much more sensitive to tiny variations of the sample temperature and local concentration of molecular oxygen. To fully exploit the enormous application potential of delayed fluorescence based technologies, a deep understanding of the impact of the thermal phenomena on the aging properties and photonic efficiency is necessary. Such a ‘guide’ for designing robust delayed fluorescence based photonic materials with low sensitivity towards deactivation by atmospheric oxygen and temperature variations will be helpful for researchers working in fields, such as photo catalysis, organic solar cells, organic upconversion displays, minimally-invasive life-science sensing, molecular solar fuels etc.
Introduction
Excited triplet states of organic molecular ensembles serve as an energy pool for various successive processes, such as photocatalytic organic reactions,1–5 bioimaging,6,7 molecular sensing,8–14 electroluminescence, based on thermally activated delayed fluorescence TADF15–17 and triplet–triplet annihilation photon energy upconversion (TTA-UC).18–25 Recently, efficient spin–flip from a triplet to a singlet excited state,93 allowed the demonstration of organic light-emitting diodes (OLED) with excellent stability and high efficiency.94,95Importantly, both processes, TADF and TTA–UC, rely on densely populated triplet ensembles, i.e. the number of molecules in the excited triplet state is comparable to the total number of molecules (belonging to the studied species). Consequently, both processes demonstrate extremely high efficiency of delayed fluorescence, even at room temperature – for instances, TADF-systems demonstrate external quantum yield (Q.Y.) at the level of 0.1126 and nearly unity internal efficiency;27,28 the external quantum yield of the TTA–UC process is demonstrated to reach 0.1–0.2.29–34
Special attention must be paid to the fact that all molecular energy levels, involved in the TADF and TTA–UC processes, are real molecular levels, i.e. no virtual energetic levels are involved. The intramolecular relaxation processes occur on a time-scale of a few picoseconds.35,36 Therefore, in the TADF process only thermally equilibrated electronic states37 participate leading to a multi-microsecond decay time for the observed delayed fluorescence. The diffusion controlled processes (in a soft matter environment) of triplet–triplet annihilation (TTA, time scale of n × 100 μs) and the triplet–triplet energy transfer38 (TTT, time scale of μs) predetermine the decay time of the upconverted delayed emitter fluorescence (time scale of n ×100 μs).
A great advantage of delayed fluorescence (obtained by optical excitation of TADF or TTA–UC molecular systems) is its inherent independence on the coherence of the excitation light because the optical excitation of the system is performed by resonant single photon absorption.39–43 Consequently, the efficiency of the TTA–UC process depends on the properties of the materials, but does not in any way depend on the coherence of the excitation photons. Similarly, the TADF-process performed in amorphous films, the motion of the charges occupying electronic states formed on molecules or polymer chains, represents a hopping motion consisting of a sequence of incoherent transfers from one localized site to another localized site.44
Quenching by oxygen
However, photonic applications based on triplet excited states are substantially influenced by the non-emissive deactivation process, such as quenching via the oxygen in triplet ground state.45,46 In an oxygen-rich environment47 (even on the ppm-level), the energy accumulated in the excited triplet ensemble is being efficiently dissipated: thus a well observable competition occurs between, on one side the population of the oxygen singlet state, and on the other side, the emissive (phosphorescence and delayed fluorescence) and non-emissive (triplet to triplet) energy transfer processes. In specific cases, when the oxygen concentration is correspondingly high, all other relaxation channels could be completely suppressed except the generation of singlet oxygen. Correspondingly, neither residual sensitizer phosphorescence (in the case of TTA–UC), nor delayed emitter fluorescence (in both processes, TADF and TTA–UC) could be observed. The physical phenomenon, behind these observable responses of the TADF- or TTA–UC systems, is the TTA process occurring between the excited triplet state of the organic molecule and the ground triplet state of the oxygen molecule. As a result, the organic molecule returns back to its singlet ground state and the oxygen molecule gains the energy of both triplet states and is excited to the metastable singlet state (1Δg, further called singlet oxygen).Singlet oxygen is a highly reactive species,48–50 leading to the real-time oxidation of photoactive organic molecules even at room temperature. Furthermore, the singlet oxygen, formed during the optical excitation, takes part in a Diels–Alder type process on a parent sensitizer molecule (in the case of TTA–UC), which leads to a loss of conjugation in the π-system and to a severe decrease of the Q-band absorption. A similar process is also involved in photobleaching of the fluorescent chromophores, e.g. anthracenes, perylenes, etc.51–56 Thus, the TADF– and TTA–UC processes suffer doubly due to the presence of molecular oxygen – first, because corresponding to the oxygen concentration and/or on the rate of oxygen molecular diffusion significant amounts of optically/electrically excited organic triplet states are being lost, and second (which is an even more destructive consequence) – a considerable amount of the photoactive molecules are being damaged and they fail out from the delayed fluorescence processes.
However, the excitation pathways creating the densely populated triplet ensembles, essential for the TADF-systems and the TTA–UC systems, possess a crucial difference: while the TADF-process is accelerated predominantly via electrical excitation,15–17 the TTA–UC process is optically activated via the energy exchange between energetically optimized ensembles of sensitizer/emitter molecular couples.18–25 Following the radically different excitation schemes, the TADF and TTA–UC processes exhibit substantially divergent requirements for the electronic structure of the participating organic molecules.
The energetic scheme of the TADF-process, broadly discussed in ref. 57–59, is elucidated in Fig. 1 (published by ref. 60). The main objective of the TADF-research is to design and synthesize organic molecules with a small energy gap (ΔEST) between the S1 and T1 levels of the photoactive organic molecule. Organic molecules,57–59 demonstrating simultaneously a small energy gap (ΔEST < 100 meV) and a reasonable radiative decay rate (higher than 106 s−1), show efficient TADF-luminescence. The synthetic efforts leading to a substantial increase of the magnitude of the ΔEST energy gap have been reviewed in the recent publications.61–63
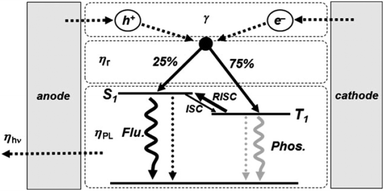 | ||
| Fig. 1 Schematic view of the electroluminescence mechanism: carrier injection, transport, recombination; and radiative decay processes. The thermally activated delayed fluorescence (TADF) process is highlighted (γ: ratio of holes and electrons in carrier injection, transport, and recombination processes; ηr: singlet and triplet exciton formation ratio; ηPL: photoluminescence efficiency; ηhν: light out-coupling efficiency; ISC: intersystem crossing; and RISC: reverse intersystem crossing). Reprinted (adapted) with permission.60 Copyright © 2009 WILEY-VCH Verlag GmbH & Co. KGaA, Weinheim. | ||
A typical sample temperature dependence of the Q. Y. of delayed fluorescence for an electrically excited TADF-system is shown in Fig. 2 (the blue triangles).
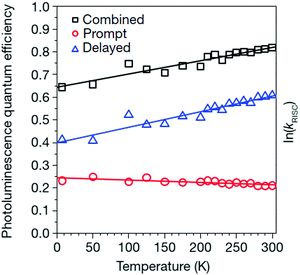 | ||
| Fig. 2 Temperature dependence of photoluminescence quantum efficiencies (errors are within 2%) for combined (prompt plus delayed; black squares), prompt (red circles) and delayed (blue triangles) components of 4CzIPN emission for the 5 ± 1 wt% 4CzIPN:CBP film. The straight lines are guide for the eyes. Reprinted (adapted) with permission.57 Copyright © 2012, Nature Publishing Group, a division of Macmillan Publishers Limited. | ||
It is well seen, that for a temperature interval of nearly ΔT ∼ 200 K, the Q. Y. of the delayed fluorescence signal increases more than 50%.
Oppositely, the process of TTA–UC in a soft matter environment, possesses a much stronger dependence on the sample temperature of the signal of delayed fluorescence. For instance, for a temperature interval of nearly ΔT ∼ 40 K, the Q. Y. of the delayed fluorescence signal is increased more than 400%.64–66 Simultaneously, the energy gap between S1 and T1 levels of the fluorescent organic molecule is substantially larger, for instance ΔEST ∼ 0.8–1.2 eV.18–25
Annihilation upconversion in organic systems
This review will concentrate on the thermally activated delayed fluorescence in an optically accessed soft matter environment via the TTA–UC process. Briefly, the TTA–UC process takes place in a multi-chromophore system consisting of energetically optimized pairs of sensitizer (metallated macrocycles) and emitter molecules (aromatic hydrocarbons), as shown in Fig. 3. The photon energy is absorbed by the sensitizer (dark red arrow, Fig. 3) and stored in its triplet state, formed in the process of intersystem crossing (ISC). This energy is transferred to an emitter triplet state via the process of triplet–triplet transfer (TTT). The excited triplet states of the two emitter molecules undergo triplet–triplet annihilation (TTA), in which one emitter molecule returns to its singlet ground state and the other molecule gains the energy of both triplet states and is excited to the higher singlet state. As the emitter singlet state decays radiatively back to the ground state, a delayed emitter fluorescence (red arrow, Fig. 3, called shortly dF), bearing a higher energy than that of the excitation photon, is emitted. Simultaneously, if the energy overlap between the triplet manifolds of the emitter and sensitizer molecules is not optimal or if the rotational diffusion of the interacting sensitizer/emitter triplet states is not high enough, the sensitizer triplet state will not be completely depopulated and hence, residual sensitizer phosphorescence (violet arrow, Fig. 3, called shortly rPh) will be observed, as well. The term “residual” sensitizer phosphorescence is important, while the emitting sensitizer triplet state is substantially disturbed – i.e. depopulated – by the processes of TTT, and TTA. Therefore, the dynamical characteristics of the residual sensitizer phosphorescence will differ noticeably from those of a neat sensitizer ensemble, keeping all other experimental parameters the same.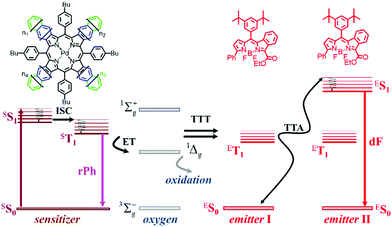 | ||
| Fig. 3 Simplified energetic scheme of the triplet–triplet annihilation upconversion process in an oxygen rich environment. Inset: Chemical structures of the sensitizer – mixed palladium benzo- naphtho- porphyrins, n = 1, 0 (PdBNP); emitter – MPh-MB-BODI PY. Reprinted (adapted) with permission.68 Copyright 2021 American Chemical Society. | ||
The process of TTA–UC is based on optically excited triplet ensembles, thus, the excitation transfer mechanism must be Dexter-type – via direct electron exchange (Fig. 4) between the participating organic molecules.35,36,67 It must be mentioned explicitly, that both processes – TTT and TTA – are obliged to use the Dexter-type energy exchange mechanism. Following the classical description,35,36,67 the Dexter process requires a wave function overlap between the donor and acceptor – i.e. it can only occur at short distances,67 typically within 10 Å. The Dexter energy transfer rate kDET is given by the proportionality: kDET ∼ J![[thin space (1/6-em)]](https://www.rsc.org/images/entities/i_char_2009.gif) exp(−2r/L), where J is the spectral overlap integral and is given by
exp(−2r/L), where J is the spectral overlap integral and is given by  , and r is the sensitizer (i.e. donor) – emitter (i.e. acceptor) separation; L is the sum of the van der Waals radii of the donor and the acceptor.
The classical case of p-type delayed fluorescence (this is a synonym of TTA–UC), where the optically-active dye molecules are co-crystallized in organic crystals, is well described by this model.35,36,67 In these classical studies, the TTA-process was observed and theoretically described for the specific case of an organic-crystal environment. The classical physical picture consists of TTA – donor and TTA – acceptor molecules, co-crystallized in a matrix of small organic molecules, serving as a solid-state solvent.
There is plethora of material characteristics and experimental conditions, which are drastically different for the optically excited TTA-process in a soft matter environment and optically excited TTA-process in organic crystals:
(1) The energy of the excited triplet states of the solid-state solvent (organic crystal) is comparable with the triplet energy levels of the interacting molecules
Oppositely, in a soft matter matrix (or hydrophobic solvent), this triplet energy difference is more than 10 times higher45,46
(2) The classical, crystal-embedded TTA-systems are not sensitive to moderate temperature changes, for instance in the range of ΔT ∼ 50 K. Oppositely, the soft matter-based TTA-systems are very sensitive to local, tiny changes of the temperature (ΔT ∼ 0.1 K) or solvent viscosity changes68,69 – i.e. temperature sensitivity more than 2 orders of magnitude higher.
(3) Furthermore, crystal-embedded TTA-systems demonstrate relatively low external quantum efficiency (QY ∼ 10−4) of the process.35,36 Correspondingly, the external quantum yield of the process is more than 1000 times higher,29–34i.e. QY ∼ 10−1.
Since the first observation of first p-type delayed fluorescence, the dependence of the triplet–triplet annihilation on the sample temperature was studied intensively first in solid matrices70,71 and then in liquid solvent.72 In Fig. 5 (originally published in72), the dependence of the parameter α representing (indirectly) the probability for the formation of the singlet pyrene excited state is shown.
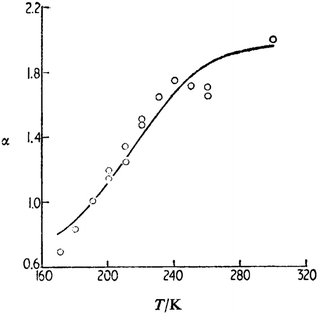 | ||
| Fig. 5 Comparison of experiment and theory for the temperature dependence of α (pyrene in ethanol): O, experiment, —, theory, = 7 × 10¹⁴ s−1, L = 0.17 nm, and B = 0.936. Reprinted (adapted) with permission.72 Copyright 1989, Journal of Chemical Society. | ||
The developed model72 was able to reproduce the experimental temperature dependence with realistic parameters for the long range interaction leading to TTA.
The kinetics of diffusion-controlled TTA, studied in a viscous solution and under long-pulse excitation was successfully described by the modified version of Smoluchowski's original theory.73 It is important to note that the temperature window observed was relatively narrow (ΔT = 134–150 K) and away from room-temperature range, Fig. 6.
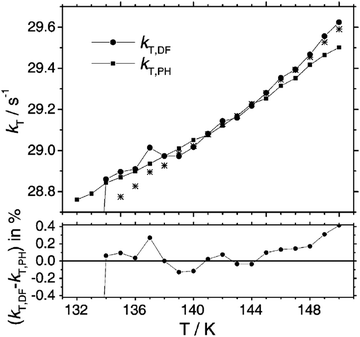 | ||
| Fig. 6 Temperature dependence of the triplet decay rate constant kT as obtained from the fit of eqn (12)73 to the time dependence of the delayed fluorescence (kT,DF, solid circles, hom) in comparison with values obtained directly from the phosphorescence decay (kT,PH, solid squares). The stars represent values of kT,DF that were obtained without applying the weighting procedure in the evaluation of IDF(t). The lower graph represents the difference between kT,DF (●) and kT,PH (■) in percent. Reprinted (adapted) with permission.73 Copyright 2004, Royal Society of Chemistry. | ||
The main particular characteristics of the classical, crystal-embedded or solution processed TTA-systems, is the absence of a sensitizer molecule (as shown in Fig. 3). Thus, most of them are working in the so called “small signal regime” – i.e. the amount of emitter molecules in the excited triplet state is small in comparison with the total number of optically active molecular species. Oppositely, in the process of sensitized TTA–UC (Fig. 3) the concentration of emitter molecules in the excited triplet state is comparable with the total number of the studied molecules, thus the dynamical response of the TTA–UC system on external stimuli, such as temperature and/or the presence of molecular oxygen in triplet ground state, has much more complicated appearance.
Fig. 7 shows the temperature dependence of the signal of delayed fluorescence for the TTA–UC system comprising commercial available active materials, such as palladium(LL) octaethylporphyrin/9,10-diphenylanthracene distributed in polymer matrices, such as ethyleneoxide–epichlorohydrin copolymer or polyurethane with different molecular masses.74 It is well seen, that if the glass transition temperature (TG) for the given polymer matrix is reached, the TTA–UC system shows the highest dF emission. Furthermore, when the sample temperature exceeds TG, this leads to a decrease of the optical signal (Fig. 7b).
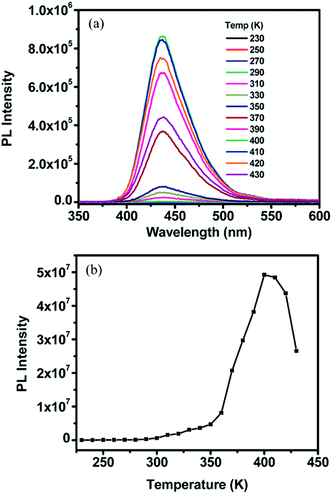 | ||
| Fig. 7 (a) Select upconversion emission profiles of an EO-EPI film containing (0.22 mM) PdOEP and (18.1 mM) DPA measured at variable temperatures upon excitation at 544 nm with 2 mJ per pulses at a rate of 10 Hz. (b) Integrated upconverted emission intensity as a function of temperature for the plot shown in (a). The sampling width was 500 ns, and the delay time ranged from 1–100/is. It should be noted that the integrated area at each temperature was obtained from the maximum intensity reached for each respective temperature which occurred at a variable delay time. Reprinted (adapted) with permission.65 Copyright 2009 American Chemical Society. | ||
A good example of the sensitivity of the TTA–UC system on the environmental parameters, including not only sample temperature, but also the viscosity characteristics of the embedding matrix (optically not active) is shown in Fig. 8. In this experiment, the TTA–UC system reacts at the elevated sample temperature in an unusual manner: the dF-intensity decreases substantially with the increase of the sample temperature. This behaviour cannot be attributed to some sample degradation (photo oxidation) or phase separation, since almost no hysteresis in the “up” or “down” temperature change was observed. Later, similar temperature dependence of TTA–UC was reported in ref. 76.
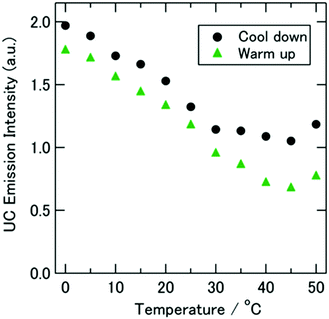 | ||
| Fig. 8 Temperature dependence of the spectrally integrated UC emission intensity measured upon CW excitation at 632.8 nm. The sample was made with [C4mim][NTf2] and set inside an ultrahigh-vacuum cryostat. The experiment started at 50 °C, then cooled (circles, to −60 °C; see Fig. S6 in the ESI of ref. 75) and warmed to 50 °C again (triangles). The sample amount was 110 μL. A time interval of 5 to 15 min was taken between the adjacent data points. Reprinted (adapted) with permission.75 Copyright 2013 American Chemical Society. | ||
Also in multiphasic protein hydrogels,88 the intensity of the delayed fluorescence decreases with the increase of the sample temperature. This experiment is performed in an air-saturated environment and no additional efforts for protection of the optically excited organic triplet ensembles against quenching by molecular oxygen present in the water environment and actively diffusing through the protein hydrogel were made. It is known, that oxygen diffusion increases substantially with the temperature increase (Fig. 9).92
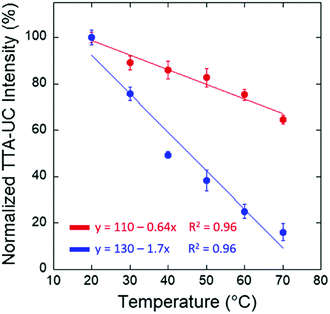 | ||
| Fig. 9 Normalized TTA–UC emission intensity at 434 nm for the BSA/SDS/1/DPA hydrogel and at 476 nm for the BSA/SDS/3/Pery hydrogel with respect to temperature. Reprinted (adapted) with permission.88 Copyright 2020 American Chemical Society. | ||
As mentioned earlier, if the rotational diffusion of the interacting sensitizer/emitter triplet states is not high enough, the sensitizer triplet state will not be completely depopulated and therefore, simultaneously the signals of delayed fluorescence, as well as the signal of residual sensitizer phosphorescence will be observed.
Applying poly(methyl methacrylate (PMMA, MW = 350 kDa) as the TTA–UC matrix, it was possible to demonstrate experimentally thermally switchable emission between 2 main colors – blue (the delayed fluorescence of the emitter, DPA) and red (the phosphorescence of the sensitizer, PtEOP).77 Even more, by carefully tuning the sample temperature it was possible to suppress completely (by a lower temperature) the delayed fluorescence signal, or vice versa – at higher temperature, to avoid any residual phosphorescence emission (Fig. 10). This thermo-switchable behavior of TTA–UC was extended to eco-friendly hydrogels.78
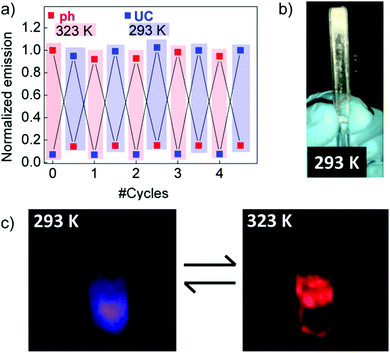 | ||
| Fig. 10 (a) Repetitive UC and phosphorescence emission switching by thermal cycling this sample between 293 and 323 K. (b) Solid EC matrix containing the PtOEP–DPA UC pair. (c) Digital photographs of the emission resulting from the PtOEP–DPA EC solution at 293 K and 323 K. Reprinted (adapted) with permission.77 Copyright 2016 American Chemical Society. | ||
The remarkable ability of the TTA–UC organic system to emit 2 optical signals, namely delayed fluorescence (dF from Fig. 3) and residual phosphorescence (rPh from Fig. 3), as a reaction on a single external stimuli (modulation of the local sample temperature and/or alteration of the local concentration of the molecular oxygen), ensures in a natural manner the so called ratiometric-type response.79 There is no necessity to add an external species, whose optical response do not depend on the acting environmental parameter, in order to create a ratiometric sensing scheme. The physical processes modulating the signals of dF and rPh are strongly different, thus the TTA–UC sensing system ensures two independent measurable parameters,80 originating from the same primary optically excited triplet ensemble.82,83
Beside these remarkable advantages, the sensing techniques based on TTA–UC are seriously affected by their own sensitivity – the process is influenced not only by local temperature and oxygen concentration, but also by local concentration variations of the active dyes, viscosity properties of the matrix and the approaching of its glass transition temperature, lateral intensity distribution of the excitation light, etc. The T-response and O2-response of the TTA–UC system are interconnected, causing severe experimental complications: as mentioned explicitly in ref. 81 “…the local temperature change is probably the single biggest source of error in optical sensors for oxygen…”. Sample temperature is known to affect (a) the phosphorescence quantum yield (QYPhos) of the used dye; (b) the quenching constant(s); (c) the solubility of oxygen; (d) the diffusion of oxygen; and (e) the ability for singlet–triplet and triplet–singlet transitions.37,38 On the other hand, even the presence of a small (in the range of ppm O2) amount of molecular oxygen will transform the T-response of an optically excited triplet ensemble in a non-predictable manner.47
Thus, to fully demonstrate the substantial advantages of the TTA–UC process used as a T-sensing tool, creation of concepts for effective oxygen diffusion suppression, as well as protection against the subsequent photo oxidation, caused by the generated reactive singlet oxygen is a decisive requirement. An effective solution of this experimental problem is the performance of the TTA–UC process in a nano-confined environment.50 Recently, a comprehensive review84 elucidating the various protection strategies, applicable on the nanoconfined TTA–UC systems was published. Fig. 11 shows the most used protection strategies. Besides the application of physical barriers, preventing oxygen diffusion (Fig. 11b) or usage of exogenous antioxidants (Fig. 11c), interacting with all-types of oxygen, the third example (Fig. 11d), where only the oxygen in the excited singlet state is chemically bound, keeps all advantages of TTA–UC as a sensing process. This fact explains the intensive search for sacrificial singlet oxygen scavenging (SSOS) materials, optimized for the process of TTA–UC.
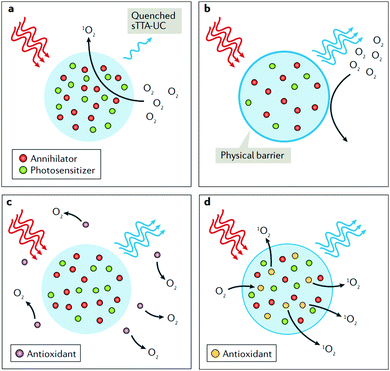 | ||
| Fig. 11 Chemical strategies to prevent quenching of sTTA-UC by triplet or singlet dioxygen. (a) Quenching of sensitized triplet–triplet annihilation upconversion (sTTA-UC) emission by dioxygen via singlet oxygen generation. (b–d) Three chemical strategies for alleviating or suppressing the oxygen sensitivity of sTTA-UC bioprobes and drug delivery devices. In part b, a physical barrier prevents the diffusion of O2 into the nanoparticle; in part c, exogeneous antioxidants quench ground-state (3O2) or singlet oxygen (1O2); in part (d), the antioxidants are added in the formulation of the nanoparticle. Reprinted (adapted) with permission.84 Copyright © 2018, Nature Publishing Group, a division of Macmillan Publishers Limited. | ||
It is important to state the selection criteria for SSOS-materials: (i) the SSOS – molecules must bind chemically only the singlet oxygen present in the sensing structure. The formed oxidation products must be chemically stable for the temperature region of interest (Tmax < 50 °C, if the T-sensing is applied in biological samples90). This requirement is of critical importance: if the SSOS-material works as a common antioxidant, i.e. chemically binding even the molecular oxygen in the ground state (at the given temperature), the O2-sensing feature will be lost;80 (ii) the SSOS – molecules must show pronounced hydrophobicity/amphiphilicity and be well miscible with organic solvents/matrices. This requirement is basic: the TTA–UC process is demonstrated up to now only in a hydrophobic/amphiphilic environment. In order to achieve TTA–UC in a water environment, it is necessary to embed the active moieties in oil-in-water microemulsions,85 core/shell nanocapsules86 or oil-laden microcapsules,87 multiphasic protein hydrogels88 or an enzymatic environment;89 (iii) the SSOS – molecules must demonstrate relatively low viscosity and in ideal case be in the liquid state for the temperature region of interest; and (iv) SSOS-molecules must be inherently bio-compatible and non-toxic.
An example of a TTA–UC system68 adapted for T-sensing in a realistic, air saturated environment with the dF-spectrum, as well as the rPh-spectrum optimally coinciding with the tissue transparency window91 of the human skin is shown in Fig. 12b. With the purpose of keeping the photodynamic stress for the living organism on an acceptable level, the excitation intensity for sensing is low, comparable with the intensity of 1 Sun, simultaneously the excitation wavelength λexc = 658 nm exhibits minimal interaction with the surrounding tissue.
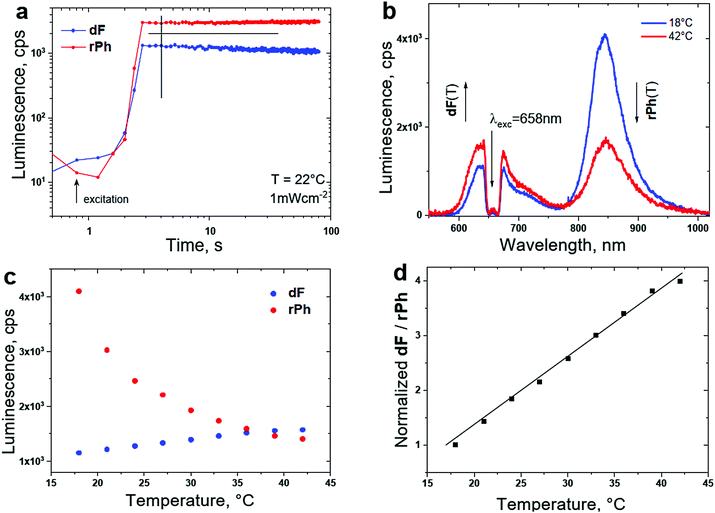 | ||
| Fig. 12 (a) Temporal evolution of the signals of dF and rPh at a sample temperature of T = 22 °C. (b) Luminescence spectra of the UC-systems for different sample temperatures; (c) temperature dependence of the signals of dF (at λmax = 630 nm, the blue dots) and rPh (at λmax = 850 nm, the red dots) on the sample temperature; (d) temperature calibration curve – ratiometric response. Normalized ratio of the signals of dF/rPh as a function of the sample temperature, demonstrated in (c). Experimental conditions for all measurements: material composition, as follows, 1 × 10⁻⁵ M PdBNP/2 × 10−4 M MPh-MB-BODIPY/40 wt% carnauba wax/wt% 30 squalene/30 wt% peanut oil. The spectra are obtained at t = 4 s after starting the optical excitation. The excitation intensity is kept constant, at 1 mW × cm−2 for all measurements; cw – diode laser at λexc = 658 nm; an air saturated environment. Excitation spot diameter d = 1.8 × 10⁻³ m; sample thickness b = 4 × 10⁻⁴ m. Reprinted (adapted) with permission.68 Copyright 2021 American Chemical Society. | ||
As shown in Fig. 12, the chosen biocompatible SSOS moieties (squalene oil/peanut oil) ensure fast and efficient chemical bonding of the dissolved molecular oxygen into the TTA–UC matrix (even in an air-saturated environment). As a result, after a short time interval (nearly Δt ∼ 4 s), the optical signals of dF and rPh reach their stationary values, Fig. 12a. As common behaviour for soft matter based TTA–UC systems, the intensity of the dF-signal grows when the sample temperature increases, and simultaneously, the rPh-signal decreases substantially, Fig. 12b and c. The normalized ratio of these stationary signals reveals the local (across the optically excited spot) temperature. In Fig. 12d the non-ambiguous calibration curve is shown.
Although the majority of organic materials embedding the TTA–UC system, like squalene shark liver oil, peanut oil and carnauba wax, are FDA-approved substances, it is absolutely essential to prove the cell toxicity of the T-sensing system. Therefore, sustainable and reproducible sensing data could be obtained only after solving the experimental problems: (i) across the optically excited spot, the present amount of molecular oxygen must be chemically bound, in order to exclude its influence on the dynamic behaviour of the signals of dF and rPh. This could be done either by application of SSOS-materials or by performing the T-sensing procedure in an oxygen free environment (glove-box conditions); (ii) The diffusion of oxygen towards the optically excited spot must be controlled, for example by application of packaging materials. Nevertheless, it is very elaborate to completely suppress the oxygen diffusion in organic materials, a water environment, etc. (as good as in inorganic glass/crystal materials). This experimental fact limits the lifetime of the TTA–UC systems and the T-sensing scheme based on them. In order not to confuse the reader, it is always important to define explicitly the time span/excitation intensities/concentration of oxygen/temperature conditions, during which the TTA–UC systems are “air-tolerant”: indeed, there are many TTA–UC systems able to emit dF and rPh optical signals even in an air-rich environment, but with continuously decreasing intensity; (iii) last, but not least, for each TTA–UC material composition the cell toxicity test must be performed. Only after determination of the cell toxicity concentration, and working below it, the performed T-sensing procedure could be stated as minimally invasive. The omission of any of these experimental steps will influence the T-sensing results in a non-predictable manner.
In Fig. 13, the cell viability test for T-sensing TTA–UC nanoparticles, based on UC-couple PdTBP (Pd-meso-tetraphenyl tetrabenzoporphyrin)/BDMBP (3,10-bis(3,3-dimethylbutyl-1-yn-1-yl)perylene) encapsulated in PMMA (poly(methyl methacrylate, 120 kDa))-shell and RBO (rice bran oil)-core, is shown.
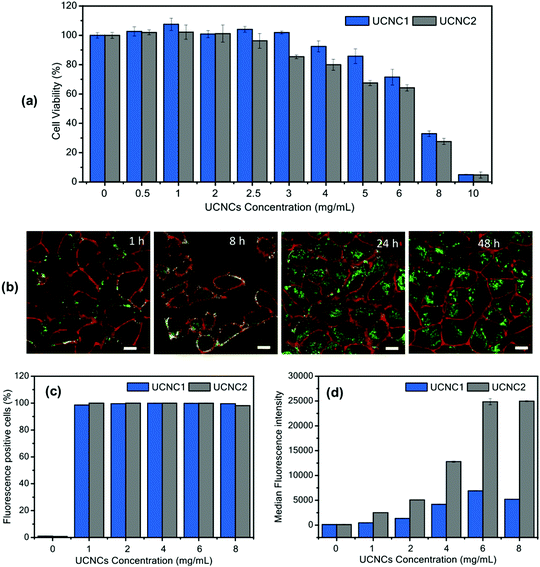 | ||
| Fig. 13 (a) Cell viability assay of HeLa cells after being treated with UCNCs for 24 h. (b) Confocal laser scanning microscopy (cLSM) images of HeLa cells incubated with UCNC2 at 6 mg mL−1 for various incubation times. The cell membrane was stained with CellMaskOrange and pseudocolored in red. The direct fluorescence emission from encapsulated BDMBP dye was detected and pseudocolored in green. The scale bar is 10 μm. Flow cytometry analysis showing (c) percentage of fluorescence-positive cells and (d) median fluorescence intensity (MFI) obtained from the direct fluorescence emission of encapsulated BDMBP dye in UCNC1 and UCNC2 incubated in HeLa cells for 24 h. Reprinted (adapted) with permission.86 Copyright 2020 American Chemical Society. Note: further permission related to the material excerpted should be directed to the ACS. | ||
In Fig. 14a the temperature-dependent luminescent spectra of UCNC2 nanocapsules taken up by HeLa cells are shown, together with the temperature calibration curve (Fig. 14b).
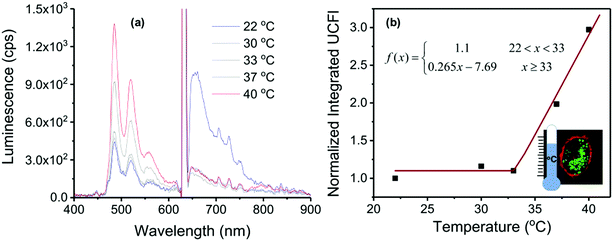 | ||
| Fig. 14 (a) Temperature-dependent luminescent spectra of UCNC2 nanocapsules taken up by HeLa cells, excitation at λexc = 633 nm, 256 mW × cm−2 HeNe laser. (b) Temperature-dependence of the normalized integral UC fluorescence (UCFl) defined from the spectra in part a (integral region is from λ0 = 460 nm to λf = 620 nm) for use as a potential calibration curve (residual phosphorescence is small but almost constant). Inset: confocal image of HeLa cells with UCNCs illustrating the use as a nanothermometer. Reprinted (adapted) with permission.86 Copyright 2020 American Chemical Society. Note: further permission related to the material excerpted should be directed to the ACS. | ||
Performing the process of TTA–UC in a nanoconfined environment, such as nanoparticles, nanocontainers or micelles leads to a drastic reduction of the sensor physical parameters, allowing the measured temperature to be stated as a “local” temperature. Simultaneously in a nanoconfined environment, the process of TTA–UC encounters additional complications – i.e. the accelerated oxygen diffusion throughout the 3D-interface of the nanosensor (NS) and relatively low amount of SSOS-materials embedded in the NS-core. The oxygen diffusion is modulated by the presence of surfactants and mixture of hydrophobic NS-core materials with partial amphiphilicity (natural oils and waxes). It is assumed, that diffusion of oxygen throughout the 3D-interface of the nanosensor is relatively slow process, and equilibrium is reached after relatively long interaction time. So, the molecular concentration of the oxygen, dissolved in the continuous phase (a water environment or cytoplasm) and the molecular concentration of the oxygen, dissolved in the dispersed phase (nanosensor core) can be treated as stationary. Therefore under certain experimental conditions (i.e. given excitation intensity and/or given molar concentration of the sensitizer) it will be possible to observe approximately steady state UC-emission: in this case, the rate of oxygen diffusion through the NS-shell will be substantially smaller than the rate of chemical binding of the oxygen inside the NS-core. Even more, the intensity of the measured signals of dF and rPh will approach to the signal-parameters measured in an oxygen-free environment. Thus, for a limited time period, the NS-core performs as an oxygen-free environment. The duration of this period depend on the degree of contamination with oxygen, from the sample temperature and from the diffusion of excited triplet states.
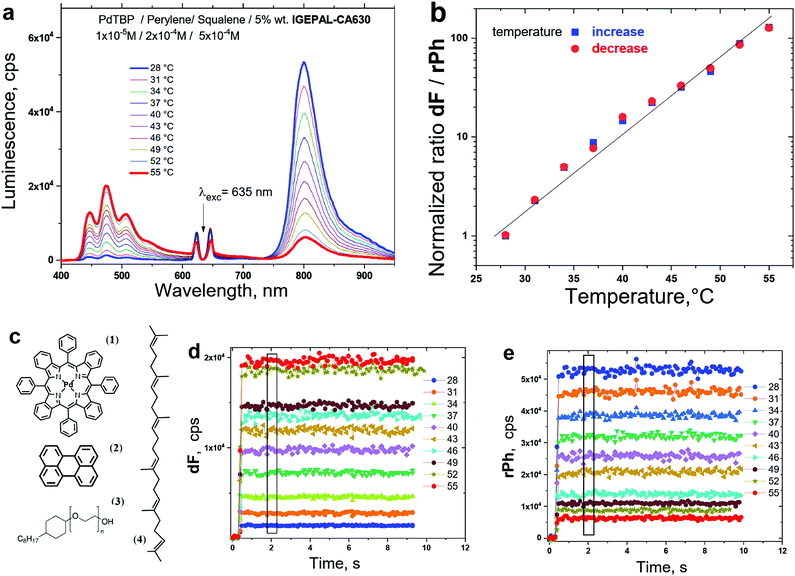
The experimental requirements for reproducible temperature sensing, based on the temperature dependence of the TTA–UC process are summarized in Fig. 15. Here, the nanosensor is a micelle of non-ionic surfactant, embedding the UC-active materials and the SSOS-moiety.
(i) The ratiometric-type response on a single external stimuli (in this example, the sample temperature) is achieved, since the TTA–UC system emits 2 optical signals, dF and rPh, each of them with strongly different physical origin. Consequently, both signals are modulated by the temperature in an independent manner.
(ii) The process of excited triplet state quenching by the molecular oxygen must be suppressed completely. Therefore, first the UC-samples should be prepared in an oxygen-free environment. Even more importantly, the penetration of molecular oxygen into the optically accessed spot (the laser spot) must be compensated. For the micellar TTA–UC system, shown in Fig. 15, this is achieved by adding an efficient sacrificial singlet oxygen scavenger (SSOS), used as emollient in the process of micelle formation (squalene, Fig. 15c, structure 4). Always, the amount of SSOS must correspond to the experimental conditions: for instance, the micellar TTA–UC system from Fig. 15 can function in reproducible manner only in a cell-cultures, exposed to pronounced hypoxia.
(iii) The specific dF and rPh optical signals should be registered when the system light emission reaches steady-state conditions. For example, for the system shown in Fig. 15, the signals after the first few seconds are stable enough. In Fig. 15d and Fig. 15e the period for signal averaging is marked with a rectangular.
(iv) It is very important to point out that no temperature hysteresis is should be observed; as a result, it is possible to create a non-ambiguous calibration curve, connecting the ratio of the integral dF/rPh and the sample temperature (Fig. 15b). Such lack of hysteresis can be obtained only if the problem of oxygen contamination and/or oxygen penetration is solved successfully.
(v) The temperature sensing systems must pass a cell-toxicity test, only then the sensing can be stated as minimally-invasive.
(vi) Many of the TTA–UC temperature sensing systems are applied for testing of life-science samples. This requires not only to match optimally with the tissue transparency window, but also to demonstrate high sensitivity for the physiologically important temperature region, centred at T = 37 °C. For example, the ratio dF/rPh for the micellar system shown in Fig. 15b is changed more than 100 times for a temperature span of 27 degrees.
Nevertheless, it must be mentioned explicitly, that such micelles of non-ionic surfactants (from the family of PTS, IGEPAL-CA630, TritonX-100, etc.), embedding the TTA–UC materials, demonstrate a crucial drawback: they show mechanical instability – the micelles exist only in a liquid environment; the presence of any solid state interfaces destroys the micelles. Unfortunately, none of the reported TTA–UC systems up to now fulfils the so stated experimental requirements abundantly: either the sensitivity is moderate (Fig. 10a, 12d and 14b), or the absence of residual phosphorescence signal (Fig. 7), prevents observation of ratiometric response.
Conclusions
In this critical review (without the claim to be comprehensive), we compare the dependences of the delayed fluorescence on the sample temperature, generated via the thermally activated delayed fluorescence and the triplet–triplet annihilation upconversion processes. Special attention was paid to the common experimental appearance of the dynamical properties of the delayed fluorescence arising either from TADF-systems, or by TTA–UC ensembles. Simultaneously, the attention of the reader was concentrated on the substantially different methods for creating densely populated triplet ensembles. For the TADF-solid state systems, the delayed fluorescence process is a consequence of an electrical excitation; for soft matter embedded TTA–UC organic systems, sensitizer molecules with a large ISC-coefficient are present, combined with optical excitation results in the observation of upconverted delayed fluorescence, as well as residual phosphorescence. Furthermore, the enormous sensitivity of the TTA–UC process on the local temperature was elucidated and the experimental requirements for reproducible, all-optical and minimally invasive temperature sensing were stated.Author contributions
Conflicts of interest
There are no conflicts to declare.Acknowledgements
This work was supported by inSight Collaborative Research Centre, SFB1450/C06 “Nanocapsule-based functional analysis of myeloid cells and platelets in autoimmune diseases”; S. Baluschev thanks the KΠ-06-H37/15-06.12.19 SunUp-project of the Bulgarian National Science Fund for financial support.Notes and references
- S. Tombe, E. Antunes and T. Nyokong, J. Mol. Catal. A: Chem., 2013, 371, 125 CrossRef CAS.
- S. Guo, L. H. Ma, J. Z. Zhao, B. Kucukoz, A. Karatay, M. Hayvali, H. G. Yaglioglu and A. Elmali, Chem. Sci., 2014, 5, 489 RSC.
- J. Kyriakopoulos, A. T. Papastavrou, G. D. Panagiotou, M. D. Tzirakis, D. Manolis, K. S. Triantafyllidis, M. N. Alberti, K. Bourikas, C. Kordulis, M. Orfanopoulos and A. Lycourghiotis, J. Mol. Catal. A: Chem., 2014, 381, 9 CrossRef CAS.
- K. Mori, Y. Kubota and H. Yamashita, Chem. – Asian J., 2013, 8, 3207 CrossRef CAS PubMed.
- J. F. Sun, F. F. Zhong and J. Z. Zhao, Dalton Trans., 2013, 42, 9595 RSC.
- X. Xiong, F. Song, J. Wang, Y. Zhang, Y. Xue and L. Sun, et al. , J. Am. Chem. Soc., 2014, 136, 9590–9597 CrossRef CAS PubMed.
- S. Gan, J. Zhou, T. A. Smith, H. Su, W. Luo and Y. Hong, et al. , Mater. Chem. Front., 2017, 1, 2554–2558 RSC.
- Q. Zhao, M. X. Yu, L. X. Shi, S. J. Liu, C. Y. Li, M. Shi, Z. G. Zhou, C. H. Huang and F. Y. Li, Organometallics, 2010, 29, 1085 CrossRef CAS.
- Q. Liu, B. R. Yin, T. S. Yang, Y. C. Yang, Z. Shen, P. Yao and F. Y. Li, J. Am. Chem. Soc., 2013, 135, 5029 CrossRef CAS PubMed.
- O. S. Finikova, A. Galkin, V. Rozhkov, M. Cordero, C. Hagerhall and S. A. Vinogradov, J. Am. Chem. Soc., 2003, 125, 4882 CrossRef CAS PubMed.
- K. Koren, R. Dmitriev, S. Borisov, D. Papkovsky and I. Klimant, ChemBioChem, 2012, 13, 1184 CrossRef CAS PubMed.
- S. Hess, A. Becker, S. Baluschev, V. Yakutkin and G. Wegner, Macromol. Chem. Phys., 2007, 208, 2173 CrossRef CAS.
- C. Tonge, N. Paisley, A. Polgar, K. Lix, W. R. Algar and Z. Hudson, ACS Appl. Mater. Interfaces, 2020, 12, 6525–6535 CrossRef CAS PubMed.
- N. Paisley, C. Tonge and Z. Hudson, Front. Chem., 2020, 8, 229 CrossRef CAS PubMed.
- M. Y. Wong and E. Zysman-Colman, Adv. Mater., 2017, 29, 1605444 CrossRef PubMed.
- H. Wu, L. Ying, W. Yang and Y. Cao, Chem. Soc. Rev., 2009, 38, 3391–3400 RSC.
- Y. Tsuchiya, K. Ikesue, H. Nakanotani and C. Adachi, Chem. Commun., 2019, 55, 5215–5218 RSC.
- Y. Y. Cheng, B. Fuckel, T. Khoury, R. G. C. R. Clady, M. J. Y. Tayebjee, N. J. Ekins-Daukes, M. J. Crossley and T. W. Schmidt, J. Phys. Chem. Lett., 2010, 1, 1795 CrossRef CAS.
- A. Turshatov, D. Busko, S. Baluschev, T. Miteva and K. Landfester, New J. Phys., 2011, 10, 083035 CrossRef.
- C. Wohnhaas, A. Turshatov, V. Mailaender, S. Lorenz, S. Baluschev, T. Miteva and K. Landfester, Macromol. Biosci., 2011, 11, 772 CrossRef CAS PubMed.
- S. K. Sugunan, C. Greenwald, M. F. Paige and R. P. Steer, J. Phys. Chem. A, 2013, 117, 5419 CrossRef CAS PubMed.
- X. Cao, B. Hu and P. Zhang, J. Phys. Chem. Lett., 2013, 4, 2334 CrossRef CAS.
- J. S. Lissau, D. Nauroozi, M. P. Santoni, S. Ott, J. M. Gardner and A. Morandeira, J. Phys. Chem. C, 2013, 117, 14493 CrossRef CAS.
- P. C. Boutin, K. P. Ghiggino, T. L. Kelly and R. P. Steer, J. Phys. Chem. Lett., 2013, 4, 4113 CrossRef CAS.
- S. Borisov, R. Saf, R. Fischer and I. Klimant, Inorg. Chem., 2013, 52, 1206 CrossRef CAS PubMed.
- M. Olaru, E. Rychagova, S. Ketkov, Y. Shynkarenko, S. Yakunin, M. V. Kovalenko, A. Yablonskiy, B. Andreev, F. Kleemiss, J. Beckmann and M. Vogt, J. Am. Chem. Soc., 2020, 142, 373 CrossRef CAS PubMed.
- Z. Yang, Z. Mao, Z. Xie, Y. Zhang, S. Liu, J. Zhao, J. Xu, Z. Chi and M. P. Aldred, Chem. Soc. Rev., 2017, 46, 915 RSC.
- D. H. Ahn, S. W. Kim, H. Lee, I. J. Ko, D. Karthik, J. Y. Lee and J. H. Kwon, Nat. Photonics, 2019, 13, 540 CrossRef CAS.
- Y. Murakami, Y. Himuro and S. Maeda, Phys. Chem. Chem. Phys., 2017, 19, 30603 RSC.
- K. A. El Roz and F. N. Castellano, Chem. Commun., 2017, 53, 11705 RSC.
- L. G. von Reventlow, T. Schmidt and A. Colsmann, J. Mater. Chem. C, 2018, 6, 3845–3848 RSC.
- J. Pedrini and A. Monguzzi, J. Photonics Energy, 2017, 8(2), 022005 Search PubMed.
- V. Gray, et al. , Coord. Chem. Rev., 2018, 362, 54–71 CrossRef CAS.
- S. H. C. Askes and S. Bonnet, et al. , ACS Biomater. Sci. Eng., 2017, 3, 322–334 CrossRef CAS PubMed.
- M. Pope and C. Swenberg, Electronic Processes in Organic Crystals and Polymers, Clarendon Press, Oxford, 1982 Search PubMed.
- M. Kasha, Discuss. Faraday Soc., 1950, 9, 14–19 RSC.
- Z. Han, X.-Y. Dong and S.-Q. Zang, Adv. Opt. Mater., 2021, 2100081 CrossRef CAS.
- P. Du and R. Eisenberg, Chem. Sci., 2010, 1, 502–506 RSC.
- S. Carusotto, et al. , Phys. Rev., 1967, 157, 1207 CrossRef CAS.
- S. Baluschev, T. Miteva, V. Yakutkin, G. Nelles, A. Yasuda and G. Wegner, Phys. Rev. Lett., 2006, 97(14), 143903 CrossRef CAS PubMed.
- R. R. Islangulov, J. Lott, C. Weder and F. N. Castellano, J. Am. Chem. Soc., 2007, 129, 12652 CrossRef CAS PubMed.
- S. Baluschev, V. Yakutkin, T. Miteva, Y. Avlasevich, S. Chernov, S. Aleshchenkov, G. Nelles, A. Cheprakov, A. Yasuda, K. Mullen and G. Wegner, Angew. Chem., Int. Ed., 2007, 46, 7693 CrossRef CAS PubMed.
- S. Hoseinkhani, R. Tubino, F. Meinardi and A. Monguzzi, Phys. Chem. Chem. Phys., 2015, 17, 4020 RSC.
- Karin Zojer, Adv. Opt. Mater., 2021, 9, 2100219 CrossRef CAS.
- C. Schweitzer and R. Schmidt, Chem. Rev., 2003, 103, 1685 CrossRef CAS PubMed.
- P. Swiderek, M. Michaud and L. Sanche, J. Chem. Phys., 1996, 105(16), 6724–6732 CrossRef CAS.
- S. Baluschev, Protective Strategies Toward Long-Term Operation of Annihilation Photon Energy Upconversion, in Emerging Strategies to Reduce Transmission and Thermalization Losses in Solar Cells, ed. J. S. Lissau and M. Madsen, Springer Nature Switzerland AG, 2022, ISBN 978-3-030-70357-8 Search PubMed.
- P. R. Ogilby, Chem. Soc. Rev., 2010, 39, 3181 RSC.
- D. B. Papkovsky and R. I. Dmitriev, Chem. Soc. Rev., 2013, 42, 8700 RSC.
- J. Zhou, Q. Liu, W. Feng, Y. Sun and F. Li, Chem. Rev., 2015, 115, 395 CrossRef CAS PubMed.
- R. Schmidt, W. Drews and H. D. Brauer, J. Phys. Chem., 1982, 86, 4909 CrossRef CAS.
- B. D. Rihterty, M. E. Kenney, W. E. Ford and M. A. J. Rodgers, J. Am. Chem. Soc., 1993, 115, 8146 CrossRef.
- T. Christ, F. Kulzer, P. Bordat and T. Basche, Angew. Chem., Int. Ed., 2001, 40, 4192 CrossRef CAS PubMed.
- K. Naito, T. Tachikawa, S.-C. Cui, A. Sugimoto, M. Fujitsuka and T. Majima, J. Am. Chem. Soc., 2006, 128, 16430 CrossRef CAS PubMed.
- W. Fudickar and T. Linker, J. Am. Chem. Soc., 2012, 134, 15071 CrossRef CAS PubMed.
- G. Mehes, H. Nomura, Q. Zhang, T. Nakagawa and C. Adachi, Angew. Chem., Int. Ed., 2012, 51, 11311–11315 CrossRef CAS PubMed.
- H. Uoyama, K. Goushi, K. Shizu, H. Nomura and C. Adachi, Nature, 2012, 234, 492 Search PubMed.
- T. Palmeira and M. N. Berberan-Santos, TADF kinetics and data analysis in photoluminescence and in electroluminescence, in Highly Efficient OLEDs, Wiley-VCH Verlag GmbH & Co. KGaA, 2018, pp. 229–255 Search PubMed.
- F. B. Dias, J. Santos, D. R. Graves, P. Data, R. S. Nobuyasu and M. A. Fox, Adv. Sci., 2016, 3, 1600080 CrossRef PubMed.
- A. Endo, M. Ogasawara, A. Takahashi, D. Yokoyama, Y. Kato and C. Adachi, Adv. Mater., 2009, 21, 4802–4806 CrossRef CAS PubMed.
- X. Yin, Y. He, X. Wang, Z. Wu, E. Pang, J. Xu and J. Wang, Front. Chem., 2020, 8, 725 CrossRef CAS PubMed.
- M. K. Etherington, Front. Chem., 2020, 8, 716 CrossRef CAS PubMed.
- D. Barman, R. Gogoi, K. Narang and P. K. Iyer, Front. Chem., 2020, 8, 483 CrossRef CAS PubMed.
- S. Balouchev, T. Miteva, J. Lupton, G. Nelles and A. Yasuda, Worldwide Patent: “Method of determining the temperature in a system”, EP391708B1/21476.12.2007, US Pat. 7517144B2/14.04.2009, 2009.
- T. Singh-Rachford, J. Lott, C. Weder and F. Castellano, J. Am. Chem. Soc., 2009, 131, 12007–12014 CrossRef CAS PubMed.
- N. Nazarova, Y. Avlasevich, K. Landfester and S. Baluschev, ChemPhotoChem, 2019, 3, 1020–1026 CrossRef CAS.
- D. L. Dexter, J. Chem. Phys., 1953, 21, 836–850 CrossRef CAS.
- E. Heinrich, Y. Avlasevich, K. Landfester and S. Baluschev, ACS Omega, 2021, 6, 18860–18867 CrossRef CAS PubMed.
- S. Balouchev, G. Fuhrmann, T. Miteva, G. Nelles and V. Yakutkin, Patent Number(s): US Pat. 8400707-B2, EP2067838-B1, CN101939400-B, JP5491408-B2, Derwent Primary Accession Number: 2009-K12163, 2009.
- G. F. Moore, Nature, 1966, 211, 1170–1171 CrossRef CAS.
- D. H. McMahon and M. Kestigian, J. Chem. Phys., 1967, 46, 137 CrossRef CAS.
- P. Robin Butler and Michael J. Pilling, J. Chem. Soc., Faraday Trans. 2, 1977, 73, 886–894 RSC.
- B. Nickel, P. Borowicz, A. A. Ruth and J. Troe, Phys. Chem. Chem. Phys., 2004, 6, 3350–3363 RSC.
- T. N. Singh-Rachford, J. Lott, C. Weder and F. N. Castellano, J. Am. Chem. Soc., 2009, 131, 12007–12014 CrossRef CAS PubMed.
- Y. Murakami, H. Kikuchi and A. Kawai, J. Phys. Chem. B, 2013, 117, 5180–5187 CrossRef CAS PubMed.
- D. C. Thevenaz, A. Monguzzi, D. Vanhecke, R. Vadrucci, F. Meinardi, Y. C. Simon and C. Weder, Mater. Horiz., 2016, 3, 602–607 RSC.
- G. Massaro, J. Hernando, D. Ruiz-Molina, C. Roscini and L. Latterini, Chem. Mater., 2016, 28, 738–745 CrossRef CAS.
- C. Ye, J. Ma, S. Chen, J. Ge, W. Yang, Q. Zheng, X. Wang, Z. Liang and Y. Zhou, J. Phys. Chem. C, 2017, 121, 20158–20164 CrossRef CAS.
- N. Yanai and N. Kimizuka, Angew. Chem., Int. Ed., 2020, 59, 10252–10264 CrossRef CAS PubMed.
- K. Landfester, Y. Avlasevich, D. Busko, F. Wurm and S. Balouchev, WO/2016/150677/A1/EP3072942-A1/WO2016150677-A1/EP3274420-A1/US2018106785-A1/EP3274420-B1, ES2713055-T3, 2016.
- X. Wang and O. S. Wolfbeis, Chem. Soc. Rev., 2014, 43, 3666–3761 RSC.
- D. B. Papkovsky and R. I. Dmitriev, Chem. Soc. Rev., 2013, 42, 8700 RSC.
- S. Baluschev, K. Kata, Y. Avlasevich and K. Landfester, Mater. Horiz., 2016, 3, 478–486 RSC.
- S. H. C. Askes and S. Bonnet, Nat. Rev. Chem., 2018, 2, 437–452 CrossRef.
- M. Penconi, P. L. Gentili, G. Massaro, F. Elisei and F. Ortica, Photochem. Photobiol. Sci., 2014, 13, 48–61 CrossRef CAS PubMed.
- B. Iyisan, R. Thiramanas, N. Nazarova, Y. Avlasevich, V. Mailänder, S. Baluschev and K. Landfester, Biomacromolecules, 2020, 21, 4469–4478 CrossRef CAS PubMed.
- H.-L. Lee, J. H. Park, H.-S. Choe, M.-S. Lee, J.-M. Park, N. Harada, Y. Sasaki, N. Yanai, N. Kimizuka, J. Zhu, S. H. Bhang and J.-H. Kim, ACS Appl. Mater. Interfaces, 2019, 11, 26571–26580 CrossRef CAS PubMed.
- A. M. Oddo, T. Mani and C. V. Kumar, ACS Appl. Mater. Interfaces, 2020, 12, 39293–39303 CrossRef CAS PubMed.
- L. Huang, T. Le, K. Huang and G. Han, Nat. Commun., 2021, 12, 1898 CrossRef PubMed.
- M. Xu, X. Zou, Q. Su, W. Yuan, C. Cao, Q. Wang, X. Zhu, W. Feng and F. Li, Nat. Commun., 2018, 9, 2698 CrossRef PubMed.
- J. A. Spencer, F. Ferraro, E. Roussakis, A. Klein, J. Wu, J. M. Runnels, W. Zaher, L. J. Mortensen, C. Alt, R. I. Turcotte, R. Yusuf, D. Cote, S. A. Vinogradov, D. T. Scadden and C. P. Lin, Nature, 2014, 508, 269–273 CrossRef CAS PubMed.
- R. B. Bird, W. E. Stewart and E. N. Lightfoot, Transport Phenomena, John Wiley & Sons, NY, 1960, p. 780 Search PubMed.
- J. Lee, C. Jeong, T. Batagoda, C. Coburn, M. E. Thompson and S. R. Forrest, Nat. Commun., 2017, 8, 15566 CrossRef CAS PubMed.
- J. U. Kim, I. S. Park, C.-Y. Chan, M. Tanaka, Y. Tsuchiya, H. Nakanotani and C. Adachi, Nat. Commun., 2020, 11, 1765 CrossRef CAS PubMed.
- L. S. Cui, A. J. Gillett and S. F. Zhang, et al. , Nat. Photonics, 2020, 14, 636–642 CrossRef CAS.
| This journal is © The Royal Society of Chemistry 2022 |

