Stereodynamics effects in grazing-incidence fast-molecule diffraction
M.
del Cueto
 a,
A. S.
Muzas
b,
F.
Martín
 cde and
C.
Díaz
 *f
*f
aDepartment of Chemistry, University of Liverpool, Liverpool, L69 3BK, UK
bCentro de Física de Materiales CFM/MPC (CSIC-UPV/EHU), 20018 Donotia-San Sebastián, Spain
cDepartamento de Química Módulo 13, Universidad Autónoma de Madrid, 28049 Madrid, Spain
dCondensed Matter Physics Center (IFIMAC), Universidad Autónoma de Madrid, 28049 Madrid, Spain
eInstituto Madrileño de Estudios Avanzado en Nanociencia (IMDEA-Nanociencia), Cantoblanco 28049, Madrid, Spain
fDepartamento de Química Física, Facultad de CC. Químicas, Universidad Complutense de Madrid, 28040 Madrid, Spain. E-mail: cdiaz08@ucm.es
First published on 3rd August 2022
Abstract
Grazing-incidence fast-projectile diffraction has been proposed both as a complement and an alternative to thermal-energy projectile scattering, which explains the interest that this technique has received in recent years, especially in the case of atomic projectiles. On the other hand, despite the richer physics involved, molecular projectiles have received much less attention. In this work, we present a theoretical study of grazing-incidence fast-molecule diffraction of H2 from KCl(001) using a six-dimensional density functional theory based potential energy surface and a time-dependent wavepacket propagation method. The analysis of the computed diffraction patterns as a function of the molecular alignment, and their comparison with the available experimental data, where the initial distribution of rotational states in the molecule is not known, reveals a puzzling stereodynamics effect of the diffracted projectiles: diffracted molecules aligned perpendicular, or quasi perpendicular, to the surface reproduce rather well the experimental diffraction pattern, whereas those molecules aligned parallel to or tilted with respect to the surface do not behave as in the experiments. These results call for more detailed investigations of the molecular beam generation process.
1 Introduction
Grazing-incidence fast-atom (GIFAD) and fast-molecule (GIFMD) diffraction, measured experimentally for the first time in 2007,1,2 can be considered as a good alternative to thermal-energy atom (TEAS) and molecule scattering (TEMS), proposed and widely developed between the 70's and 90's (see ref. 3–6 and references therein). The physical mechanism behind GIFAD and GIFMD, already described in pioneering theoretical works,7–9 is the effective strong decoupling between the fast motion parallel to the surface, which does not induce diffraction, and the slow motion perpendicular to it, responsible for the observed diffraction peaks. As already discussed in ref. 7 and 10, under GIFAD conditions the projectile feels a periodic potential along the incidence direction (the x axis in our case) because the potential barely varies over the interval δz = d![[thin space (1/6-em)]](https://www.rsc.org/images/entities/char_2009.gif) tan
tan![[thin space (1/6-em)]](https://www.rsc.org/images/entities/char_2009.gif) Ω, d being the lattice parameter along the incidence direction and Ω the grazing angle. Consequently, the projectile feels a periodic potential as long as d ≪ E[tan
Ω, d being the lattice parameter along the incidence direction and Ω the grazing angle. Consequently, the projectile feels a periodic potential as long as d ≪ E[tan![[thin space (1/6-em)]](https://www.rsc.org/images/entities/char_2009.gif) Ω(∂V/∂z)−1]. A periodic potential will result in a parallel momentum change ΔK‖x = 0, because
Ω(∂V/∂z)−1]. A periodic potential will result in a parallel momentum change ΔK‖x = 0, because  . Therefore, the only diffraction peaks observed under GIFAD and GIFMD conditions are the ones perpendicular to the incidence direction. Thus, in GIFAD, the incidence energy inducing diffraction can be easily varied by changing the total energy (further accelerating the molecular beams) and/or changing the incidence angle -theoretically it has been shown that, if phonons are neglected, GIFAD conditions are preserved up to 10°,11–13 although experimentally the maximum angle has been limited to approximately 2° so far. At this point, it is also important to remark that even if the decoupling between the parallel and the perpendicular motions was not fully met, GIFAD measurements could still be performed.14 Thus, GIFAD allows one to record diffraction for a much wider energy range than in TEAS, i.e., to access regions of the potential energy surfaces (PESs) unreachable to TEAS.15 Furthermore, quantum decoherence effects, mainly due electronic excitations,16 are not a more important problem than in TEAS,17 although phonons may also have some influence in diffraction patterns.18,19
GIFAD has been widely used since 2007 (see ref. 15 and 20 and references therein). Using this technique, it has been possible to analyze from relative simple surfaces such as clean insulators,1,2,21–26 semiconductors,27–33 and metal surfaces,34,35 to more complex systems such as superstructures absorbed on a metal substrate,36,37 reconstructed oxide surfaces,14,38 graphene grown on 6H-SiC(0001),39 a monolayer of silica adsorbed on Mo,40,41 or organic monolayers adsorbed on metal surfaces.42,43 GIFAD has also shown its ability to follow phase transitions in real time at an organic–inorganic interface.44 This vast experimental effort has been accompanied by the subsequent development and implementation of theoretical tools, allowing for a more precise interpretation of the experimental measurements. All these tools are based on the Born–Oppenheimer approximation (BOA), where the PESs can be computed using pairwise-like analytical functions18,19,30,39,45–48 or density functional theory (DFT).21,25,26,33,49–55 PESs computed at multiconfiguration self-consistent field level, considering a cluster model, have also been used.1,17 To perform the dynamics calculations, several approaches have been adopted, from classical49,51,52 to quantum1,12,17,26,30,47,55 methods, as well as semi-classical28,36,41,56 and semi-quantum18,21,25,50,53,57–59 methods.
GIFMD, on the other hand, has received much less attention, despite the fact that, as in the case of TEAS,60,61 the H2 molecule: (i) is as easy to generate as atomic H (a widely used projectile in GIFAD experiments); (ii) is lighter than He (another widely used projectile in GIFAD), which would further reduce surface–phonons inelastic processes; and (iii) can reveal aspects of the surface landscape that may be relevant in other contexts due to the internal degrees of freedom (DOFs) and, in the case of the ionic surfaces, to the interaction of its quadrupole moment with the electric field created by the ionic crystal, which is very sensitive to the surface details. Experimentally, GIFMD measurements have been performed, for example, for LiF(001),2,62 silica/Mo(112),41 and alanine/Cu(110),43 but the subsequent analysis has been much less thorough than in the case of GIFAD.
The first GIFMD theoretical studies already pointed out interesting potentialities of this technique. For example in ref. 10 and 63, it was shown that 1 − reflectivity probabilities resulting from GIFMD, for several H2/metal surface systems, were surprisingly similar to dissociative adsorption probabilities obtained in TEAS, which implies that GIFMD could be used to estimate dissociative adsorption probabilities at thermal and quasi-thermal energies, provided that the dissociative adsorption probability is approximately equal to 1 minus the reflectivity. Thus, GIFMD would make the dissociative adsorption saturation limit experimentally accessible. Here, it is worth noticing that the atoms generated upon molecular dissociation in GIFAD do not get adsorbed on the surface due to their large parallel energy, but they are scattered. Thus experimentally by measuring the atomic reflectivity probabilities one could infer the dissociative adsorption probabilities. Focusing on diffracted molecules, our previous studies for H2/LiF(001)64,65 have revealed a strong dependence of the diffraction patterns, and diffractograms, on both the initial rotational state of the molecules (J and MJ) and the crystallographic incidence direction. A similar dependence has also been found for normal incidence at low impact energy.66 On the other hand, the initial vibrational state of the molecule was shown to play a negligible role, as well as, rotationally inelastic processes. These findings have been rationalized in terms of the interaction between the quadrupole moment of the molecule and the electric field associated with the ionic crystal, which differs from one crystallographic direction to another.65 To verify that the conclusions drawn for H2/LiF(001) are valid for other surfaces with a marked ionic character, in this work, we have studied GIFMD for H2/KCl(001) focusing on the role played by the initial rotational state (J, MJ) of the molecule. The comparison between our simulated diffraction patterns and the experimental ones available in the literature67 reveals a puzzling stereodynamics effect. Diffracted molecules aligned perpendicular (or quasi perpendicular) to the surface reproduce fairly well the experimental pattern, whereas molecules with other alignments do not.
2 Methodology
Our theoretical study is based on two main pillars:(1) The inclusion of the six nuclear degrees of freedom of the molecules, freezing the surface ones.
(2) The validity of the BOA, which allows us to divide our calculations in two steps:
(a) Electronic structure calculations based on DFT.
(b) Six-dimensional quantum dynamics simulations.
2.1 Potential energy surface
To build the required continuous six-dimensional (6D) PES, we have applied a modified version of the corrugation reducing procedure (CRP)68 to a set of energies computed at DFT theory level for 4116 differents configurations of H2 over KCl(001). The main idea behind the CRP is that the 6D-PES can be divided in a 6D smooth function, which is relatively easy to interpolate with high accuracy, and a corrugated function that represents most of the corrugation coming from the atom-surface corrugation. In this way, by removing the corrugated function from the full 6D PES, one can accurately interpolate the remaining 6D smooth function, and then add back the corrugated function to obtain the whole PES. Using the modified-CRP version described in detail in ref. 65, the 6D PES is written as:| V6D(R) = I6D(R) + V3D(r1)Lz0,δz(r1) + V3D(r2)Lz0,δz(r2), | (1) |
 | (2) |
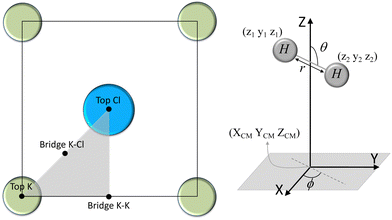
We have taken the H/KCl(001) 3D-PES from ref. 55 as a basis for our corrugated function (see eqn (1)). But one may also use any other mathematical function whose subtraction from the 6D PES leads to a smooth function easy to interpolate. The 4116 6D-DFT single point energies, grouped in 21 (XCM, YCM, θ, ϕ) molecular configurations (see Fig. 1 and Table 1), have been computed using the plane-wave based code VASP.69–71 In performing DFT calculations, we have relied on the generalized gradient approximation (GGA) through the PBE functional.72 The cutoff energy for the plane wave expansion was set to 550 eV, the projector augmented wave (PAW) method73,74 has been used to take into account the interaction of the core electrons with nuclei, and a 3 × 3 × 1 k-points grid was used to sample the Brillouin zone. To describe the molecule/surface system with periodic boundary conditions, we have used a 5-layer slab and a 2 × 2 surface unit cell. To avoid interactions of the projectile with its periodic images and with the top periodic image of the surface, we have placed a vacuum layer of 20 Å between the slabs in the Z direction (see ref. 55 for further details).
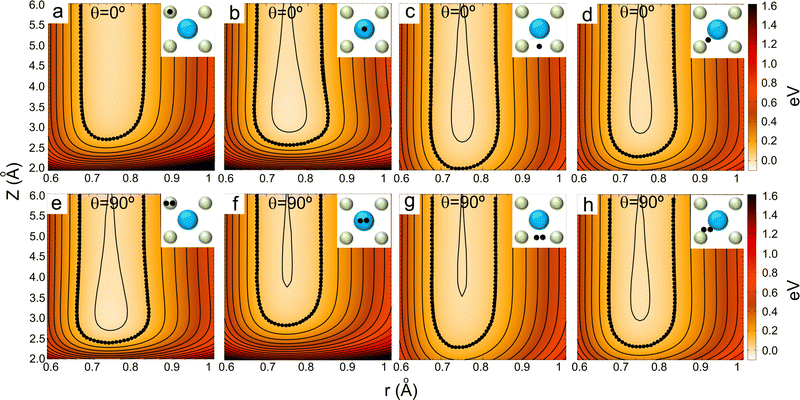
Fig. 2 displays several 2D cuts of the computed 6D PES. One can see that the characteristics of the PES are consistent with the nature of the interaction between H2 and an ionic surface. Thus, the cartwheel configuration is energetically more stable than the helicopter one over Cl− top, because the negative charge located on the Cl− ions interacts favorably with the excess of positive charge located in the hydrogen atoms, whereas the opposite occurs over K+ top, because the positive charge located on the K ions interacts more favorably with the excess of negative charge located in the H–H bond. We also observe that K+ top exhibits the largest anisotropy, i.e., the highest variation of energy with respect to molecular alignment, whereas the smaller anisotropy corresponds to K–Cl bridge. As expected, these findings are, generally speaking, similar to those observed for H2/LiF(001).65,66,75,76
2.2 Time-dependent wave packet propagation (TDWP) method
Once we have a good representation of the PES, we solve the time-dependent Schrödinger equation, | (3) |
 | (4) |
To solve eqn (3), we have used a TDWP method77 as implemented in ref. 78. In this implementation, widely used to study molecule–surface interactions at thermal and quasi-thermal energies,79–81 the wave packet is propagated according to eqn (3) using the split-operator method.82 A direct-product discrete-variable representation (DVR), with constant grid spacing, is used to represent the dependence of the wave function on XCM, YCM, ZCM, and r.83 To represent the dependence on θ and ϕ, we used a nondirect-product finite-basis representation (FBR) of spherical harmonics. Gauss-associated-Legendre and Fourier transforms are employed to transform the wave function from FBR to DVR, and vice versa.84 The initial wave function is written as:
| Initial wave packet | |
| Initial position, Z0 | 20 |
| Width, ΔZ0 | 0.23–0.64 |
| Grid parameters | |
| Z minimum value | 1.5 |
| Grid points, NZ | 224 |
| Specular grid points, NspZ | 480 |
| Grid spacing, ΔZ | 0.10 |
| r minimum value | 0.6 |
| Grid points, Nr | 40 |
| Grid spacing, Δr | 0.15 |
| Grid points, NX, NY | 24, 24 |
| Maximum J in rotational basis | 14–15 |
| Time propagation | |
| Time step, Δt | 2 |
| Total propagation in Z(r) | 15![[thin space (1/6-em)]](https://www.rsc.org/images/entities/char_2009.gif) 000–65 000–65![[thin space (1/6-em)]](https://www.rsc.org/images/entities/char_2009.gif) 000 000 |
| CAP in Z(Zsp) | |
| Initial value, Zmin (Zspmin) | 13.50 (26.50) |
| CAP length | 10.30 (22.90) |
| CAP in r | |
| Initial value, rmin | 3.60 |
| CAP length | 2.85 |
| Other parameters | |
| Analysis values, Z∞ | 13.50 |
Note that, as a result of this analysis, the obtained diffraction peaks are delta functions. Thus, to take into account the experimental resolution, our theoretical results have been convoluted using a 2D Gaussian function with typical values of the widths σΘ = 0.4 deg. and σλ⊥ = 0.01 Å. At this point, it should be noticed that although the experimental diffraction chart corresponds to a collection of data recorded on the Laue circle, at different normal energies (different perpendicular wavelengths), phonons and electronic excitations inelastic processes, as well as beam collimating conditions may induce a spread of the recorded data. None of these effects are considered in our calculations. It is also important to clarify that when comparing with experimental measurements, we are just comparing rotationally elastic results. Relative to the theory–experiment comparison, it is also worth mentioning that our simulations reveal that: (i) as in the case of H2/LiF(001),64 rotational excitation upon molecular scattering is a minority process, totally negligible for excitation into J = 9 (see Appendix); (ii) the only populated diffraction peaks (elastic and inelastic) are those perpendicular to the incidence direction, in the reciprocal space, as one would expect if the decoupling between the normal and the parallel motions is fulfilled.
3 Results and discussion
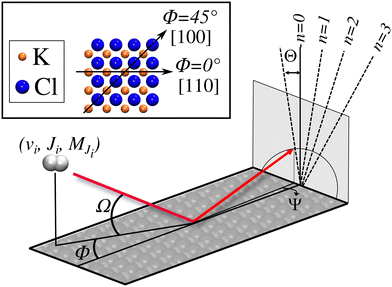
We have carried out dynamics calculations for a wide range of initial energies aiming to match the range considered in the experiments.67 For that purpose, we have run up to 11 dynamic calculations for each set (v, J, MJ) defining the initial internal state of the molecule. All these calculations comprise normal energy values, E⊥, between 50–600 meV. The corresponding parallel energy, E‖, is chosen so that the incidence angle with respect to the surface is kept constant at Ω = 2°, i.e., . Although we are using a grazing angle larger than the one used in the experiments (Ωexp = 0.7° – see ref. 64), this is not relevant here because our results reveal that for H2 GIFMD from KCl(001) only E⊥ matters. At this point, it worth noting that in our simulations we are not imposing any decoupling between fast parallel and slow normal motions. This decoupling, which the reason why only diffraction peaks perpendicular to the incidence direction are observed, comes out naturally from our full dimensional calculations. Thus, we can make (λ⊥, Θ) plots for each set of values (v, J, MJ). Here,
  , m being the mass of the molecule, h the Planck constant, and Θ the deflection angle, defined as the angle between the components parallel and perpendicular of the molecule wave vector. Θ is related to the diffraction order, n, by the expression: d
![[thin space (1/6-em)]](https://www.rsc.org/images/entities/char_2009.gif) sin
sin![[thin space (1/6-em)]](https://www.rsc.org/images/entities/char_2009.gif) Θ = nλ⊥, where d is the channel periodicity in incidence direction. A schematic representation of the diffraction process is shown in Fig. 3. From this figure we can see that tan
Θ = nλ⊥, where d is the channel periodicity in incidence direction. A schematic representation of the diffraction process is shown in Fig. 3. From this figure we can see that tan![[thin space (1/6-em)]](https://www.rsc.org/images/entities/char_2009.gif) Θ = tan
Θ = tan![[thin space (1/6-em)]](https://www.rsc.org/images/entities/char_2009.gif) Ψ/tan
Ψ/tan![[thin space (1/6-em)]](https://www.rsc.org/images/entities/char_2009.gif) Ω.
Ω.
Due to the computational effort required to perform this GIFMD simulations, we have only performed calculations along the [100] direction (Φ = 45°), because, in this case, the experimentally measured diffraction chart shows a characteristic structure with peaks that appear and vanish as a function of the perpendicular energy (perpendicular λ),67 thus facilitating, in the absence of experimental measured diffractograms, a detailed comparison with theoretical results. This is not the case for other directions considered in existing experiments, where all possible diffraction peaks are presented in the charts, and no modulation is observed. Note that the lack of available experimental diffractograms prevents us from a detailed comparison based on relative intensities. It is also important to point out here that, to carry out a direct comparison with experimental diffraction patterns, one should know the rovibrational distribution in the molecular beam. However, contrary to TEMS experiments,86–89 determining such rovibrational distributions is a real challenge in GIFMD experiments and, in fact, it has not been achieved yet. Therefore, any comparison with existing experiments can only be done at a qualitative level. Fig. 4 shows the simulated diffraction patterns (λ⊥, Θ) for (v = 0, J = 0) and (v = 1, J = 0). As can be seen, the diffraction patterns barely depend on the initial v value, so that one can neglect the vibrational DOF in our ensuing analysis. Nevertheless a closer look at the diffraction patterns reveals that vibrationally excited molecules lead in general to slightly larger intensities for lower diffraction orders than molecules in the vibrational ground state. A similar phenomenon was observed for H2/LiF(001).64,65
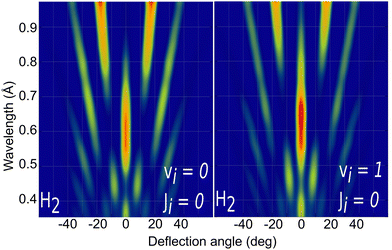 | ||
| Fig. 4 Simulated H2/KCl(001) GIFMD patterns along the crystallographic direction [100] for the initial rovibrational state: left panel (v = 0, J = 0); right panel (v = 1, J = 0). | ||
The role of the molecule rotational DOFs is more complex. In Fig. 5, we compare the experimental diffraction spectra available in the literature67 with our simulated ones for several initial rotational states, J, of the molecule. To obtain these results, we have computed diffraction probabilities for all allowed MJ values and subsequently obtained the MJ-averaged results. Fig. 5 shows that the simulated diffraction spectrum for J = 0 resembles the experimental one, whereas the simulated spectra for J > 0 are rather different. One may argue that this result suggests that the molecules in the experimental beam are mainly in their rotational ground state, i.e., they have an extremely low rotational temperature. However, in view of the beam generation technique used in experiment,15,20 neutralization of fast H2+ molecular ions by alkali atoms, which is likely to produce hot H2 molecules, this seems to be unlikely.
 | ||
| Fig. 5 H2/KCl(001) GIFMD patterns along the crystallographic direction [100]. (a) experimental pattern (data taken from ref. 67); (b), (c), (d), and (e) simulated pattern for J = 0, J = 1, J = 2, and J = 9, respectively. | ||
To further analyze the role of the molecular rotation in GIFMD, we have simulated the diffraction spectra (λ⊥, Θ) as a function of J and MJ (see Fig. 6). Fig. 6 shows that our simulated diffraction patterns reproduce rather well the experimental ones, for molecules in a cartwheel or quasi-cartwheel configuration, i.e., with MJ close to 0, whereas molecules with MJ close to J (helicopter) show diffraction patterns clearly different from the experimental ones. At this point, it should be noticed that the high order diffraction peaks present in the diffraction charts are a consequence of the strong corrugation felt by both helicopter and cartwheel molecules. This strong corrugation is the result of the local interaction between the H atoms (slightly positively charged) and the molecular bond (slightly negatively charged) with the surface anions and cations (see Fig. 7). On the other hand, as we discuss below, the substantial differences found in diffraction charts for MJ = 0 and MJ = 1 are due to the dissimilar corrugation features felt by the molecule aligned parallel and perpendicular to the surface. In summary, the results shown in Fig. 6 confirm the main role that molecular alignment may play in GIFMD as already suggested in ref. 67.
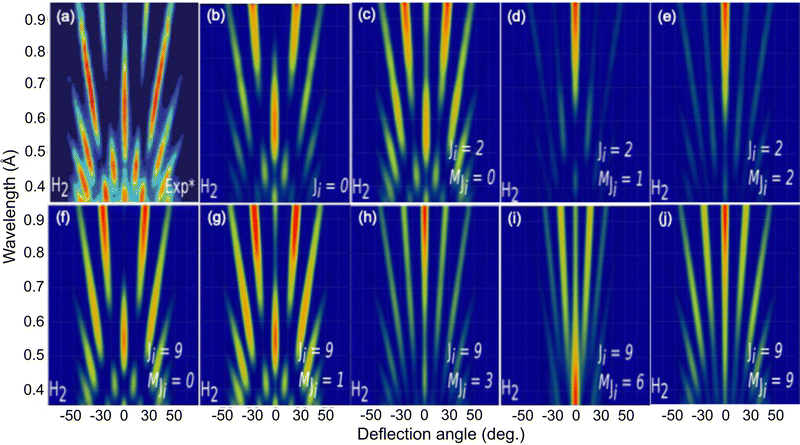 | ||
| Fig. 6 H2/KCl(001) GIFMD patterns along the crystallographic direction [100]. (a) Experimental pattern (data taken from ref. 67); (b), (c), (d), (e), (f), (g), (h), (i) and (j) simulated pattern for (J = 0, MJ = 0), (J = 2), MJ = 0), (J = 2, MJ = 1), (J = 2, MJ = 2, (J = 9, MJ = 0), (J = 9, MJ = 1), (J = 9, MJ = 3), (J = 9, MJ = 6) and (J = 9, MJ = 9), respectively. | ||
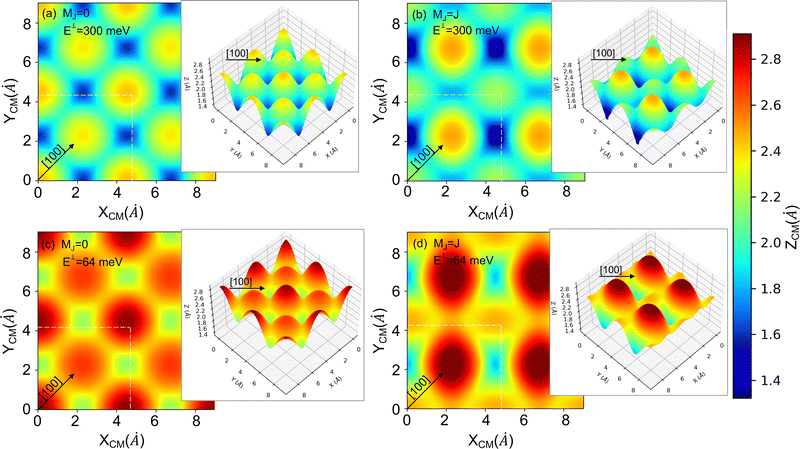 | ||
| Fig. 7 2D and 3D (insets) representations of the classical turning points (Z (Å)) for cartwheel (MJ = 0) and helicopter (MJ = J) molecules for two perpendicular kinetic energies (E⊥). The squares delimited by white dashed lines represent the KCl(001) unit cell – see Fig. 1. Note that E⊥ = 64 and 300 meV correspond to λ⊥ = 0.8 and 0.37 Å, respectively. | ||
To understand the stereodynamics effect revealed in Fig. 6, we have analyzed the surface corrugation felt by cartwheel and helicopter molecules at their theoretical classical turning points distribution throughout the KCl(001) unit cell in the limit of a sudden collision with fixed molecule alignment and normal energy scaling. The 2D and 3D representations of the classical turning points, shown in Fig. 7, give us a measure of the corrugation felt by the molecule as a function of its alignment. One can see that cartwheel and helicopter molecules feel a quite different corrugation. Cartwheel (MJ = 0) molecules see little differences between K+ and Cl− top sites, i.e., the classical turning points over these sites are quite similar, so that the corrugation observed is the result of a double periodicity (two types of diffracted trajectories). In contrast, for helicopter molecules the classical turning point over the K+ top site is much higher than over the Cl− top site, so that the observed corrugation is the result of a single periodicity (one type of diffracted trajectories). Using corrugation arguments, we can qualitatively interpret the results shown in Fig. 6 in terms of supernumerary rainbows, which appear as modulations in the relative intensity of the Bragg peaks (see Fig. 2–11 of ref. 20). The interference between trajectories sharing the same phase A and A′ produces diffraction patterns with all diffraction Bragg peaks present, whereas the interference between trajectories with different phases, A and B, but same deflection angle produces quantum supernumerary rainbows. The convolution of supernumerary rainbows and Bragg peaks patterns produces the modulation of the intensity of the Bragg peaks. The resulting modulation is closely related to the corrugation felt by the projectile and may lead to the disappearance of some diffraction peaks, as shown in Fig. 6 for cartwheel molecules. We can also rationalize the results shown in Fig. 6 in terms of the geometrical structure factor (Sg), which explains the modulation of the intensity of the diffraction peaks due to the presence of two more types of atoms in a crystal.90 In the case of KCl,
| Sg = fK(G)eiGdK + fCleiGdCl, | (5) |
One important question at this point is where this apparent stereodynamics selectivity comes from. Several phenomena could be behind this effect:
• The H2 generation mechanism15,20 might impose the creation of molecules in a cartwheel configuration as a results of selection rules governing the formation of H2+. Confirming or rejecting this hypothesis would require detailed experimental and theoretical studies of the neutralization reaction, which so far has not been sufficiently investigated.
• Beyond Debye–Waller effects, which alone are not able to reconcile theoretical results obtained at T = 0 K with experimental TEMS results at T > 0 K (see ref. 91), one could speculate that the coupling between the vibrational modes along the [100] crystallographic direction (where K and Cl atoms alternate) and the rotational motion of the molecule may induce a change in the molecule alignment preferentially toward the cartwheel configuration, which cannot be described within the frozen surface approximation. To assess this speculation further experimental and theoretical analysis would be required. From the theoretical point of view, to include the effect of phonons in the dynamics is not an easy task. In the case of H2 scattering at low energy, seven-dimensional quantum dynamics, including the perpendicular motion of the subsurface layer atoms, and the phonon sudden approximation have been tested to describe vibrational excitation and state-to-state scattering probabilities of H2 interacting with a metal surface.92 However, the performance of these approaches to deal with insulating surfaces and diffraction phenomena is still unclear. In the case of fast grazing incidence, phonons have been included in the dynamics to study GIFAD from insulating surfaces using a semiquantum phonon-surface initial value representation.18,19 Results for He and Ne GIFAD from LiF(001) reveal that thermal lattice vibrations can affect the relative intensity in the diffraction pattern and even the interference maxima. However, at this point it should be reminded, on the one hand, that H2 is lighter than He and Ne atoms and, on the other hand, that 6D quantum dynamics simulations, based on the surface frozen approximation, were able to describe fairly well diffraction patterns of H2 GIFMD from LiF(001) in comparison with experiment. In summary, further theoretical and experimental studies are required to elucidate the role of phonons on H2 GIFMD from KCl(001).
Finally, one might suggest that shortcomings of the DFT functional used to built the 6D-PES used in this study could also be blamed for the disagreement between theory and experiment. One may wonder if the GGA-PBE functional could yield better results for cartwheel than for helicopter aligned molecules, but such an effect has never been observed for molecule–surface interactions at low energy, where the effect of DFT-functional on the dynamics has been widely investigated (see ref. 93 and reference therein). Same argument may hold for van der Waals (vdW) effects. The inclusion of vdW effects in GIFAD has been shown to modify the relative intensity53 and even the position of the minima and maxima of interference in the diffraction patterns,30,53,55 which could explain the difference between the experimental diffraction pattern shown in Fig. 6(a) and our simulated patterns for cartwheel, and quasi-cartwheel, aligned molecules (see Fig. 6(b, c, f, and g)). However, vdW can hardly explain the disappearance of the structure in the diffraction patterns of helicopter or quasi-helicopter aligned molecules. It should also be remembered that similar DFT parameters were used to build the H2/LiF(001) PES used to accurately reproduce experimental diffraction pattern.64,65
4 Conclusion
We have studied diffraction of H2 from KCl(001) under fast grazing incidence as a function of the internal molecular degrees of freedom. The comparison between our results and the available experimental diffraction patterns reveals a striking stereodynamics effect. Diffracted molecules aligned perpendicular, or quasi perpendicular, to the surface reproduce rather well the experimental diffraction pattern, whereas those molecules aligned parallel or tilted to the surface fail completely in reproducing the experimental observations. This stereodynamics effect has not been observed previously in the few studies found in the literature dealing with molecular projectiles. The source of this phenomenon is not totally clear, although possible causes are the experimental molecular beam generation process and molecule–phonons interactions. To elucidate which of these sources, if any, is the main responsible for the observed behavior, further experimental and theoretical studies are required.We hope that the results presented here will further motivate the experimental groups working in the field to improve the current techniques of generation of molecular beams with the aim of controlling the rotational state (J, MJ) of the molecules, at the same level that is already achieved in TEAS.86–88
Conflicts of interest
There are no conflicts to declare.Appendix: rovibrational excitation
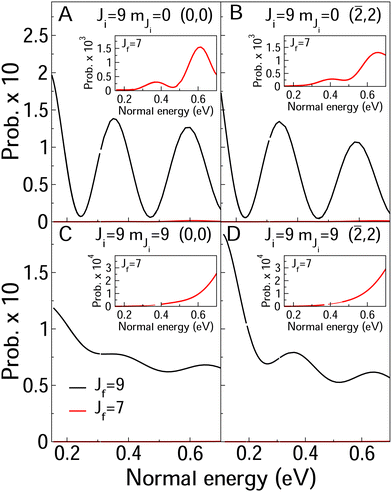
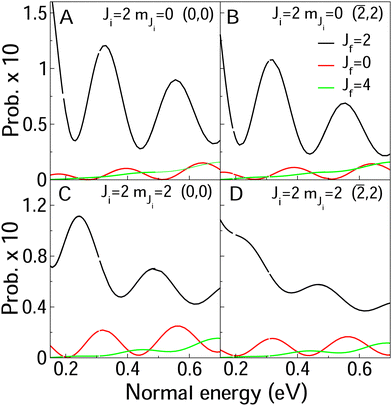
In Fig. 8 and 9, we compare rotationally elastic diffraction probabilities with the most populated rotational excited or deexcited diffraction channels for two diffraction peaks (0, 0) and (![[2 with combining macron]](https://www.rsc.org/images/entities/char_0032_0304.gif) , 2) and four initial rovibrational states of the molecule (v = 0, J = 2, mJ = 0, 2) (Fig. 9) and (v = 0, J = 9, mJ = 0, 9) (Fig. 8). From Fig. 8, we can see that for J = 2, rotationally inelastic probabilities are one order of magnitude smaller than the rotationally elastic peaks, except for the higher normal energies and lower elastic probabilities, where elastic and inelastic probabilities are of the same order of magnitude. At this point, it is worthy to remark that the presence in the beams of the molecules with low rotational states should be testimonial. On the other hand, for J = 9 (see Fig. 8) rotational deexcited probabilities J = 9 → J = 7 (the most populated rotationally inelastic channel) are between two and three orders of magnitude smaller than rotationally elastic peaks. These results are similar to those obtained for H2/LiF(001).64
, 2) and four initial rovibrational states of the molecule (v = 0, J = 2, mJ = 0, 2) (Fig. 9) and (v = 0, J = 9, mJ = 0, 9) (Fig. 8). From Fig. 8, we can see that for J = 2, rotationally inelastic probabilities are one order of magnitude smaller than the rotationally elastic peaks, except for the higher normal energies and lower elastic probabilities, where elastic and inelastic probabilities are of the same order of magnitude. At this point, it is worthy to remark that the presence in the beams of the molecules with low rotational states should be testimonial. On the other hand, for J = 9 (see Fig. 8) rotational deexcited probabilities J = 9 → J = 7 (the most populated rotationally inelastic channel) are between two and three orders of magnitude smaller than rotationally elastic peaks. These results are similar to those obtained for H2/LiF(001).64
Relative to rotational excitation is also worth pointing out that only rotationally inelastic diffraction peaks (RID's) perpendicular to the incidence direction are significantly populated. In the case of the crystallographic direction analyzed here, 〈100〉, only (![[n with combining macron]](https://www.rsc.org/images/entities/i_char_006e_0304.gif) , n) and (n,
, n) and (n, ![[n with combining macron]](https://www.rsc.org/images/entities/i_char_006e_0304.gif) ) RID's are populated. This can be observed from the data in Table 3, where we show raw elastic and inelastic diffraction probabilities obtained for the second order diffraction peaks, for a normal energy equal to 400 meV. Similar results are obtain for other diffraction orders.
) RID's are populated. This can be observed from the data in Table 3, where we show raw elastic and inelastic diffraction probabilities obtained for the second order diffraction peaks, for a normal energy equal to 400 meV. Similar results are obtain for other diffraction orders.
| (v = 0, J = 2, mJ = 0) → (v = 0, J = 2, mJ = 0) | (v = 0, J = 2, mJ = 0) → (v = 0, J = 0, mJ = 0) | (v = 0, J = 2, mJ = 0) → (v0, J = 4, mJ = 0) | |||
|---|---|---|---|---|---|
| Peak | Probability | Peak | Probability | Peak | Probability |
(![[2 with combining macron]](https://www.rsc.org/images/entities/char_0032_0304.gif) , 0) , 0) |
0.363220 × 10⁻¹⁰ | (![[2 with combining macron]](https://www.rsc.org/images/entities/char_0032_0304.gif) , 0) , 0) |
0.264077 × 10⁻¹⁰ | (![[2 with combining macron]](https://www.rsc.org/images/entities/char_0032_0304.gif) , 0) , 0) |
0.223183 × 10⁻¹⁰ |
(![[1 with combining macron]](https://www.rsc.org/images/entities/char_0031_0304.gif) , , ![[1 with combining macron]](https://www.rsc.org/images/entities/char_0031_0304.gif) ) ) |
0.171869 × 10⁻¹⁰ | (![[1 with combining macron]](https://www.rsc.org/images/entities/char_0031_0304.gif) , , ![[1 with combining macron]](https://www.rsc.org/images/entities/char_0031_0304.gif) ) ) |
0.161417 × 10⁻¹¹ | (![[1 with combining macron]](https://www.rsc.org/images/entities/char_0031_0304.gif) , , ![[1 with combining macron]](https://www.rsc.org/images/entities/char_0031_0304.gif) ) ) |
0.119949 × 10⁻¹⁰ |
(![[1 with combining macron]](https://www.rsc.org/images/entities/char_0031_0304.gif) , 1) , 1) |
0.548651 × 10−01 | (![[1 with combining macron]](https://www.rsc.org/images/entities/char_0031_0304.gif) , 1) , 1) |
0.488435 × 10−03 | (![[1 with combining macron]](https://www.rsc.org/images/entities/char_0031_0304.gif) , 1) , 1) |
0.215639 × 10−02 |
(0, ![[2 with combining macron]](https://www.rsc.org/images/entities/char_0032_0304.gif) ) ) |
0.294560 × 10⁻¹⁰ | (0, ![[2 with combining macron]](https://www.rsc.org/images/entities/char_0032_0304.gif) ) ) |
0.227826 × 10⁻¹⁰ | (0, ![[2 with combining macron]](https://www.rsc.org/images/entities/char_0032_0304.gif) ) ) |
0.216098 × 10⁻¹⁰ |
| (0, 2) | 0.000000 × 1000 | (0, 2) | 0.000000 × 10+00 | (0, 2) | 0.000000 × 1000 |
(1, ![[1 with combining macron]](https://www.rsc.org/images/entities/char_0031_0304.gif) ) ) |
0.548639 × 10−01 | (1, ![[1 with combining macron]](https://www.rsc.org/images/entities/char_0031_0304.gif) ) ) |
0.488627 × 10−03 | (1, ![[1 with combining macron]](https://www.rsc.org/images/entities/char_0031_0304.gif) ) ) |
0.215635 × 10−02 |
| (1, 1) | 0.000000 × 1000 | (1, 1) | 0.000000 × 10+00 | (1, 1) | 0.000000 × 1000 |
| (2, 0) | 0.000000 × 1000 | (2, 0) | 0.000000 × 10+00 | (2, 0) | 0.000000 × 1000 |
Finally, it is worthy to point out that none of the possible vibrational inelastic diffraction (VID's) peaks are appreciably populated. Taken into account that the vibrational excited energy for H2 (v = 0) → H2 (v = 1) is 515.8 meV, the absence of VID's further confirms that the energy transfer between the normal and the molecule internal motions is solely responsible for exciting the normal vibrational and rotational modes. Thus, for H2/KCl(001) under fast grazing incidence conditions the internal and the normal motions are coupled, whereas the internal and parallel motions seems to be decoupled.
Acknowledgements
The authors are grateful to Prof. L. Mendez for enlightening discussions about the beam generation process, to Prof. H. Winter and Dr E. Meyer for useful discussions about their experimental results, and to Prof. G.-J. Kroes, Dr E. Pijper and Dr M. F. Somers for allowing us to used their quantum dynamics code. This work has been supported by the MICINN projects PID2019-105458RB-I00 and PID2019-106732GB-I00, ‘Severo Ochoa’ Programme for Center of Excelence in R&D (CEX2020-001039-S), ‘María de Maeztu’ Programme for Units of Excellence in R&D (CEX2018-000805-M), and ANPCyT project PICT-2016 2750. We acknowledge the allocation of computer time by the Red Española de Supercomputación and the Centro de Computación Científica at the Universidad Autónoma de Madrid (CCC-UAM). M. del Cueto and A. S. Muzas acknowledge the FPI program of the MICINN co-financed by the European Social Fund.Notes and references
- P. Rousseau, H. Klemliche, A. G. Borisov and P. Roncin, Phys. Rev. Lett., 2007, 98, 016104 CrossRef CAS PubMed.
- A. Schuller, S. Wethekam and H. Winter, Phys. Rev. Lett., 2007, 98, 016103 CrossRef CAS PubMed.
- H. Hoinkes, Rev. Mod. Phys., 1980, 52, 933 CrossRef CAS.
- D. Frankl, Prog. Surf. Sci., 1983, 13, 285 CrossRef CAS.
- J. Barker and D. Auerbach, Surf. Sci. Rep., 1984, 4, 1 CrossRef.
- D. Farías and K. Rieder, Rep. Prog. Phys., 1998, 61, 1575 CrossRef.
- D. Farías, C. Díaz, P. Nieto, A. Salin and F. Martín, Chem. Phys. Lett., 2004, 390, 250 CrossRef.
- E. A. Andreev, Russ. J. Chem. Phys., 2002, 76, 5164 Search PubMed.
- D. Danailov, J. H. Rechtien and K. J. Snowdon, Surf. Sci., 1991, 259, 359 CrossRef CAS.
- C. Díaz, P. Rivière and F. Martín, Phys. Rev. Lett., 2009, 103, 013201 CrossRef PubMed.
- A. Zugarramurdi and A. Borisov, Phys. Rev. A: At., Mol., Opt. Phys., 2012, 86, 062903 CrossRef.
- A. Zugarramurdi and A. Borisov, Nucl. Instrum. Methods Phys. Res., Sect. B, 2013, 317, 83 CrossRef CAS.
- A. S. Muzas, F. Gatti, F. Martín and C. Díaz, Nucl. Instrum. Methods Phys. Res., Sect. B, 2016, 382, 49 CrossRef CAS.
- M. Busch, J. Seifert, E. Meyer and H. Winter, Phys. Rev. B: Condens. Matter Mater. Phys., 2012, 86, 241402 CrossRef.
- M. Debiossac, P. Pang and P. Roncin, Phys. Chem. Chem. Phys., 2021, 23, 7615 RSC.
- J. Lienemann, A. Schuller, D. Blauth, J. Seifert, S. Wethekam, M. Busch, K. Maass and H. Winter, Phys. Rev. Lett., 2011, 106, 067602 CrossRef CAS PubMed.
- F. Aigner, N. Somonovic, B. Sollerder, L. Wirtz and J. Burgdörfer, Phys. Rev. Lett., 2008, 101, 253201 CrossRef CAS PubMed.
- L. Frisco and M. S. Gravielle, Phys. Rev. A, 2019, 100, 062703 CrossRef CAS.
- L. Frisco and M. S. Gravielle, Phys. Rev. A, 2020, 102, 062821 CrossRef CAS.
- H. Winter and A. Schuller, Prog. Surf. Sci., 2011, 86, 169 CrossRef CAS.
- A. Schuller, H. Winter, M. S. Gravielle, J. M. Pruneda and J. E. Miraglia, Phys. Rev. A: At., Mol., Opt. Phys., 2009, 80, 062903 CrossRef.
- U. Specht, M. Busch, J. Seifert, A. Schüller and H. Winter, Phys. Rev. B: Condens. Matter Mater. Phys., 2011, 84, 125440 CrossRef.
- B. Lalmi, H. Khemliche, A. Momeni, P. Soulisse and P. Roncin, J. Phys.: Condens. Matter, 2012, 24, 442002 CrossRef CAS PubMed.
- M. Debiossac, A. Zugarramurdi, P. Lunca-Popa, A. Momeni, H. Khemliche, A. G. Borisov and P. Roncin, Phys. Rev. Lett., 2014, 112, 023203 CrossRef CAS PubMed.
- G. A. Bocan, H. Breiss, S. Szilasi, A. Momeni, E. M. S. Casagrande, M. S. Gravielle, E. A. Sánchez and H. Khemliche, Phys. Rev. Lett., 2020, 125, 096101 CrossRef CAS PubMed.
- M. Debiossac, P. Roncin and A. G. Borisov, J. Phys. Chem. Lett., 2020, 11, 4564 CrossRef CAS PubMed.
- H. Khemliche, P. Rousseau, P. Roncin, V. H. Etgens and F. Finocchi, Appl. Phys. Lett., 2009, 95, 151901 CrossRef.
- A. Schüller, D. Blauth, J. Seifert, M. Busch, H. Winter, H. Gärtner, R. Wlodarczyk, J. Sauer and M. Sierka, Surf. Sci., 2012, 606, 161 CrossRef.
- M. Busch, J. Seifert, E. Meyer and H. Winter, Nucl. Instrum. Meth. Phys. Res. B, 2013, 317, 90 CrossRef CAS.
- M. Debiossac, Z. Zugarramurdi, H. Khemliche, P. Roncin, A. G. Borisov, A. Momeni, P. Atkinson, M. Eddrief, F. Finocchi and V. H. Etgens, Phys. Rev. B: Condens. Matter Mater. Phys., 2014, 90, 155308 CrossRef.
- P. Atkinson, M. Eddrief, V. Etgens, H. Khempliche, M. Debiossac, A. Momeni, M. Mulier, B. Lalmi and P. Roncin, Appl. Phys. Lett., 2014, 105, 021602 CrossRef.
- M. Busch, E. Meyer, K. Irmscher, Z. Galazka, K. Gärtnes and H. Winter, Appl. Phys. Lett., 2014, 105, 051603 CrossRef.
- M. Debiossac, P. Atkinson, A. Zugarramurdi, M. Eddrief, F. Finacchi, V. H. Etgens, A. Momeni, H. Khemliche, A. G. Borisov and P. Roncin, Appl. Surf. Sci., 2017, 391, 53 CrossRef CAS.
- N. Bundaleski, H. Khemliche, P. Soulisse and P. Roncin, Phys. Rev. Lett., 2008, 101, 177601 CrossRef CAS PubMed.
- M. Busch, A. Schüller, S. Wethekam and H. Winter, Surf. Sci., 2009, 603, L23 CrossRef CAS.
- A. Schüller, M. Busch, J. Seifert, S. Wethekam and H. Winter, Phys. Rev. B: Condens. Matter Mater. Phys., 2009, 79, 235425 CrossRef.
- A. Schüller, M. Busch, S. Wethekam and H. Winter, Phys. Rev. Lett., 2009, 102, 017602 CrossRef PubMed.
- J. Seifert and H. Winter, Phys. Rev. Lett., 2012, 108, 065503 CrossRef CAS PubMed.
- M. Debiossac, A. Zugarramurdi, Z. Mu, P. Lunca-Popa, A. J. Mayne and P. Roncin, Phys. Rev. B, 2016, 94, 205403 CrossRef.
- J. Seifert and H. Winter, Surf. Sci., 2009, L109, 603 Search PubMed.
- J. Seifert, A. Schuller, H. Winter, R. Wlodarczyk, J. Sauer and M. Sierka, Phys. Rev. B: Condens. Matter Mater. Phys., 2010, 82, 035436 CrossRef.
- J. Seifert, M. Busch, E. Meyer and H. Winter, Phys. Rev. Lett., 2013, 111, 137601 CrossRef CAS PubMed.
- J. Seifert, M. Busch, E. Meyer and H. Winter, Phys. Rev. B: Condens. Matter Mater. Phys., 2014, 89, 075404 CrossRef.
- A. Momeni, E. M. S. Casagrande, A. Dechaux and H. Khemliche, J. Phys. Chem. Lett., 2018, 9, 908 CrossRef CAS PubMed.
- M. S. Gravielle and J. E. Miraglia, Phys. Rev. A: At., Mol., Opt. Phys., 2009, 78, 022901 CrossRef.
- M. S. Gravielle and J. E. Miraglia, Phys. Rev. A: At., Mol., Opt. Phys., 2014, 90, 052718 CrossRef.
- A. Zugarramurdi, M. Debiossac, P. Lunca-Popa, A. J. Mayne, A. Momeni, A. G. Borisov, P. Roncin and H. Khemliche, Appl. Phys. Lett., 2015, 106, 101902 CrossRef.
- M. S. Gravielle and J. E. Miraglia, Phys. Rev. A: At., Mol., Opt. Phys., 2015, 92, 062709 CrossRef.
- P. Tiwald, A. Schuller, H. Winter, K. Tokesi, F. Aigner, S. Grafe, C. Lemell and J. Burgdorfer, Phys. Rev. B: Condens. Matter Mater. Phys., 2010, 82, 125453 CrossRef.
- C. A. Ríos-Rubiano, G. A. Bocan, M. S. Gravielle, N. Bundaleski, H. Khemliche and P. Rocin, Phys. Rev. A: At., Mol., Opt. Phys., 2013, 87, 012903 CrossRef.
- C. A. R. Rubiano, G. A. Bocan, J. I. Juaristi and M. S. Gravielle, Phys. Rev. A: At., Mol., Opt. Phys., 2014, 89, 0327706 Search PubMed.
- A. S. Muzas, F. Martín and C. Díaz, Nucl. Instrum. Methods Phys. Res., Sect. B, 2015, 354, 9 CrossRef CAS.
- G. A. Bocan, J. D. Fuhr and M. S. Gravielle, Phys. Rev. A, 2016, 94, 022711 CrossRef.
- G. A. Bocan and M. S. Gravielle, Nucl. Instrum. Methods Phys. Res., Sect. B, 2018, 421, 1–6 CrossRef CAS.
- M. del Cueto, A. S. Muzas, F. Martín and C. Díaz, Nucl. Instrum. Methods Phys. Res., Sect. B, 2020, 476, 1–9 CrossRef CAS.
- A. Schüller and H. Winter, Phys. Rev. Lett., 2008, 100, 097602 CrossRef PubMed.
- J. R. Manson, P. Roncin and H. Khemliche, Phys. Rev. B, 2018, 78, 155408 CrossRef.
- M. S. Gravielle, A. Schüller, H. Winter and J. Miraglia, Nucl. Instrum. Methods Phys. Res., Sect. B, 2011, 269, 1208 CrossRef CAS.
- L. Frisco, J. E. Miraglia and M. S. Gravielle, J. Phys.: Condens. Matter, 2018, 30, 405001 CrossRef CAS PubMed.
- D. Farías, H. F. Busnengo and F. Martín, J. Phys.: Condens. Matter, 2007, 19, 305003 CrossRef.
- D. Farías and R. Miranda, Prog. Surf. Sci., 2011, 86, 222 CrossRef.
- P. Rousseau, H. Klemliche, N. Bundaleski, P. Soulisse, A. Momeni and P. Roncin, J. Phys.: Conf. Ser., 2008, 133, 012013 CrossRef.
- D. Stradi, C. Díaz and F. Martín, Surf. Sci., 2010, 604, 2031 CrossRef CAS.
- M. del Cueto, A. S. Muzas, M. F. Somers, G. J. Kroes, C. Díaz and F. Martín, Phys. Chem. Chem. Phys., 2017, 19, 16317 RSC.
- A. S. Muzas, M. del Cueto, F. Gatti, M. F. Somers, G. J. Kroes, F. Martín and C. Díaz, Phys. Rev. B, 2017, 96, 205432 CrossRef.
- G. J. Kroes and R. C. Mowrey, J. Chem. Phys., 1995, 103, 2186 CrossRef CAS.
- E. Meyer, PhD thesis, Humboldt-Universität zu Berlin, 2016.
- H. F. Busnengo, A. Salin and W. Dong, J. Chem. Phys., 2000, 112, 7641 CrossRef CAS.
- G. Kresse and J. Hafner, Phys. Rev., 1993, 47, 558 CAS.
- G. Kresse and J. Hafner, Phys. Rev., 1994, 49, 14251 CAS.
- G. Kresse and J. Furthmuller, Phys. Rev. B: Condens. Matter Mater. Phys., 1996, 54, 11169 CrossRef CAS PubMed.
- J. P. Perdew, K. BurKe and M. Ernzerhof, Phys. Rev. Lett., 1996, 77, 3865 CrossRef CAS PubMed.
- P. E. Blöchl, Phys. Rev. B: Condens. Matter Mater. Phys., 1994, 50, 17953 CrossRef PubMed.
- G. Kresse and D. Joubert, Phys. Rev. B: Condens. Matter Mater. Phys., 1999, 59, 1758 CrossRef CAS.
- N. R. Hill, Phys. Rev. B: Condens. Matter Mater. Phys., 1979, 19, 4269 CrossRef CAS.
- E. Pijper and G. J. Kroes, Phys. Rev. Lett., 1998, 80, 488 CrossRef CAS.
- D. Kosloff and R. Kosloff, J. Comput. Phys., 1988, 52, 35 CrossRef.
- E. Pijper, G. j Kroes, R. A. Olsen and E. J. Baerends, J. Chem. Phys., 2002, 117, 5885 CrossRef CAS.
- G. J. Kroes, Prog. Surf. Sci., 1999, 60, 1 CrossRef CAS.
- G. J. Kroes and M. F. Somers, J. Theor. Comput. Chem., 2005, 4, 493 CrossRef CAS.
- G. J. Kroes and C. Díaz, Chem. Soc. Rev., 2016, 45, 3658 RSC.
- M. D. Feit, J. J. A. Fleck and A. Steiger, J. Comput. Phys., 1982, 47, 412 CrossRef CAS.
- J. C. Light, I. P. Hamilton and J. V. Lill, J. Chem. Phys., 1985, 82, 1400 CrossRef CAS.
- G. C. Corey and D. Lemoine, J. Chem. Phys., 1992, 97, 4115 CrossRef CAS.
- G. G. Balint-Kurti, R. N. Dixon and C. C. Marston, J. Chem. Soc., Faraday Trans., 1990, 86, 1741 RSC.
- E. Watts and G. O. Sitz, J. Chem. Phys., 2001, 114, 4171 CrossRef CAS.
- L. C. Shackman and G. O. Sitz, J. Chem. Phys., 2001, 123, 064712 CrossRef PubMed.
- O. Godsi, G. Corem, Y. Alkoby, J. T. Cantin, R. V. Krems, M. F. Somers, J. Meyer, G. J. Kroes, T. Maniv and G. Alexandrowicz, Nat. Commun., 2017, 8, 15357 CrossRef CAS PubMed.
- Y. Alkoby, H. Chadwick, O. Godsi, H. Labiad, M. Bergin, J. T. Cantin, I. Litvin, T. Maniv and G. Alexandrowicz, Nat. Commun., 2020, 11, 3110 CrossRef CAS PubMed.
- N. Ashcroft and D. Mermin, Solid State Physics, Thomson Press, 1976 Search PubMed.
- G. J. Kroes, M. Wijzenbroek and J. R. Manson, J. Chem. Phys., 2017, 147, 244705 CrossRef CAS PubMed.
- M. Bonfanti, M. F. Somers, C. Díaz, H. F. Busnengo and G. J. Kroes, Z. Phys. Chem., 2013, 227, 1397 CAS.
- G. J. Kroes, Phys. Chem. Chem. Phys., 2021, 23, 8962 RSC.
| This journal is © the Owner Societies 2022 |

