 Open Access Article
Strain modulation in small molecule physisorption in two dimensions: LEED structure analysis and DFT modeling of the system  †
†
Jochen
Vogt

Chemisches Institut der Universität Magdeburg, Universitätsplatz 2, Magdeburg, Germany. E-mail: jochen.vogt@ovgu.de; Fax: +49 391 6711387; Tel: +49 391 6751836
First published on 5th April 2022
Abstract
The structure of the system  was investigated experimentally by means of quantitative LEED I(V) analysis and computationally using dispersion corrected density functional theory (DFT-D). Three different structure models with four, five, and six molecules were considered. The lowest reliability factors and thus best agreement of measured and calculated I(V) curves was found for the structure model containing five molecules per surface unit cell. Essential features of the experimental best-fit adlayer structure are supported by DFT. A slight inclination and lateral shift of twofold coordinated molecules away from the on-top position over Na+ adsorption sites is interpreted as compensation of strain between substrate and adlayer.
1 Introduction
In the absence of covalent bonding between an admolecule and a surface, weak electrostatic forces and dispersive interaction govern the molecule's attachment to the surface and thus its adsorption geometry. Judged on the fairly disentangled electronic structure in such physisorption systems, the latter are occasionally characterized as simple systems, although the interplay between molecule–surface and molecule–molecule interaction might lead to a fairly complex growth behaviour, involving order–disorder phase-transitions, and even sequences of several ordered phases. Examples of the latter type are sometimes characterized as (incomplete) devil's staircases.1,2Experimental surface structure analyses on such systems, with the aim to determine the position and orientation of all molecules in the unit cell, however, were restricted so far mostly to systems with compact 2D unit cells with at most two molecules.‡![[thin space (1/6-em)]](https://www.rsc.org/images/entities/char_2009.gif) 3–5 Larger unit cells extending over several substrate lattice constants are typically observed if there is a moderate mismatch between the substrate lattice constant and the basal plane lattice parameter of the molecular adsorbate. Acetylene adsorption on the NaCl(100) surface is an example of such a system. The present paper is an attempt to provide the first experimental structure analysis of its
3–5 Larger unit cells extending over several substrate lattice constants are typically observed if there is a moderate mismatch between the substrate lattice constant and the basal plane lattice parameter of the molecular adsorbate. Acetylene adsorption on the NaCl(100) surface is an example of such a system. The present paper is an attempt to provide the first experimental structure analysis of its  phase and to substantiate a previously suggested structure model involving five translationally inequivalent molecules, thus extending quantitative LEED structure analysis to more complex cases of small molecule physisorption on insulator surfaces.
Adsorption of acetylene on alkali halides has been investigated both experimentally and theoretically in several studies.4,7–13 On the KCl(100) surface, whose lattice parameter closely matches the intermolecular distance in the basal plane of orthorhombic acetylene,14 a layer-by-layer growth mode of acetylene thin films was observed in helium atom diffraction experiments.9 For the first layer, a  translational symmetry was deduced,8 and the adsorbate geometry was completely determined based on quantitative LEED I(V) structure analysis.4 On the (100) plane of NaCl, which has a smaller lattice parameter than KCl, the growth of acetylene thin films is more complicated. By means of helium atom scattering (HAS), two different phases were observed,13 a more dilute phase with
  translational symmetry, and a more dense phase with a
  unit cell.
While the extremely surface sensitive HAS method is very useful and accurate for the determination of 2D lattice symmetry, the determination of the atomic positions and molecular orientation within the adlayer has not been possible so far. Most promising is LEED I(V) structure analysis15,16 for the C2H2/NaCl(100) system. Low-energy electron diffraction (LEED) is a surface sensitive method, which is well-established for metals and semiconductors. From the analysis of the diffraction peak intensities as a function of electron kinetic energy, a surface structure determination is possible.15 However, as will become apparent in the rest of this paper, quantitative LEED applied to insulators has to tackle a number of difficulties. From the experimental point of view, surface charging effects are possible when the electron beam strikes the insulator surface.17 At the same time, surface damage of the very sensitive adsorbate is possible. Both effects are reduced if primary beam currents in the nA range are used and thus the electron exposure is reduced as far as possible. Moreover, the energy window for LEED experiments without extensive charging starts above about 60 eV in the case of NaCl. In this energy range, uncontrollable drifts of the surface potential are suppressed, and the viability of LEED from insulator surfaces has been demonstrated in the literature.2,3,5,6 However, for a system with a large unit cell and thus many atomic sites that need to be located, the limited energy window starting at above 60 eV reduces the accessible I(V) data range. Especially the fractional order diffraction beams become typically quite weak in intensity at higher energies. The exclusion of the range < 60 eV is thus a serious limitation in this system.
On the other hand, due to the weak molecule–surface interaction, it can be expected that the internal structure of the molecular adsorbate maintains its gas-phase geometry, bond lengths and bond angles are not changed as in the case of chemisorption. This offers the possibility to reduce the number of free parameters in a physically meaningful structure model, and this route is taken in this work.
Quantum chemical studies on the system C2H2/NaCl(100) have been reported by Allouche10 on the Hartree–Fock level. More recently the system has been investigated by Ehrlich et al.11 using various types of dispersion corrected density functional theory (DFT-D2 and DFT-D3) and by Bučko et al.12 using Tatschenko–Scheffler dispersion correction. Both works are focusing on a  unit cell containing two molecules, or on an isolated monomer. A computational study of various unit cell sizes based on the Lennard-Jones model pair potential has been conducted by Picaud et al.,18 including fully fletched phonon calculations.
This paper is organized as follows. In Section 2 the experimental setup is summarized, and experimental data are presented. Moreover, details of the applied LEED I(V) analysis of these data are provided. Structure models are defined and the resulting best-fit geometries are described. Section 3 gives a compact description of the applied DFT methods by means of which minimum energy geometries for the various structure models were obtained. In Section 4 the experimental and computational results are discussed, and potential sources of errors are considered. The paper closes with a short summary.
2 Experimental section
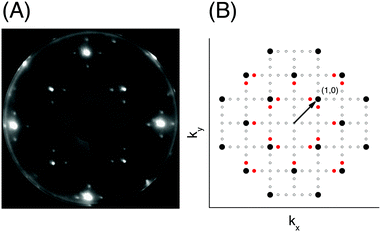
The apparatus for surface science experiments with insulator single crystal surfaces has been described in previous publications.19,20 The ultrahigh vacuum recipient (base pressure 1 × 10⁻¹⁰ mbar) is equipped with a quadrupole mass spectrometer for gas analysis, and a double microchannelplate LEED optics (Omicron) for diffraction experiments with primary electron currents in the nano-Ampere range to avoid charging of the insulating sample.A fresh NaCl(100) surface was obtained by cleaving a NaCl single crystal (Korth Kristalle, Germany) in nitrogen atmosphere. For the preparation of the adsorbate layer, the sample was cooled down to a temperature of 75 K. Then the sample was exposed to C2H2 (Messer–Griesheim, purity 99.6%) at a partial pressure of 1.0 × 10⁻⁸ mbar. Under these conditions, the  phase grew within four minutes, indicated by the appearance of fractional order diffraction spots. Then the gas exposure was stopped and the sample was cooled down to a temperature of 26 K, resulting in an increase of diffraction peak intensities due to the Debye–Waller effect.15 LEED patterns (see Fig. 1) were recorded at normal incidence in steps of 2 eV between 70 eV and 300 eV using a CCD camera with 4096 gray values. The operation of the MCPLEED was controlled in such a way that electrons irradiated the surface only during the integration time of the camera, thus reducing electron bombardment of the surface as much as possible. Background corrected integrated beam intensities were generated from the image data using a method described in ref. 21. The resulting set of experimental I(V) curves for seven inequivalent beam orders including three of fractional order is shown in Fig. 2 as thick blue lines. Note that even the brightest fractional order beams are about a factor of 10 lower in intensity.
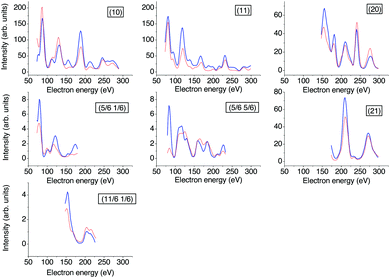 | ||
| Fig. 2 Experimental versus calculated best-fit LEED I(V) curves. The thicker blue lines represent experimental data recorded at 26 K, the red lines the calculated best-fit spectra for structure model B. For the Pendry R-factors see Table 2. | ||
| Class | N t | N e | P r | P m | P | Extra symmetry |
|---|---|---|---|---|---|---|
| A | 4 | 2 | 6 | 11 | 17 | Glide-plane |
| B | 5 | 3 | 8 | 13 | 21 | 2D inversion center |
| C | 6 | 3 | 6 | 16 | 22 | Glide-plane |
2.1 LEED I(V) analysis
Due to the multiscattering nature of the interaction of low-energy electrons with matter,15 the calculation of diffraction beam intensities in LEED is a numerically expensive task which has to be repeated for every electron energy and for every trial geometry considered in a structure analysis. In the present study, routines of the Barbieri/Van Hove SATLEED package22 in combination with the Barbieri/Van Hove phase shift package22 were used to calculate I(V) spectra. However, the organization of the structure search was controlled by an in-house algorithm. The method minimizes the reliability factor proposed by Pendry,15,16,23RP, by adjusting molecular structure parameters rather than atomic sites, using the gradient-free Powell direction set method.24 These molecular structure parameters are the Cartesian coordinates of the molecular center of mass, the azimuthal orientation in the crystal frame of reference, and the molecular tilt angle with respect to the surface normal, respectively, as explained below in Section 2.1.1. For the internal structure of the molecules, the gas-phase value of the carbon–carbon bond length of 1.203 Å was assumed.25 Because of the small electron scattering cross-section of hydrogen,3,6 only diffraction from carbon atomic sites within the acetylene molecule was considered in the LEED analysis. Phase shifts were considered up to an angular momentum of lmax = 6. Using lmax = 7 changed the values of RP in the best-fit geometry only by about 0.002. Phase shifts were corrected for isotropic thermal vibrations of the scattering sites using fixed root means square (RMS) vibrational amplitudes of 0.11 Å for Cl−, 0.15 Å for Na+, and 0.18 Å for carbon. While the NaCl substrate was treated as rigid with a low-temperature bulk lattice constant26 of 5.60 Å, the vertical positions of the ions in the topmost substrate layer were treated as variable. All beam intensity calculations were carried out in a full dynamic fashion, bypassing the possibility of the very fast tensor LEED approximation,16 which, however, is only valid if the atomic positions vary no more than about 0.2 Å. Experience with this type of weakly bound adsorbates shows that during a structural search this range is rather often exceeded. The imaginary part of the inner potential was set to a value of Vi = −3.0 eV, the real part Vr of the inner potential was automatically adjusted as a non-structural model parameter. system, it is helpful to consider the geometric arrangement of the molecules in the well-known system
  . Here the acetylene molecules are arranged in a checkerboard-like fashion in a T-shaped arrangement of neighboring molecules, which is characteristic for optimized quadrupole–quadrupole interaction of the linear molecules. The molecular axes are strictly parallel to the surface plane, and the low-energy adsorption site is on top of the cation. It is conceivable, that on the NaCl(100) surface a similar structural pattern of T-shaped arrangement is realized. However, due to the lattice mismatch between adsorbate and substrate, the structure may be modulated, including the possibility that strain causes a segmentation of the adsorbate with one or several adsorption sites being vacant. Moreover, it has been observed that in physisorption systems with more than one molecule in the surface unit cell, translationally inequivalent molecules are related by symmetry. Glide-planes are a frequently occurring symmetry element in these systems, and on the KCl(100) surface, the two inequivalent molecules are related by two glide-planes.4,8 It is conceivable that also in larger unit cells the molecules occupy isoenergetic sites related by symmetry. In the structure models for the acetylene–NaCl(100) system, such extra symmetry is also assumed, which has the effect of a further reduction of independent structure parameters.
Among the possible structure models, three types were preselected based on DFT calculations (see Section 3) and previously published experimental and computational results.19 These three investigated classes of models are illustrated in Fig. 3, and some properties are summarized in Table 1.
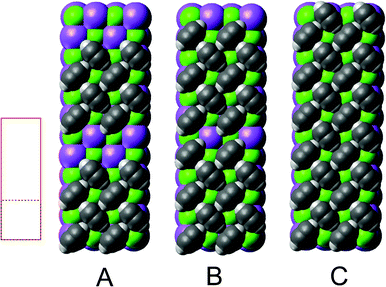 | ||
Fig. 3 Structure models A, B, and C for the system  with 4, 5, and 6 translationally inequivalent molecules per unit cell, respectively. Shown are 2 × 2 unit cells in top view. The red square rectangle on the left illustrates the extension of the surface unit cell, while the dashed line indicates the reduced size of a with 4, 5, and 6 translationally inequivalent molecules per unit cell, respectively. Shown are 2 × 2 unit cells in top view. The red square rectangle on the left illustrates the extension of the surface unit cell, while the dashed line indicates the reduced size of a  cell. See also Table 1. cell. See also Table 1. | ||
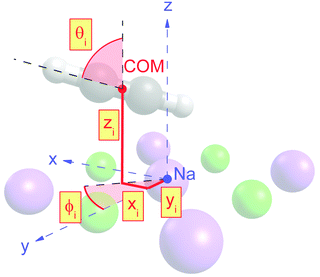
Class A (Fig. 5) contains four translationally inequivalent molecules related by glide-plane symmetry along the shorter side of the unit cell. Thus, the model assumes two energetically inequivalent sites occupied by molecules. The position and orientation of each of these two molecules is described via 5 structure parameters, the three cartesian coordinates of the center of mass (COM), and two angles tilt and azimut, as illustrated in Fig. 4. In addition, the distance of the adlayer to the first substrate layer and the rumpling of six inequivalent surface ions gives a total number P = 17 structure parameters.
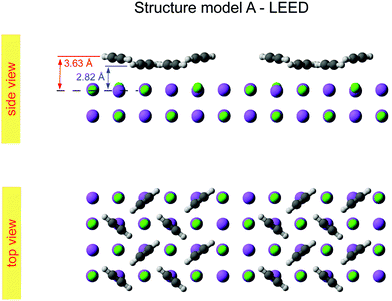 | ||
| Fig. 5 Best-fit geometry obtained from LEED analysis of structure model A in top view and side view. | ||
Class B (Fig. 6) involves 5 translationally inequivalent molecules related by 2D inversion symmetry in the COM of one molecule, whose lateral position is thus fixed over the cation, and its tilt is parallel to the surface plane by symmetry.
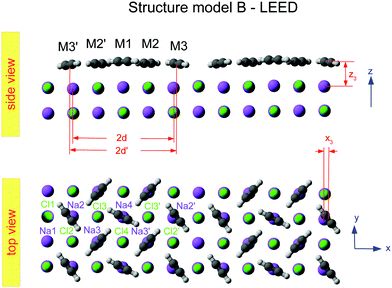 | ||
| Fig. 6 Best-fit geometry obtained from LEED analysis of structure model B in top view and side view. Structure parameters of the three energetically inequivalent molecules M1, M2, and M3 and vertical shifts of energetically inequivalent ions Na1 to Na4 and Cl1 to Cl4 are given in Table 3. Molecules and ions denoted with a prime are energetically equivalent by symmetry. | ||
Class C (Fig. 7), finally, is a full monolayer containing 6 translationally inequivalent molecules, related by glide-plane symmetry. In the absence of any strain modulation, this structure would effectively conform to a  symmetry.
| Property | LEED (best-fit) | DFT-D3 | DFT-D2 |
|---|---|---|---|
| Na1: Δz (Å) | +0.08 (6) | −0.17 | −0.15 |
| Cl1: Δz (Å) | +0.08 (4) | −0.05 | +0.01 |
| Na2: Δz (Å) | −0.08 (4) | −0.03 | −0.01 |
| Cl2: Δz (Å) | −0.08 (4) | +0.03 | +0.07 |
| Na3: Δz (Å) | −0.04 (6) | −0.01 | −0.00 |
| Cl3: Δz (Å) | +0.07 (4) | +0.08 | +0.09 |
| Na4: Δz (Å) | +0.04 (4) | +0.00 | +0.00 |
| Cl4: Δz (Å) | −0.04 (4) | +0.08 | +0.09 |
| M1: x1 (Å) | +0 (bysym.) | −0.03 | +0.03 |
| M1: y1 (Å) | +0 (bysym.) | −0.06 | −0.06 |
| M1: z1 (Å) | +2.93 (9) | +2.99 | 2.76 |
| M1: θ1 (°) | +90 (bysym.) | +91 | +91 |
| M1: φ1 (°) | −63 (4) | −43 | −45 |
| M2: x2 (Å) | +0.06 (4) | +0.21 | +0.13 |
| M2: y2 (Å) | −0.01 (5) | −0.07 | +0.02 |
| M2: z2 (Å) | 2.73 (9) | +2.98 | 3.11 |
| M2: θ2 (°) | +90 (3) | +92 | +89 |
| M2: φ2 (°) | +42 (3) | +44 | +44 |
| M3: x3 (Å) | +0.43 (5) | +0.49 | +0.34 |
| M3: y3 (Å) | −0.02 (3) | −0.17 | −0.02 |
| M3: z3 (Å) | +2.62 (9) | +2.98 | 2.77 |
| M3: θ3 (°) | +95 (2) | +94 | +94 |
| M3: φ3 (°) | −38 (2) | −48 | −45 |
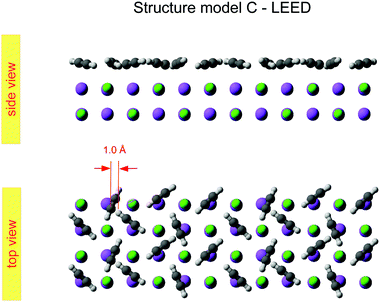
The obtained optimum geometry for structure model A in Fig. 5 with four inequivalent molecules shows the expected nearly T-shaped arrangement of the molecules adsorbed near the cation sites. The vertical distance of the two fourfold coordinated molecules to the surface plane is 2.81 Å. However, the distance of the twofold coordinated molecules is 3.63 Å and thus unrealistically large. Similarly, the optimum geometry for structure model C with six inequivalent molecules in Fig. 7 is characterized by two molecules being unphysically near to each other with some hydrogens approaching the carbon site of the next neighbor molecule as close as 1.0 Å. Apart from the worse agreement judged on their RP values, some structural features of the obtained geometries of model A and C are thus questionable, leaving model B with also the lowest RP value as candidate for the real surface structure of the  system. The best-fit parameters of structure model B will be discussed in more detail in the Section 4 in comparison with its minimum energy structure from DFT.
3 DFT calculations
The DFT calculations were performed using the Quantum Espresso package27–29 (version 6.8). The surface was represented by a slab of four NaCl layers, separated in vertical direction by 30 Å. A plane wave basis with an energy cutoff of 41 Ry was used in combination with a 2 × 6 × 1 Monkhorst–Pack grid.30 Projector-augmented wave (PAW) pseudopotentials were taken from A. Dal Corso's library.31 Geometry optimizations were performed for the structure models A, B, and C (see Fig. 3) using Perdew–Burke–Ernzerhof (PBE) functionals augmented with Grimme's DFT-D2 correction32 for dispersive interaction, as well as the DFT-D3 correction.33 Apart from translational symmetry, no extra symmetry was used. Vertical positions of the ions in the bottom layer were fixed to the unrelaxed bulk position with a lattice constant of 5.70 Å, the latter being preoptimized in variable-cell relaxation of bulk NaCl. For a given structure with n molecules, the adsorption energy Ec per molecule at 0 K was calculated from
 | (1) |
 | (2) |
 | (3) |
3.1 DFT results
Total energy minimization of the structures shown in Fig. 3 did, as expected, not significantly change the internal structure of the adsorbed molecules. The DFT-D3 optimization led to carbon–carbon bond lengths of rCC = 1.211 Å and carbon–hydrogen bond lengths of rCH = 1.075 Å, in both cases slightly overestimating the respective experimental gas-phase values25 of 1.203 Å and 1.062 Å, respectively. DFT-D2 optimizations led to rCC = 1.211 Å and rCH = 1.076 Å. A similar trend of bond length overestimation of these methods was previously observed for carbon dioxide.37 The adsorption energies of the various structures after optimization are presented in Table 4. For both versions of dispersion correction, the full monolayer structure C with 6 molecules per unit cell is lowest in energy. However, in optimizations with DFT-D3, structure B with five molecules is only slightly higher in energy by about 0.1 kJ mol−1, while in optimizations with DFT-D2 this difference is 1.4 kJ mol−1 and thus considerably larger. The PBE/DFT-D3 adsorption energies are closer to the experimental value36 of the isosteric heat of adsorption of 30 kJ mol−1 at T ∼ 80 K. Note that the calculated adsorption energies at zero Kelvin are not sufficient to predict the stability of the considered geometries at a finite temperature, and that a full stability analysis based on Gibbs free adsorption energies34 is beyond the scope of this paper.4 Discussion
The presented results of the LEED structure analysis support model B with five translationally inequivalent molecules per unit cell. Additional support of this structure model can be gained from comparing the best-fit geometry with the minimum energy structures obtained from DFT. Table 3 summarizes and compares sets of structure parameters. For the eight energetically inequivalent ion positions of the topmost substrate layer, their vertical displacements relative to their geometrical mean vertical position are given as parameter Δz. These ionic sites are indicated in Fig. 6 as Na i, and Cl i, i = 1,…,4. Molecular parameters for the three inequivalent molecules Mi, i = 1,…,3, are the position xi, yi, and zi measured with respect to the position of the local sodium ion, over which the molecule is situated. The orientation of the molecules is characterized by means of the azimuthal angle φi measured against the y-axis, and the tilt θi with respect to the surface normal, respectively. Comparison of the geometries depicted in Fig. 6 and Fig. 8 reveals several common features. Firstly, from the top view perspective, the nearly T-shaped arrangement of neighboring molecules is evident. However, according to LEED, the azimuthal angles vary more strongly between −63° for the fourfold coordinated molecule M1, +42° for molecule M2, and −38° for the twofold coordinated molecule M3, indicating more flexibility in the lateral orientation than predicted by DFT, for which both versions of DFT-D give values near to ±45°. A lateral layer expansion in the sense that the mean distance 2d′ (see Fig. 6) between the acetylene molecules M3 and M3′ in x-direction is larger than twice the substrate lattice parameter 2d can be deduced both from LEED and DFT. Both methods find a lateral shift of the molecule M3 in x-direction of x3∼ 0.4 Å. Thus, based on the parameter set obtained by LEED, the resulting parameter 2d′ = 2(d + x3) is consistent with d′ = 6.0(1) Å. This value is close to the solid-state acetylene lattice parameter a0 = 6.09 Å in its orthorhombic phase.14 A possible interpretation of this lateral adlayer expansion is based on strain in a system with lattice misfit: a strict on top adsorption of acetylene would lead to a compressed surface layer with increased intermolecular repulsion. The twofold-coordinated molecules M3 and M3′ compensate this resulting strain by a slight lateral shift. Interestingly, DFT-D predicts also a weaker shift of molecules M2 and M2′ in the order of 0.1 to 0.2 Å depending on the version of dispersion correction, while the result based on LEED structure analysis is consistent with a weaker displacement in x-direction of 0.06 ± 0.04 Å. Moreover, according to LEED, the twofold coordinated molecules M3 are somewhat inclined with θ3 = 95 ± 2°, also in accordance to the value of 94° predicted by both versions of DFT-D. Again, this inclination towards the substrate could be interpreted as stabilization of the only twofold coordinated molecules due to increased molecule–substrate interaction. The structure supported by LEED in Fig. 6 inspected from side view reveals a curved variation of the vertical distance of the molecules (Fig. 6), with molecule M3 being closest to the surface plane, and M1 at 2.93 ± 0.09 Å above the Na+ cation underneath. An explanation of this modulation of vertical distances may be based on strain. However, this structural feature is not supported by DFT-D3, which predicts very similar values for the parameters zi, i = 1,…,3 of 2.99 to 2.98 Å.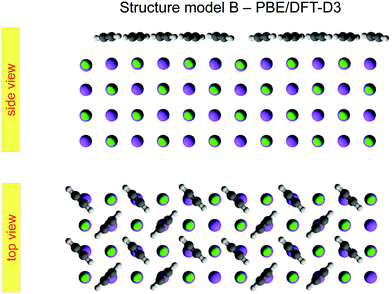 | ||
| Fig. 8 Minimum energy structure for model B, calculated from a PBE/DFT-D3 geometry optimization of a four layer slab. | ||
These aforementioned structural similarities are a strong basis for the validity of structure model B. A look on the vertical shifts of the ions in the first layer, however, reveals also differences, which need to be discussed. The most obvious difference is the position of ion Na1, i.e. the sodium site which is not occupied by an acetylene molecule. The LEED analysis suggests an elevated position of Na1 and Cl1 of +0.08 Å over the surface plane, while both DFT-D methods predict an unusually large inward shift of the sodium ion Na1 of −0.17 Å (DFT-D3) and −0.15 Å (DFT-D2), respectively. The relaxation of ions at the NaCl surface is driven by comparatively small energy differences of less than 1 kJ mol−1 per substrate surface unit cell. It is thus conceivable that relaxation patterns with slightly higher energy exist, that could become more favorable if other functionals and dispersion correction are used. From the experimental point of view, some limitations of the LEED analysis method especially for insulator surfaces have been mentioned above in Section 1. As the shape of the potential energy surface may be influenced by the choice of functionals in DFT, the profile of reliability factors in LEED may be influenced by the choice of non-structural parameters, phase shifts and vibrational amplitudes. These non-structural parameters used in the present study were chosen based on the experience obtained in previous work.4,38,39 Vibrational amplitudes in general do not strongly alter the RP values.15 Thus, as is common practice, fixed RMS were assigned to the various chemical elements. Strictly speaking, however, the site Na1 could be considered as vibrationally inequivalent from the other sites, since it is not occupied by an admolecule. The use of a different vibrational amplitude for this ion could thus be a way of further refinement of the model. Moreover, a further systematic error in LEED analysis might result from the use of isotropic vibrational amplitudes for the ionic sites. While the correction of phase shifts for anisotropic displacements of ions is possible,40 such a refinement of the method would also drastically increase the number of parameters in the structure analysis – contrary to the intention of the present work, which was to maintain structure models with a minimum number of parameters. Such refinements could be envisaged in future experimental work.
5 Conclusions
Weakly bound adsorbates on insulating substrates may show complex surface geometries in two dimensions. The application of low-energy electron diffraction to these systems is a route to gain insight into their structure, if extensive surface charging may be avoided, and if suitable structure models can be developed based on previous experimental work and theoretical considerations. In the present work, the structure of the system was investigated experimentally by means of quantitative LEED analysis using three classes of structure models with four, five, and six molecules, respectively. Best agreement was found for a structure of five molecules per unit cell in an T-shaped arrangement of nearly flatly adsorbed molecules over sodium sites. In agreement with dispersion corrected DFT total energy minimizations, a lateral adlayer expansion along the longer axis of the unit cell was found and interpreted by strain due to the lattice misfit between the NaCl substrate surface and the acetylene adlayer.
Conflicts of interest
There are no conflicts to declare.Acknowledgements
I am grateful to the University of Magdeburg and its facilities for financial and technical support of the ongoing projects.Notes and references
- P. Bak, Rep. Prog. Phys., 1982, 45, 587–629 CrossRef
.
- P. Audibert, M. Sidoumou and J. Suzanne, Surf. Sci., 1992, 273, L467–L471 CrossRef CAS
.
- D. Ferry, P. N. M. Hoang, J. Suzanne, J.-P. Bibérian and M. A. Van Hove, Phys. Rev. Lett., 1997, 78, 4237–4240 CrossRef CAS
.
- J. Vogt and H. Weiss, Phys. Rev. B: Condens. Matter Mater. Phys., 2008, 77, 125415 CrossRef
.
- J. Vogt and H. Weiss, J. Chem. Phys., 2003, 119, 1105–1114 CrossRef CAS
.
- D. Ferry, S. Picaud, P. Hoang, C. Girardet, L. Giordano, B. Demirdjian and J. Suzanne, Surf. Sci., 1998, 409, 101–116 CrossRef CAS
.
- A. Allouche, J. Phys. Chem., 1996, 100, 17915–17922 CrossRef CAS
.
- A. L. Glebov, V. Panella, J. P. Toennies, F. Traeger, H. Weiss, S. Picaud, P. N. M. Hoang and C. Girardet, Phys. Rev. B: Condens. Matter Mater. Phys., 2000, 61, 14028–14036 CrossRef CAS
.
- J. P. Toennies, F. Traeger, H. Weiss, S. Picaud and P. N. M. Hoang, Phys. Rev. B: Condens. Matter Mater. Phys., 2002, 65, 165427 CrossRef
.
- A. Allouche, Surf. Sci., 1997, 374, 117–124 CrossRef CAS
.
- S. Ehrlich, J. Moellmann, W. Reckien, T. Bredow and S. Grimme, ChemPhysChem, 2011, 12, 3414–3420 CrossRef CAS PubMed
.
- T. Bučko, S. Lebegue, J. G. Angyan and J. Hafner, J. Chem. Phys., 2014, 141, 034114 CrossRef PubMed
.
- A. Glebov, R. E. Miller and J. P. Toennies, J. Chem. Phys., 1997, 106, 6499–6506 CrossRef CAS
.
- R. K. McMullan, Å. Kvick and P. Popelier, Acta Crystallogr., Sect. B: Struct. Sci., 1992, 48, 726–731 CrossRef
.
-
M. A. Van Hove, W. H. Weinberg and C.-M. Chan, Low-Energy Electron Diffraction, Springer, Berlin, 1986 Search PubMed
.
- M. Van Hove, W. Moritz, H. Over, P. Rous, A. Wander, A. Barbieri, N. Materer, U. Starke and G. Somorjai, Surf. Sci. Rep., 1993, 19, 191–229 CrossRef CAS
.
- J. Cazaux, J. Electron Spectrosc. Relat. Phenom., 2010, 176, 58–79 CrossRef CAS
.
- S. Picaud, P. N. M. Hoang, C. Girardet, A. Glebov, R. E. Miller and J. P. Toennies, Phys. Rev. B: Condens. Matter Mater. Phys., 1998, 57, 10090–10099 CrossRef CAS
.
- A. G. Cabello-Cartagena, J. Vogt and H. Weiss, J. Chem. Phys., 2010, 132, 074706 CrossRef CAS PubMed
.
-
J. Vogt, in Encyclopedia of Interfacial Chemistry, ed. K. Wandelt, Elsevier, Oxford, 2018, pp. 202–212 Search PubMed
.
- G. Held, S. Uremovic, C. Stellwag and D. Menzel, Rev. Sci. Instrum., 1996, 67, 378–383 CrossRef CAS
.
- A. Barbieri and M. A. Van Hove, Barbieri/Van Hove SATLEED package, available from M. A. Van Hove.
- J. B. Pendry, J. Phys. C: Solid State Phys., 1980, 13, 937–944 CrossRef CAS
.
-
W. Press, B. Flannery, S. Teukolsky and W. Vetterling, Numerical Recipes in FORTRAN 77: The Art of Scientific Computing, Cambridge University press, Cambridge, 1992 Search PubMed
.
- H. Edwards, Spectrochim. Acta, Part A, 1990, 46, 97–106 CrossRef
.
-
W. Pies and A. Weiss, Landolt-Börnstein Vol. III/7a: Crystal Structure Data of Inorganic Compounds: Halides and Complex Halides, Springer, 1973 Search PubMed
.
- P. Giannozzi, O. Baseggio, P. Bonfà, D. Brunato, R. Car, I. Carnimeo, C. Cavazzoni, S. de Gironcoli, P. Delugas, F. Ferrari Ruffino, A. Ferretti, N. Marzari, I. Timrov, A. Urru and S. Baroni, J. Chem. Phys., 2020, 152, 154105 CrossRef CAS PubMed
.
- P. Giannozzi, O. Andreussi, T. Brumme, O. Bunau, M. B. Nardelli, M. Calandra, R. Car, C. Cavazzoni, D. Ceresoli, M. Cococcioni, N. Colonna, I. Carnimeo, A. D. Corso, S. de Gironcoli, P. Delugas, R. A. DiStasio, A. Ferretti, A. Floris, G. Fratesi, G. Fugallo, R. Gebauer, U. Gerstmann, F. Giustino, T. Gorni, J. Jia, M. Kawamura, H.-Y. Ko, A. Kokalj, E. Küçükbenli, M. Lazzeri, M. Marsili, N. Marzari, F. Mauri, N. L. Nguyen, H.-V. Nguyen, A. O. de-la Roza, L. Paulatto, S. Poncé, D. Rocca, R. Sabatini, B. Santra, M. Schlipf, A. P. Seitsonen, A. Smogunov, I. Timrov, T. Thonhauser, P. Umari, N. Vast, X. Wu and S. Baroni, J. Phys.: Condens. Matter, 2017, 29, 465901 CrossRef CAS PubMed
.
- P. Giannozzi, S. Baroni, N. Bonini, M. Calandra, R. Car, C. Cavazzoni, D. Ceresoli, G. L. Chiarotti, M. Cococcioni, I. Dabo, A. D. Corso, S. de Gironcoli, S. Fabris, G. Fratesi, R. Gebauer, U. Gerstmann, C. Gougoussis, A. Kokalj, M. Lazzeri, L. Martin-Samos, N. Marzari, F. Mauri, R. Mazzarello, S. Paolini, A. Pasquarello, L. Paulatto, C. Sbraccia, S. Scandolo, G. Sclauzero, A. P. Seitsonen, A. Smogunov, P. Umari and R. M. Wentzcovitch, J. Phys.: Condens. Matter, 2009, 21, 395502 CrossRef PubMed
.
- H. J. Monkhorst and J. D. Pack, Phys. Rev. B: Condens. Matter Mater. Phys., 1976, 13, 5188–5192 CrossRef
.
- A. Dal Corso, Comput. Mater. Sci., 2014, 95, 337–350 CrossRef CAS
.
- S. Grimme, J. Comput. Chem., 2006, 27, 1787–1799 CrossRef CAS PubMed
.
- S. Grimme, J. Antony, S. Ehrlich and H. Krieg, J. Chem. Phys., 2010, 132, 154104 CrossRef PubMed
.
- D. Loffreda, Surf. Sci., 2006, 600, 2103–2112 CrossRef CAS
.
- A. Lakhlifi and C. Girardet, Surf. Sci., 1991, 241, 400–415 CrossRef CAS
.
- S. K. Dunn and G. E. Ewing, J. Phys. Chem., 1992, 96, 5284–5290 CrossRef CAS
.
- M. K. Rana, H. S. Koh, J. Hwang and D. J. Siegel, J. Phys. Chem. C, 2012, 116, 16957–16968 CrossRef CAS
.
- J. Vogt, Phys. Rev. B: Condens. Matter Mater. Phys., 2007, 75, 125423 CrossRef
.
- J. Vogt and B. Vogt, J. Chem. Phys., 2014, 141, 214708 CrossRef PubMed
.
- V. Fritzsche, Phys. Rev. B: Condens. Matter Mater. Phys., 1994, 50, 1922–1928 CrossRef CAS PubMed
.
Footnotes |
| † Dedicated to Prof. Giorgio Benedek on the occasion of his 80th birthday. |
| ‡ An exception is the LEED structure analysis of the system H2 O-p(3× 2)/MgO(100) with an assumed number of six molecules per unit cell presented in ref. 6. Due to the neglect of hydrogen in electron-scattering, in this case, only oxygen atomic positions and no molecular orientation could be determined. |
| This journal is © the Owner Societies 2022 |

