
 Open Access Article
 This Open Access Article is licensed under a Creative Commons Attribution-Non Commercial 3.0 Unported Licence
On line kinetic analysis of permeation profiles for UV filter loaded microemulsions using an automatic system with spectroscopic detection and a chemometric approach†
Danielle Silva do Nascimento‡
,
Verónica Volpe‡,
Matías Insausti and
Marcos Grünhut *
*
INQUISUR (UNS-CONICET), Department of Chemistry, Universidad Nacional del Sur, Av. Alem 1253, Bahía Blanca, B8000CPB, Argentina. E-mail: mgrunhut@uns.edu.ar
First published on 26th April 2021
Abstract
The analysis of the permeation kinetics of new UV filter formulations is of great importance since the kinetic parameters are related to the effectiveness of the product over time. The dynamics of this process can be evaluated by means of the calculation of the permeation kinetic constants, which can be obtained from the respective permeation profiles. This paper is aimed at improving the analytical performance of permeation assays using an on-line automatic system with spectrometric detection avoiding the chromatographic procedure and the usually manual sampling steps required using the traditional Franz diffusion cell. Then, the kinetics of permeation of octyl p-methoxycinnamate loaded in different microemulsions through a synthetic membrane (polyamide) was analysed at real time by UV-Vis and fluorescence spectroscopies. The spectral data were obtained at regular intervals of time (5 min) during 60 min, and the concentration of the permeated UV-filter was at each time calculated using univariate linear calibration. The interference caused by the presence of basil essential oil (oily phase) in some microemulsion samples was overcome using synchronous fluorescence spectroscopy (Δλ = 60 nm) and partial least squares. In all cases, the permeation profiles were obtained (first-order kinetics) and the respective permeation kinetic constants were calculated. The validation of the proposed method was assessed by gas chromatographic-mass spectroscopy and non-significant differences for the obtained permeation kinetic constants were found between methods (p = 0.05). Additionally, a commercial sample was analysed with the proposed methods and the results were validated by high performance liquid chromatography technique.
Introduction
UV filters are incorporated in sunscreens in order to protect the skin from damage caused by UV radiation.1,2 These formulations are usually applied superficially to large skin areas. Therefore, the effectiveness of the filters relies on the level of adhesion of the preparations on the skin3,4 and the subsequent permeation of the protective film.5 Octyl p-methoxycinnamate (OMC) is a UV-B filter (290–320 nm) widely used in personal care products and represents one of the most common liposoluble absorbers incorporated in sunscreen formulations.6,7 The behaviour of OMC in different formulations has been well studied due to the fact that a photoisomerization processes can occur and affect the UV-B filtering efficacy of the final product.8 In recent years, colloidal drug carriers including polymeric nanocapsules,9 lipid nanoparticles,10 solid lipid nanoparticles11 and emulsions,12,13 have attracted an increasing interest as potential OMC carriers. In addition, different studies have proposed the microemulsions as a new generation of OMC carriers.14–16Microemulsions (MEs) are used in the pharmaceutical field, since they can be used in dosage systems or as drug release vehicles that can be administered via oral, parenteral or topical.17 ME systems are mixtures composed of surfactant, co-surfactant, water and oil, and are optically isotropic and thermodynamically stable.18,19 MEs have the ability to stabilize lipophilic compounds, as well as achieving a high applicability and bioavailability of the active substances. In case of lipophilic compounds, oil-in-water (o/w) microemulsions are preferred, especially when the active substance is used for topical applications.9,20
In the pharmaceutical and cosmetic field, the in vitro release studies are effectively employed for permeation, release and dissolution testing as part of the quality control of the pharmaceutical formulations.21 Hence, transdermal permeability studies of active substances are performed using the Franz diffusion cell.22–24 Briefly, this cell consists of a donor and an acceptor compartment, which are separated by a membrane. The donor compartment keeps the drug formulation and the acceptor compartment contains the media receptor that emulates the physiological condition of the skin. This solution should be always mixed with a magnetic bar to ensure a uniform diffusion process and homogeneity of concentration. Due to the fact that the diffusion phenomenon depends on the temperature, the cell is kept at constant temperature by means of a thermostated water bath. While the experiment is performed, the samples are taken from the acceptor medium by means of the Franz cell sampling tube and analysed at regular intervals of time. The permeation study is laborious and it involves the control of the temperature, stirring and a series of manual steps. Moreover, when the analysis of the sample is performed by a chromatographic procedure, the method does not provide real-time information since it requires a long time of analysis. Additionally, the use of hazardous organic solvents of high purity is required.
The use of automatic methods with on-line UV-Vis and/or fluorescence detection can be considered an alternative to overcome several of the mentioned problems.25 These systems allow real-time monitoring; provide a higher sampling frequency and the replacement of laborious and tedious manual procedures.14,15 UV-Vis spectroscopy (UVS) and fluorescence spectroscopy (FS) are distinguished techniques since they are fast, simple, cheap, and require little or no pretreatment of samples.26–29 Synchronous fluorescence spectroscopy (SFS) has been successfully applied in the determination of different components in presence of interferences since it allows simultaneous scanning of the excitation and emission wavelengths while maintaining a constant difference between these two wavelengths (Δλ).30 In this way, SFS reduces spectral overlaps narrowing spectral bands and simplifies spectra.31 Moreover, the combined use of chemometrics and SFS is presented as a powerful analytical alternative since it generates accurate calibration models that allow the simultaneous determination of multiple analytes in presence of unknown interferences, even in cases in which the selectivity is poor. In this sense, partial least squares (PLS) is a multivariate calibration technique that performs data decomposition in spectral scores and loadings matrices prior to model building with the aid of these new variables.32 SFS and PLS have been used together in many analytical applications.33,34 However, few reports showing the application of these methods in the study of microemulsion based samples have been published.35
This work aims to propose an on line automated system based on the use of the Franz diffusion cell to obtain the permeation kinetic constants of OMC in lab-synthesised microemulsions and emulsion commercial samples. The use of UVS and FS techniques allowed monitoring the OMC permeation process at real-time through a polyamide membrane, which simulates the skin. Additionally, the SFS technique assisted by PLS allowed obtaining permeation kinetic profiles and permeation kinetic constants in presence of interference signals. The proposed methods were successfully validated by chromatographic techniques.
Experimental section
Materials and software
All reagents were analytical-grade chemicals and ultra-pure water (18 MΩ cm−1) was obtained from a Barnsted® water purification system. Decaethylene glycol mono-dodecyl ether (DME; Sigma-Aldrich®) and ethyl alcohol (ET; Dorwil®) were used as non-ionic surfactant and co-surfactant, respectively. Oleic acid (OA; Applichem®) and Ocimum basilicum essential oil (BEO; Euma®) were used as oily phase and octyl p-methoxycinnamate (OMC; Sigma-Aldrich®) was used as UVB filter.A mixture of distilled water and absolute ethanol (1![[thin space (1/6-em)]](https://www.rsc.org/images/entities/char_2009.gif) :1 v/v) was used as the acceptor solution (AS). Stock solutions of OMC and BEO were prepared by dissolving 0.0600 g of OMC and 0.0600 g of BEO in 10 mL of AS, respectively. Working solutions were prepared by appropriate dilution of stock solution with AS. Whatman® polyamide membranes (PA) were used for tests and presented a pore size of 0.45 μm.
:1 v/v) was used as the acceptor solution (AS). Stock solutions of OMC and BEO were prepared by dissolving 0.0600 g of OMC and 0.0600 g of BEO in 10 mL of AS, respectively. Working solutions were prepared by appropriate dilution of stock solution with AS. Whatman® polyamide membranes (PA) were used for tests and presented a pore size of 0.45 μm.
A commercial emulsion containing OMC (Dermaglós®) was purchased from a local pharmacy (Bahía Blanca, Argentina). The preparation of the sample for subsequent analysis was carried out dissolving 0.5000 g of emulsion in 50 mL of ethanol. Then, 1 mL of this dissolution was diluted up to 50 mL with ethanol.
PLS calculations were performed by means of a lab-made routine written in MatLab® 2010a software. The computer programme used to control the automatic system was developed using the open-source Arduino software (IDE, 1.0.x).
Methods
:1 mixture of DME:ET (surfactant:co-surfactant) named SImix. First, the OMC was incorporated into the oily phase by stirring at 25 °C. Then, this mixture was added to the SImix and titrated with ultra-pure water under moderate magnetic stirring. The obtained final concentrations of DME, ET, OA and OMC in OMC-MEI were: 21.9, 7.3, 1.5 and 5.0% (w/w), respectively.:1 mixture of DME:ET (surfactant:co-surfactant) named SIImix. Briefly, the OMC was incorporated into the oily phase by stirring at 25 °C and this mixture was added to the SIImix and titrated with ultra-pure water under moderate magnetic stirring. The obtained final concentrations of DME, ET, BEO and OMC in OMC-MEII were: 19.3, 9.7, 6.0 and 1.5% (w/w), respectively. | ||
| Fig. 1 Automatic continuous flow system coupled to a Franz diffusion cell for in vitro permeation study with on-line spectrometric detection. AC: Arduino circuit board; AS: acceptor solution (water:ethanol (1:1 v/v)); D: detector (UV: 340 nm, fluorescence: 390 nm, synchronous fluorescence: Δλ = 60 nm; 370–690 nm); FC: Franz diffusion cell; MS: magnetic stirrer (300 rpm); PA: polyamide membrane (3.14 cm2); PP: peristaltic pump (13 rpm); S: sample (0.1000 g); W: waste; WB: water bath (32.0 °C). The arrows indicate the direction of fluids (0.25 mL min−1). The whole permeation analysis lasted 60 min and sampling was performed every 5 min intervals. | ||
Data acquisition
In the case of SFS, the slit width was 3 nm for excitation and 5 nm for emission. The fluorescence spectra of the samples were recorded within the range of 370–690 nm and keeping a fixed Δλ (difference between excitation and emission wavelength) of 60 nm. The scan rate was 2000 nm min−1 and the photomultiplier tube voltage operated at 550 V. The acquisition interval and integration time were fixed at 0.5 nm and 0.5 s, respectively. Therefore, each spectrum presented 641 values of fluorescence intensity.
 | (1) |
 | (2) |
 | (3) |
| LODk = 3.3δrbk | (4) |
Under these conditions, the retention time (tR) of OMC was 17.4 min. The fragments of the analyte were monitored by selecting the ion monitoring mode (SIM). Thereby, the ions (m/z) used in the analysis of the compound of interest were 290, 178 and 161. The calibration of the method was carried out by preparing a series of OMC standard solutions of concentrations in the range of 6.0–48.0 mg L−1.
:15 (v/v) ratio. In addition, isocratic mode was used and the injected sample volume was 20 μL. An external calibration curve was constructed using standard solutions of OMC in the range of 6.0–60.0 mg L−1. The peak area obtained for a retention time of 16.0 min was employed for the OMC quantification.Results and discussion
Obtention and characterization of OMC-MEs
The prepared o/w microemulsions resulted in homogeneous and transparent systems which allowed the solubilization of a non-polar substance as OMC in their oily phase.19 In Table 1 the composition of OMC-MEI and OMC-MEII samples and the parameters obtained by DLS technique are shown. In both cases, Z values indicate a droplet size in nanometric scale37 and the PDI values demonstrating that the obtained microemulsions tend to approach monodisperse systems and become stable systems due to the uniformity in the drops.38 Additionally, the particle size distribution histogram obtained through DLS measurements on the OMC loaded o/w microemulsions is shown in Fig. S2.† On the other hand, the conductivity values of OMC-MEI and OMC-MEII were in the range of 0.045 to 0.116 mS cm−1 showing that all the obtained microemulsions were oil in water type. The refractive index measured values were in the range of 1.35 and 1.37, which indicates that the obtained microemulsions were isotropic systems. Regarding the pH, both OMC-MEI and OMC-MEII samples presented values that indicate that they are suitable for topical use. Additionally, the microemulsions were stable during the storage and along the analysis (20–35 °C).| Smix (%) | OA (%) | BEO (%) | Water (%) | OMC (%) | |
|---|---|---|---|---|---|
| OMC-MEI | 29.2 | 1.5 | — | 64.3 | 5.0 |
| OMC-MEII | 29.0 | — | 6.0 | 63.5 | 1.5 |
| Z (nm) | PdI | C (mS cm−1) | pH | IR | |
|---|---|---|---|---|---|
| OMC-MEI | 11.91 ± 0.09 | 0.191 ± 0.029 | 0.116 ± 0.020 | 5.72 ± 0.04 | 1.35 ± 0.02 |
| OMC-MEII | 12.60 ± 0.10 | 0.389 ± 0.042 | 0.045 ± 0.003 | 4.91 ± 0.03 | 1.37 ± 0.01 |
Permeation study
The permeation process of OMC in the case of the synthetized microemulsions (OMC-MEI and OMC-MEII) was optimized and evaluated at real time using the proposed automatic system with spectrometric detection (UV and/or fluorescence). For that purpose, different methods to quantify OMC in the analysed samples were developed and the concentration profiles were obtained. Finally, the kinetic constants corresponding to the permeation process were calculated for each formulation and the dynamics of diffusion was then discussed. Additionally, a commercial sample containing OMC was analysed. The proposed methods were validated by GC-MS and HPLC techniques.Experimental conditions
As mentioned before, in Franz's cell the donor compartment maintains the formulation and the acceptor compartment contains the AS. OMC is a hydrophobic compound (logP = 5.96) insoluble in water (<0.1 g/100 mL at 27 °C). However, OMC is miscible in alcohols, propylene glycol, and various oils. For this reason, a 1:1 (v/v) mixture of distilled water and absolute ethanol was chosen as the acceptor fluid in the study because of the high solubility of OMC in ethanol. On the other hand, the membrane that separates both compartments (donor and acceptor) should behave in a similar way to skin, allowing the active compound to diffuse to the acceptor medium. A previous report showed that polyamide membranes can be adequate for lipophilic compounds due to the fact that they offer minimal rate-limiting effects and present an adequate size exclusion pore, allowing only net translocation of the interest compound from the formulation into the receptor compartment.39 Therefore, these synthetic membranes can be seen as an alternative to human or animal skin when evaluating OMC topical permeation, reducing cost and time.
Regarding the temperature, it is known that the diffusion phenomenon depends on this variable. In our case, the analysis was performed at 32 °C, a normal value for human skin.40 Moreover, uniformity and homogeneity of AS during the permeation process were achieved by stirring.
On-line automatic system
The permeation process of OMC in the analysed samples was monitored using the automatic system described in the section: on-line automatic system for in vitro permeation study. The hydrodynamic variables of the system were optimized. The flow rate was studied between 0.10 and 0.40 mL min−1 and the optimal value was 0.25 mL min−1. This rate allowed the register of the UV and fluorescence spectra at the required time intervals (5 min) since it only took 24 s to aspirate 100 μL of sample. The same flow rate (0.25 mL min−1) was used to recover with AS the volume of sample (100 μL) thrown towards the detector at each sampling time. This step was performed simultaneously to the aspiration of the sample in a way that the total volume of AS in the Franz's cell remained constant. The components of the on-line system (peristaltic pump, water bath, magnetic stirrer and detectors) were fully commanded by Arduino which is an open-source electronics platform based on easy-to-use hardware and software. The proposed system offers advantages compared to the traditional batch procedure such as automatic sampling, temperature control, stirring and on-line signal detection allowing the real time monitoring of the permeation process. These features contribute to decrease the possible risks of human errors and shorten the time of analysis in comparison to manual sampling and chromatographic determination frequently used for this kind of analysis.Spectrometric detection
 | ||
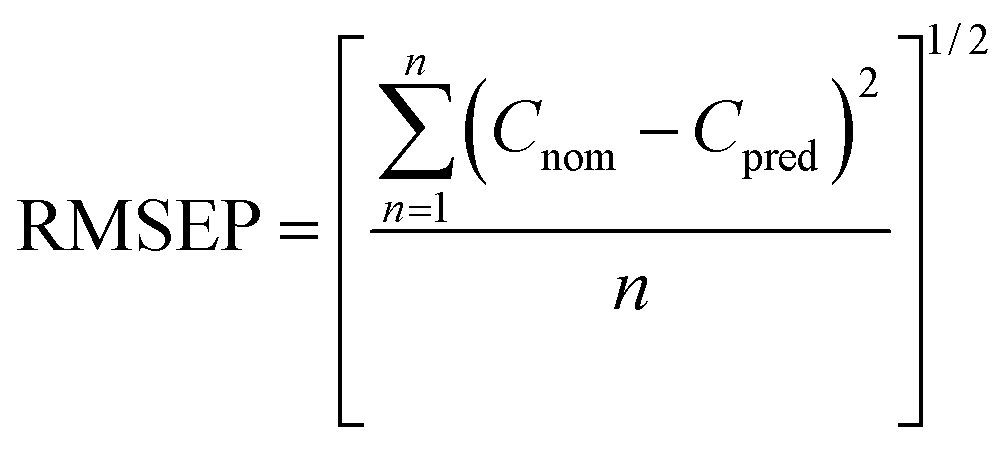
| Fig. 2 (a) UV absorption spectra of a 1.5% (w/w) OA standard solution (black solid line) and a 5.0% (w/w) OMC standard solution (blue dotted line). The calibration curve for OMC at 340 nm and in the concentration range of 6.0–60.0 mg L−1 is also shown. (b) UV absorption spectra of a 6.0% (w/w) BEO standard solution (black solid line) and a 1.5% (w/w) OMC standard solution (blue dotted line). | ||
 | ||
| Fig. 3 Fluorescence spectrum corresponding to a standard solution of OMC (30 mg L−1). The characteristic maximum of signal at 390 nm and the calibration curve in the concentration range of 6.0–36.0 mg L−1 are shown. It is important to note that OA is not fluorescent around 390 nm. | ||
Regarding the OMC-MEII formulation, the oily phase (BEO) generated interference in the OMC fluorescence spectra. At first, the resolution of the OMC and BEO bands was improved applying SFS. The registered fluorescence spectra as a function of permeation time corresponding to the central point of the experimental design are shown in Fig. 4a. It can be observed that the emission band between 370 and 420 nm corresponds to OMC while the band between 570 and 650 nm corresponds to BEO.
 | ||
| Fig. 4 (a) Synchronous fluorescence spectra (370–690 nm) corresponding to the central point of the experimental design registered as function of the permeation time (60 min). The emission band between 370 and 420 nm corresponds to OMC while the band between 570 and 650 nm corresponds to BEO. (b) First latent variable for PLS models corresponding to OMC (orange solid line) and BEO (blue dotted line). | ||
However, the spectral analysis of mixtures with a high BEO:OMC ratio showed that the fluorescence signal intensities corresponding to OMC band can be affected in presence of BEO. To overcome this problem, PLS algorithm was applied to the spectral data corresponding to the proposed experimental design. In Fig. 4b the first latent variable calculated is shown and it corroborates the interference in the fluorescence signals between BEO and OMC. In this way, PLS algorithm allowed obtaining calibration models for both BEO and OMC. In the case of BEO calibration only two new variables were required to explain 98.4% of variance. In the case of OMC calibration, three latent variables were necessary to explain 97.5% of the variance. The need for a higher number of variables to obtain a good prediction can be explained due to the fact that the BEO signal is more intense than the one corresponding to OMC, consequently it was more difficult to explain the interaction between each other. The analytical performance for BEO and OMC calibration models is shown in Table 2. Optimal predictions were reached for both models, obtaining a low REP and an acceptable determination coefficient (R2) in each case. Moreover, the LOD and LOQ values were optimal taking into account the expected concentrations at each sampling time during the permeation process. Hence, a PLS model was used to predict the concentration of OMC at different permeation times from SFS data obtained with the proposed automatic method.
| OMC | BEO | ||
|---|---|---|---|
| PLS models | Spectral range (nm) | 370–650 | |
| Concentration range (mg L−1) | 6.0–60.0 | 24.0–240.0 | |
| Latent variables | 3 | 2 | |
| RMSEP (mg L−1) | 3.52 | 17.90 | |
| REP (%) | 6.51 | 8.30 | |
| R2 | 0.975 | 0.959 | |
| LOD (mg L−1) | 1.31 | 2.79 | |
| LOQ (mg L−1) | 3.97 | 8.48 | |
| SEN (L mg−1) | 1.98 | 4.12 | |
| Kinetic models | R2 (zero-order kinetics) | 0.952 | 0.966 |
| Kp (cm min−1) | 2.98 × 10⁻⁴ ± 5.33 × 10⁻⁵ | 4.82 × 10⁻⁴ ± 4.06 × 10⁻⁵ | |
Obtention of permeation profiles
The spectrometric methods allowed calculating the different values of concentrations of OMC in the AS throughout the permeation process and afterwards the obtention of the respective permeation profiles. These profiles are curves that represent how the concentration of an active substance diluted in the receptor medium varies as a function of the permeation time after passing through a membrane. In Fig. 5a and b the permeation profiles corresponding to OMC-MEI and OMC-MEII formulations are shown, respectively. In the first case, three permeation profiles were obtained since UV-Vis, fluorescence and GC-MS methods were used for the quantification of OMC during the permeation process. In the case of OMC-MEII formulation, two permeation profiles were obtained, since SFS and GC-MS quantification methods were applied. It can be observed, the formulations exhibited an increase in OMC permeation up to 60 min followed by a constant permeability through the membrane. In Table S4† the fitting functions for the different permeation profiles and their respective R2 values are shown. In all cases, these results indicate that the permeation of OMC follows zero-order kinetics.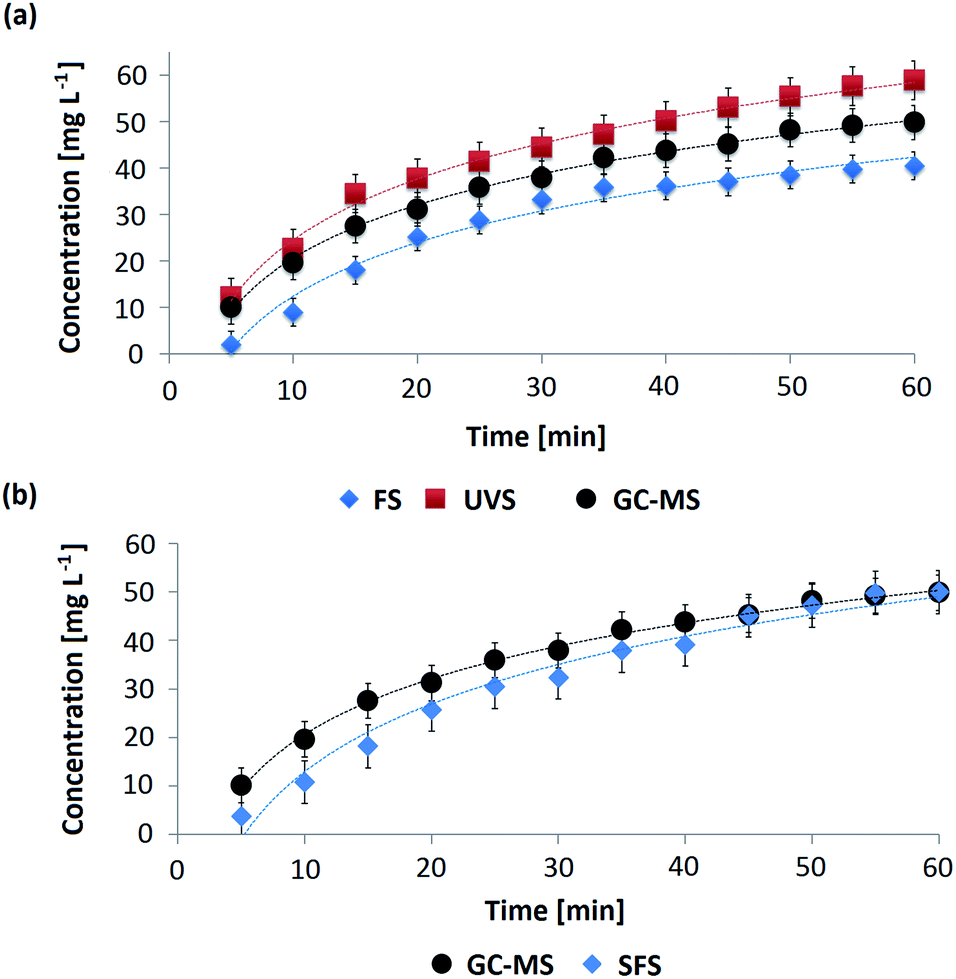 | ||
| Fig. 5 Permeation profiles for OMC in the o/w microemulsions obtained using the proposed methodology and the reference method. (a) OMC permeation profiles corresponding to OMC-MEI obtained by UVS (red squares), FS (blue diamond) and GC-MS (black circle) methods. (b) OMC permeation profiles corresponding to OMC-MEII obtained by SFS (blue diamond) and GC-MS (black circle) methods. The experiments were performed in triplicate. | ||
Kinetic constants calculation
Considering that OMC followed zero-order kinetics in both OMC-MEI and OMC-MEII formulations, the calculation of the permeability kinetic constants (Kp) could be carried out using the eqn (5):
 | (5) |
| OMC-MEII | UVS | SFS | GC-MS |
|---|---|---|---|
| Kp (cm min−1) | — | 2.98 × 10⁻⁴ ± 5.33 × 10⁻⁵ | 2.07 × 10⁻⁴ ± 1.47 × 10⁻⁵ |
| tcalculated | — | 3.12 | — |
| tcriticala | 3.18 | ||
It is important to note that the kinetics of permeation depends on the affinity of the active substance for the components of the formulation. In this sense, a greater release of the active is expected when there is less affinity of the compound for the oily phase. Due to the lipophilic nature of OMC and its high affinity for OA and BEO (oily phases) a relatively slow permeation rate of the active sunscreen would be expected. This fact was corroborated analysing a sample of OMC in an oil-free medium (ethanol:water in a 1:1 (v/v) ratio). In this case, the obtained Kp was 5.83 × 10⁻⁴ cm min−1 corroborating that the oily components of the microemulsions systems contributed to decrease the permeation rate of OMC. Thus, the analysed formulations (OMC-MEI and OMC-MEII) could help to provide a sustained photoprotection for the skin. However, the permeation rate of OMC in the case of OMC-MEI was lower than the one corresponding to OMC-MEII showing that the tested formulation with OA as internal phase presents a retention effect of OMC for a longer time since a higher affinity for the polyamide membrane occurs.
Since the concentration of BEO could be obtained from SFS data assisted by PLS algorithm, the kinetic permeation constant for BEO was also calculated (4.82 × 10⁻⁴ cm min−1). It can be observed, that BEO presented a higher permeation rate with respect to OMC. This information is very useful considering the potential repellent and anti-inflammatory properties that presents the BEO in the OMC-MEII formulation and as previously described by the authors.15
Application of the methods in the analysis of a commercial sample
The developed methods based on UV and fluorescence detection were applied in the permeation analysis of a commercial emulsion sample. The obtained Kp values of OMC were compared with the Kp values obtained with the chromatographic method used as reference (in this case, HPLC) and the results are shown in Table 4. Based on the t-test results, there are no statistically significant differences between the Kp values obtained by both UVS and FS methods with respect to the obtained by HPLC method (α = 0.05; n = 3). Moreover, it is important to note that the Kp value of the commercial sample is comparable to the obtained for the laboratory synthesised samples (OMC-MEI and OMC-MEII).Comparison and advantages of the proposed on-line automatic system
Table 5 shows different methods proposed to date in the literature for permeation analysis using the Franz diffusion cell. Recently, Alves et al.42 proposed an automatic method based on flow injection analysis (FIA) for the evaluation of lipid nanoparticles transdermal permeation. However, this method evaluated only caffeine (CF) and it used a chromatographic procedure as a separation technique. Previously, Klimundová et al.43 presented a sequential injection analysis (SIA) system for the permeation study of salicylic acid (SA) in a commercial topical formulation. Although fluorescence detection was used, the permeation of one active substance (SA) in different ointments was addressed. Furthermore, different in vitro permeation studies have been carried out for OMC in systems such as o/w emulsions, w/o emulsions, nanocapsules and liposomes. Nevertheless, the automation of the methods was not addressed. Some methods involved HPLC as a separation technique for OMC determination5,11,42 involving the use of organic solvents during the procedure. In the case of Mota et al.,44 the proposed method did not require a separation technique and OMC permeation was monitored by UV spectrophotometry. It can be concluded that the methods proposed in this work offer the inherent advantages of automation and the use of simple and economic detection techniques as UVS and FS. Moreover, a simple data treatment allowed monitoring two species during the permeation process (OMC and BEO) simultaneously. Moreover, it is important to note that the proposed method is in accordance with several principles of green analytical chemistry.45 In this sense, no organic solvent was used during the determination process and low amounts of waste were generated. Furthermore, the automated method applied reduces human exposure to substances and makes the analytical operation less dependent on the operator.| Method | Separation technique | Detection technique | Sample | Automation | Analytes | Membrane | Receptor medium | Solvent |
|---|---|---|---|---|---|---|---|---|
| a UVS: UV-Vis spectroscopy; FS: fluorescence spectroscopy; SFS: synchronous fluorescence spectroscopy; FIA: flow injection analysis; SIA: sequential injection analysis; CFS: continuous flow system; PLS: partial least squares; CF: caffeine; SA: salicylic acid; OMC: octyl p-methoxycinnamate; BMBM: butyl-methoxy-di-benzoyl-methane; BEO: basil essential oil; BPS: buffer phosphate solution; ET: ethanol; ACN: acetonitrile. | ||||||||
| 5 | HPLC | UVS (310 and 360 nm) | o/w emulsion w/o emulsion | No | OMC BMBM | Cellulose | ET:water (50:50 v/v) |
ACN:water (80:20 v/v) |
| 11 | HPLC | UVS (310 nm) | o/w emulsion w/o emulsion nanocapsules | No | OMC | Pig skin | BPS/NaCl 120 mM, KCl 2.7 mM, Oramix® 4.0% | ACN:water (85:15 v/v) |
| 42 | HPLC | UVS (273 nm) | Lipid nanoparticles | FIA | CF | Pig skin | Hepes buffer | ACN:water (10:90 v/v) |
| 43 | No | FS (405 nm) | w/o emulsion | SIA | SA | Polycarbonate | BPS | Not used |
| 44 | No | UVS (310 nm) | Liposomes | No | OMC | Cellulose acetate | BPS Polisorbate 80:ET (70:30 v/v) |
Not used |
| This work | No | UVS (340 nm) | o/w microemulsion | CFS | OMC | Polyamide | ET:water (50:50 v/v) |
Not used |
| No | FS (390 nm) | o/w microemulsion | CFS | OMC | Polyamide | ET:water (50:50 v/v) |
Not used | |
| PLS | SFS (370-690 nm) | o/w microemulsion | CFS | OMC BEO | Polyamide | ET:water (50:50 v/v) |
Not used | |
Conclusions
The proposed on-line methodology with UV and fluorescence detection allowed monitoring at real time the in vitro permeation process of the UV filter OMC loaded in o/w microemulsion samples. A highlight of this work was that the interference caused by the oily phase (BEO) in some samples could be overcome using synchronous fluorescence spectroscopy and partial least squares algorithm. In all cases, the permeation process followed zero-order kinetics and the permeation kinetic constants (Kp) for OMC and BEO could be obtained. The Kp values indicated that the OMC loaded in o/w microemulsions presented a lower permeability than the OMC in an oil-free medium. This result suggests that these formulations could promote a more effective action against UV radiation by remaining on the applied area for a longer period of time. Moreover, the Kp values for the synthetized microemulsions were comparable to the ones obtained for a commercial emulsion sample and were statistically comparable to those obtained by chromatographic procedures (GC-MS and HPLC). The proposed on-line methodology allowed obtaining real-time information, and it was environmental friendly and inexpensive since an automatic flow system coupled to spectroscopic detection techniques was employed avoiding manually sampling, organic solvents and separation techniques. These advantages suggest that the method can be easily implemented in laboratories and can be extended to the study of the permeation process of other active substances even in the presence of interferences.Conflicts of interest
There are no conflicts to declare.Acknowledgements
The authors gratefully acknowledge the financial support of Consejo Nacional de Investigaciones Científicas y Técnicas (CONICET; PIP 11220120100625), Ministerio de Ciencia y Tecnología (PICT, 201-0659) and Universidad Nacional del Sur (PGI 24Q086).Notes and references
- A. Chisvert, A. Salvador and M. C. Pascual-Martí, Anal. Chim. Acta, 2001, 428, 183–190 CrossRef CAS.
- A. Sharma, A. Kumar, C. Li, R. K. Sharma and M. T. Swihart, RSC Adv., 2020, 10, 34254–34260 RSC.
- S. Songkro, N. L. Lo, N. Tanmanee, D. Maneenuan and P. Boonme, J. Drug Delivery Sci. Technol., 2014, 24, 703–711 CrossRef CAS.
- C. Puglia, F. Bonina, L. Rizza, P. Blasi, A. Schoubben, R. Perrotta, M. S. Tarico and E. Damiani, J. Pharm. Sci., 2012, 101, 301–311 CrossRef CAS PubMed.
- L. Montenegro, R. Turnaturi, C. Parenti and L. Pasquinucci, Pharmaceutics, 2018, 10, 27–40 CrossRef.
- M. Kanlayavattanakul, N. Kasikawatana and N. Lourith, J. Cosmet. Sci., 2016, 67, 167–173 Search PubMed.
- L. R. Gaspar and P. M. B. G. Maia Campos, Int. J. Pharm., 2006, 307, 123–128 CrossRef CAS PubMed.
- C. Couteau, A. Faure, J. Fortin, E. Paparis and L. J. M. Coiffard, J. Pharm. Biomed. Anal., 2007, 44, 270–273 CrossRef CAS PubMed.
- B. I. Olvera-Martínez, J. Cázares-Delgadillo, S. B. Calderilla-Fajardo, R. Villalobos-García, A. Ganem-Quintanar and D. Quintanar-Guerrero, J. Pharm. Sci., 2005, 94, 1552–1559 CrossRef PubMed.
- S. Kale, A. Sonawane, A. Ansari, P. Ghoge and A. Waje, Int. J. Pharm. Pharm. Sci., 2010, 2, 147–149 CAS.
- M. M. Jiménez, J. Pelletier, M. F. Bobin and M. C. Martini, Int. J. Pharm., 2004, 272, 45–55 CrossRef.
- A. F. Sierra, M. L. Garduño Ramírez, A. C. Calpena Campmanya, A. R. Martínez and B. C. Naveros, J. Dermatol. Sci., 2013, 69, 202–214 CrossRef CAS PubMed.
- M. I. R. M. Santoro, D. A. G. C. E. Oliveira, E. R. M. Kedor-Hackmann and A. K. Singh, Int. J. Pharm., 2005, 13, 197–203 Search PubMed.
- D. S. Nascimento, M. Insausti, B. S. F. Band and M. Grünhut, Spectrochim. Acta, Part A, 2018, 191, 277–282 CrossRef CAS.
- V. Volpe, D. S. Nascimento, M. Insausti and M. Grünhut, Colloids Surf., A, 2018, 546, 285–292 CrossRef CAS.
- L. Montenegro, C. Carbone and G. Puglisi, Int. J. Pharm., 2011, 28, 162–168 CrossRef.
- M. Fanun, Curr. Opin. Colloid Interface Sci., 2012, 17, 306–313 CrossRef CAS.
- P. Boonme, Journal of Cosmetic Dermatology, 2008, 6, 223–228 CrossRef PubMed.
- J. Zhang and B. B. Michniak-Kohn, Int. J. Pharm., 2018, 536, 345–352 CrossRef CAS PubMed.
- J. Jiesheng, G. Xiaoqiang, H. Xiang and Z. Rongtang, RSC Adv., 2017, 7, 55360–55363 RSC.
- N. Shiow-Fern, J. J. Rouse, F. D. Sanderson, V. Meidan and G. M. Eccleston, AAPS PharmSciTech, 2010, 11, 1432–1441 CrossRef PubMed.
- L. Montenegro, C. Carbone, G. Condorelli, R. Drago and G. Puglisi, Drug Dev. Ind. Pharm., 2008, 32, 539–548 CrossRef PubMed.
- A. C. V. Mota, N. M. Volpato, Z. M. F. Freitas and E. P. Santos, Rev. Cienc. Farm. Basica Apl., 2008, 29, 285–289 CAS.
- M. Alberti, Y. Dancik, G. Sriram, B. Wu, Y. L. Teo, Z. Feng, M. Bigliardi-Qi, R. G. Wu, Z. P. Wang and P. L. Bigliardi, RSC Adv., 2017, 17, 1625–1634 CAS.
- M. F. Razuc, M. Grünhut, M. Garrido and B. S. F. Band, Anal. Sci., 2014, 30, 1121–1127 CrossRef CAS PubMed.
- R. P. Stokes and B. L. Diffey, J. Photochem. Photobiol., B, 1999, 50, 137–143 CrossRef CAS.
- S. Glavanović, M. Glavanović and V. Tomišić, Spectrochim. Acta, Part A, 2016, 157, 258–264 CrossRef PubMed.
- V. K. Rapalli, S. Gorantla, T. Waghule, S. K. Dubey, M. M. Pandey and G. Singhvi, Spectrochim. Acta, Part A, 2020, 224, 117392–117399 CrossRef CAS PubMed.
- R. Ríos-Reina, S. M. Azcarate, J. Camiña and R. M. Callejón, Food Chem., 2020, 323, 126792 CrossRef PubMed.
- M. Insausti, A. A. Gomes, J. M. Camiña, M. C. U. Araujo and B. S. F. Band, Spectrochim. Acta, Part A, 2017, 175, 185–190 CrossRef CAS PubMed.
- J. R. Lakowicz, Principles of Fluorescence Spectroscopy, Baltimore, Maryland, 3rd edn, 2006 Search PubMed.
- S. Wold, M. Sjöström and L. Eriksson, Chemom. Intell. Lab. Syst., 2001, 28, 109–130 CrossRef.
- S. Rubio, A. Gomez-Hens and M. Valcarcel, Talanta, 1986, 33, 633–640 CrossRef CAS PubMed.
- A. R. Jalalvand, M. Mahmoudia and H. C. Goicoechea, RSC Adv., 2018, 8, 23411–23420 RSC.
- F. Pattarino, E. Marengo, M. R. Gasco and R. Carpignano, Int. J. Pharm., 1993, 91, 157–165 CrossRef CAS.
- C. A. Squier and B. K. Hall, J. Invest. Dermatol., 1985, 84, 176–179 CrossRef CAS PubMed.
- F. Salehi, T. Jamali, G. Kavoosi, S. K. Ardestani and S. N. Vahdati, Int. J. Biol. Macromol., 2020, 164, 3645–3655 CrossRef CAS PubMed.
- K. Kaur, N. K. Bhatia and S. K. Mehta, RSC Adv., 2012, 2, 8467–8477 RSC.
- S. J. Gallagher, L. Trottet, T. P. Carter and C. M. Heard, J. Drug Targeting, 2003, 11, 373–379 CrossRef CAS PubMed.
- T. J. Franz, J. Invest. Dermatol., 1975, 64, 190–195 CrossRef CAS PubMed.
- D. B. Hernández, R. K. Mishra, R. Muñoz and J. L. Marty, Sens. Actuators, B, 2017, 246, 606–614 CrossRef.
- A. C. Alves, I. I. Ramos, C. Nunes, L. M. Magalhães, H. Sklenářová, M. A. Segundo, J. L. F. C. Lima and S. Reis, Talanta, 2016, 146, 369–374 CrossRef CAS PubMed.
- J. Klimundová, K. Mervartová, H. Sklenárová, P. Solich and M. Polásek, Anal. Chim. Acta, 2006, 573, 366–370 CrossRef PubMed.
- A. C. V. Mota, Z. M. F. Freitas, E. R. Júnior, G. M. D. Ortiz, R. Santos-Oliveira, R. A. Ozzetti, A. L. Vergnanini, V. L. Ribeiro, R. S. Silva and E. P. D. Santos, Int. J. Nanomed., 2013, 8, 4689–4701 Search PubMed.
- A. Gałuszka, Z. Migaszewski and J. Namieśnik, Trends Anal. Chem., 2013, 50, 78–84 CrossRef.
Footnotes |
| † Electronic supplementary information (ESI) available. See DOI: 10.1039/d1ra01067k |
| ‡ These authors contributed equally to the work. |
| This journal is © The Royal Society of Chemistry 2021 |