
 Open Access Article
 This Open Access Article is licensed under a Creative Commons Attribution-Non Commercial 3.0 Unported Licence
Nanocarriers used as probes for super-resolution microscopy
Sreejesh
Sreedharan†
 a,
Rajeshwari
Tiwari†
b,
Deepak
Tyde
b,
Stephen O.
Aderinto
c,
Sumit Kumar
Pramanik
*b,
Amitava
Das
*cd and
James A.
Thomas
*a
a,
Rajeshwari
Tiwari†
b,
Deepak
Tyde
b,
Stephen O.
Aderinto
c,
Sumit Kumar
Pramanik
*b,
Amitava
Das
*cd and
James A.
Thomas
*a
aCRUK/MRC Oxford Institute for Radiation Oncology University of Oxford, Oxfordshire, OX3 7DQ, UK
bCSIR-Central Salt and Marine Chemicals Research Institute, Bhavnagar, Gujarat, India. E-mail: sumitpramanik@csmcri.res.in
cDepartment of Chemistry, University of Sheffield, Western Bank, Sheffield, S3 7HF, UK. E-mail: James.thomas@sheffield.ac.uk
dIndian Institute of Science Education and Research, Kolkata, West Bengal, India. E-mail: amitava@iiserkol.ac.in
First published on 10th November 2020
Abstract
Super-resolution microscopy (SRM) has revolutionized the study of cell biology, enabling researchers to visualize cellular structures with nanometric resolution, single-molecule sensitivity, and with multiple colors using conventional fluorophores. SRM is well-suited for volumetric live-cell imaging and helps in extracting quantitative information on spatial distributions. It can be used to estimate the absolute numbers of proteins or other macromolecules or nanostructured material within subcellular compartments, characterize their structures, and their nano/bio interactions. Although a number of recent general reviews on SRM have elaborated its role in chemical and clinical biology, as well as nanomedicine, herein, we provide an overview of the use of luminescent nanocarriers (LNC) in SRM imaging and single-molecule tracking. The role of LNCs in controlling the brightness and stability of emissive states is discussed with a special focus on organelle-specific delivery and how this approach can be utilized to produce novel optical-switched systems. We also discuss the challenges related to the molecular targeting of such material in biological systems. In doing so, we will provide practical guidance for super-resolution imaging in nanomedicine research, its technical challenges, and the opportunities for future advancement.
 Sreejesh Sreedharan | Sreejesh Sreedharan graduated from the University of Sheffield with a PhD in Chemical biology under the supervision of Prof. Jim A Thomas where he developed molecular probes for sub-cellular imaging in live cells using diverse super resolution microscopy techniques. He obtained his doctorate in 2018. He currently works as a post-doctoral research scientist in the research group of Prof. Katherine Vallis at the Department of Oncology, University of Oxford where he is involved in designing multimodal therapeutic imaging probes to track down breast cancer metastases in the lymphatic system. |
 Rajeshwari Tiwari | Rajeshwari Tiwari is a second-year PhD student at CSIR-Central Salt and Marine Chemicals Research Institute (CSMCRI) under the guidance of Dr Amitava Das and Sumit Kumar Pramanik. She obtained her BSc in chemistry from the Institute for Excellence in Higher Education, Bhopal, India, in 2015 and Master's degree in chemistry from the same institute in 2017. Her work focuses on the synthesis of polymeric nanocarriers for the application of targeted drug delivery. |
 Deepak Tyde | Deepak Tayde is a first-year PhD student at CSIR-Central Salt and Marine Chemicals Research Institute (CSMCRI) under the guidance of Dr Amitava Das and Sumit Kumar Pramanik. He obtained his BPharm from the S. G. B. Amrawati university, India, in 2016 and MS (Pharm) from NIPER, Kolkata in 2018. Her work focuses on the synthesis of prodrug molecules for the application of targeted drug delivery. |
 Stephen O. Aderinto | Stephen Aderinto's academic career is a tale of three continents. In 2011, he took his Bachelor's degree in Pure and Applied Chemistry from Ladoke Akintola University of Technology where he graduated with First-class Honours. In 2014, he was awarded a scholarship by the China Scholarship Council (CSC) to pursue a postgraduate master's study in Applied Chemistry at Lanzhou Jiaotong University. In 2018, he took up a doctoral position in Bioinorganic Chemistry at the University of Sheffield where he is working under Prof. Jim Thomas on a multidisciplinary project involving self-assembled systems that interact with biomolecules. |
 Sumit Kumar Pramanik | Sumit Kumar Pramanik is a senior scientist at CSIR-Central Salt and Marine Chemicals Research Institute. He received his Bachelor degree from Vidyasagar University in 2005. He then continued his studies at Bengal Engineering and Science University, Shibpur where he received his Master's in applied chemistry in 2007. In 2013, he received his doctoral degree in chemistry from CSIR-Indian Institute of Chemical Biology, Kolkata. His research interests include the synthesis, self-assembly, colloidal and interfacial properties, and various applications of nanostructured materials in bioimaging, drug delivery, sensing, and optoelectronics. |
 Amitava Das | Amitava graduated from Jadavpur University in Kolkata, India, earning his PhD degree in 1989. Before joining CSIR-CSMCRI in 1992, he pursued his postdoctoral research at Birmingham University and Bristol University in the UK with Prof. Jon A. McCleverty and Prof. M. D. Ward. Amitava continued at CSIR-CSMCRI until 2013, when he moved as the Chief Scientist and Professor-AcSIR to CSIR-National Chemical Laboratory in Pune, India. He moved back to CSIR-CSMCRI in January 2016 as the Director of the institute and Distinguished Professor of AcSIR. After completing his tenure at CSIR-CSMCRI as the Director, he moved as a Professor of Chemistry at Indian Institute of Science Education and Research Kolkata since January 2020. He is the elected fellow of all the three major academies of India. He is also the recipient of the J. C. Bose National Fellowship since 2017. His research interests focus on supramolecular chemistry, photoinduced processes, molecular recognition, biomarkers and bioimaging, and functional nanostructures. |
 James A. Thomas | Jim A Thomas graduated in Chemistry from the University of Reading. After obtaining a PGCE teaching certificate, he was a secondary school teacher for several years; a period that included a two-year contract with the development organisation VSO, teaching in a community school in rural W Kenya. He returned to academia through a PhD at the University of Birmingham with Chris J Jones and Jon A McCleverty and went on to do postdoctoral research with Jean-Marie Lehn in Strasbourg. He first came to Sheffield to work for a year as a postdoc with Chris A Hunter but was then awarded a Royal Society University Research Fellowship. Twenty-five years later he still there. He is interested in molecular and biomolecular recognition, cell probes, therapeutics, theranostics, and dabbles in self-assembly. |
Introduction
Since the seventeenth century, the optical microscope has played a central role in resolving many complex questions in biology.1–5 Countless technological developments and manufacturing breakthroughs have contributed to the development of advanced microscope designs for collecting improved image quality with minimal aberration.3,6,7 As a consequence, optical microscopy has been a powerful and widely used technique for subcellular studies owing to the minimally invasive effects of light either on living cells and tissues in in vivo studies.8–12 However, until recently, this technology relied on discriminating objects through focusing,13,14 and diffraction effects limited the application of such optical microscopy in achieving higher resolution. This phenomenon restricts the ability of conventional optical instruments to differentiate between two objects separated by a lateral distance that is less than the half of the wavelength of light used to image the objects.13,14 In principle, moderately enhanced spatial resolution (along lateral and axial axes by a factor of 1.4) can be achieved through laser scanning confocal microscopy using focused laser excitation and pinhole-restricted detection.15 Nonlinear absorption processes have been adopted to reduce the effective size of the excitation point-spread function, but this approach requires longer wavelength excitation light.16,17 Rather than providing dramatic improvements in resolution, the prime advantage of confocal and multiphoton microscopy over wide-field microscopy is the reduction in background noise by removing it from the focal plane, which aids sharper sectioning in 3D imaging.18,19 However, all these techniques display typical diffraction limits of about 200–300 nm in the lateral direction and 500–700 nm in the axial direction, dimensions that are comparable to or larger than many subcellular structures.19,20 This resolution limit has only be broken through the various SRM techniques discussed herein (Fig. 1).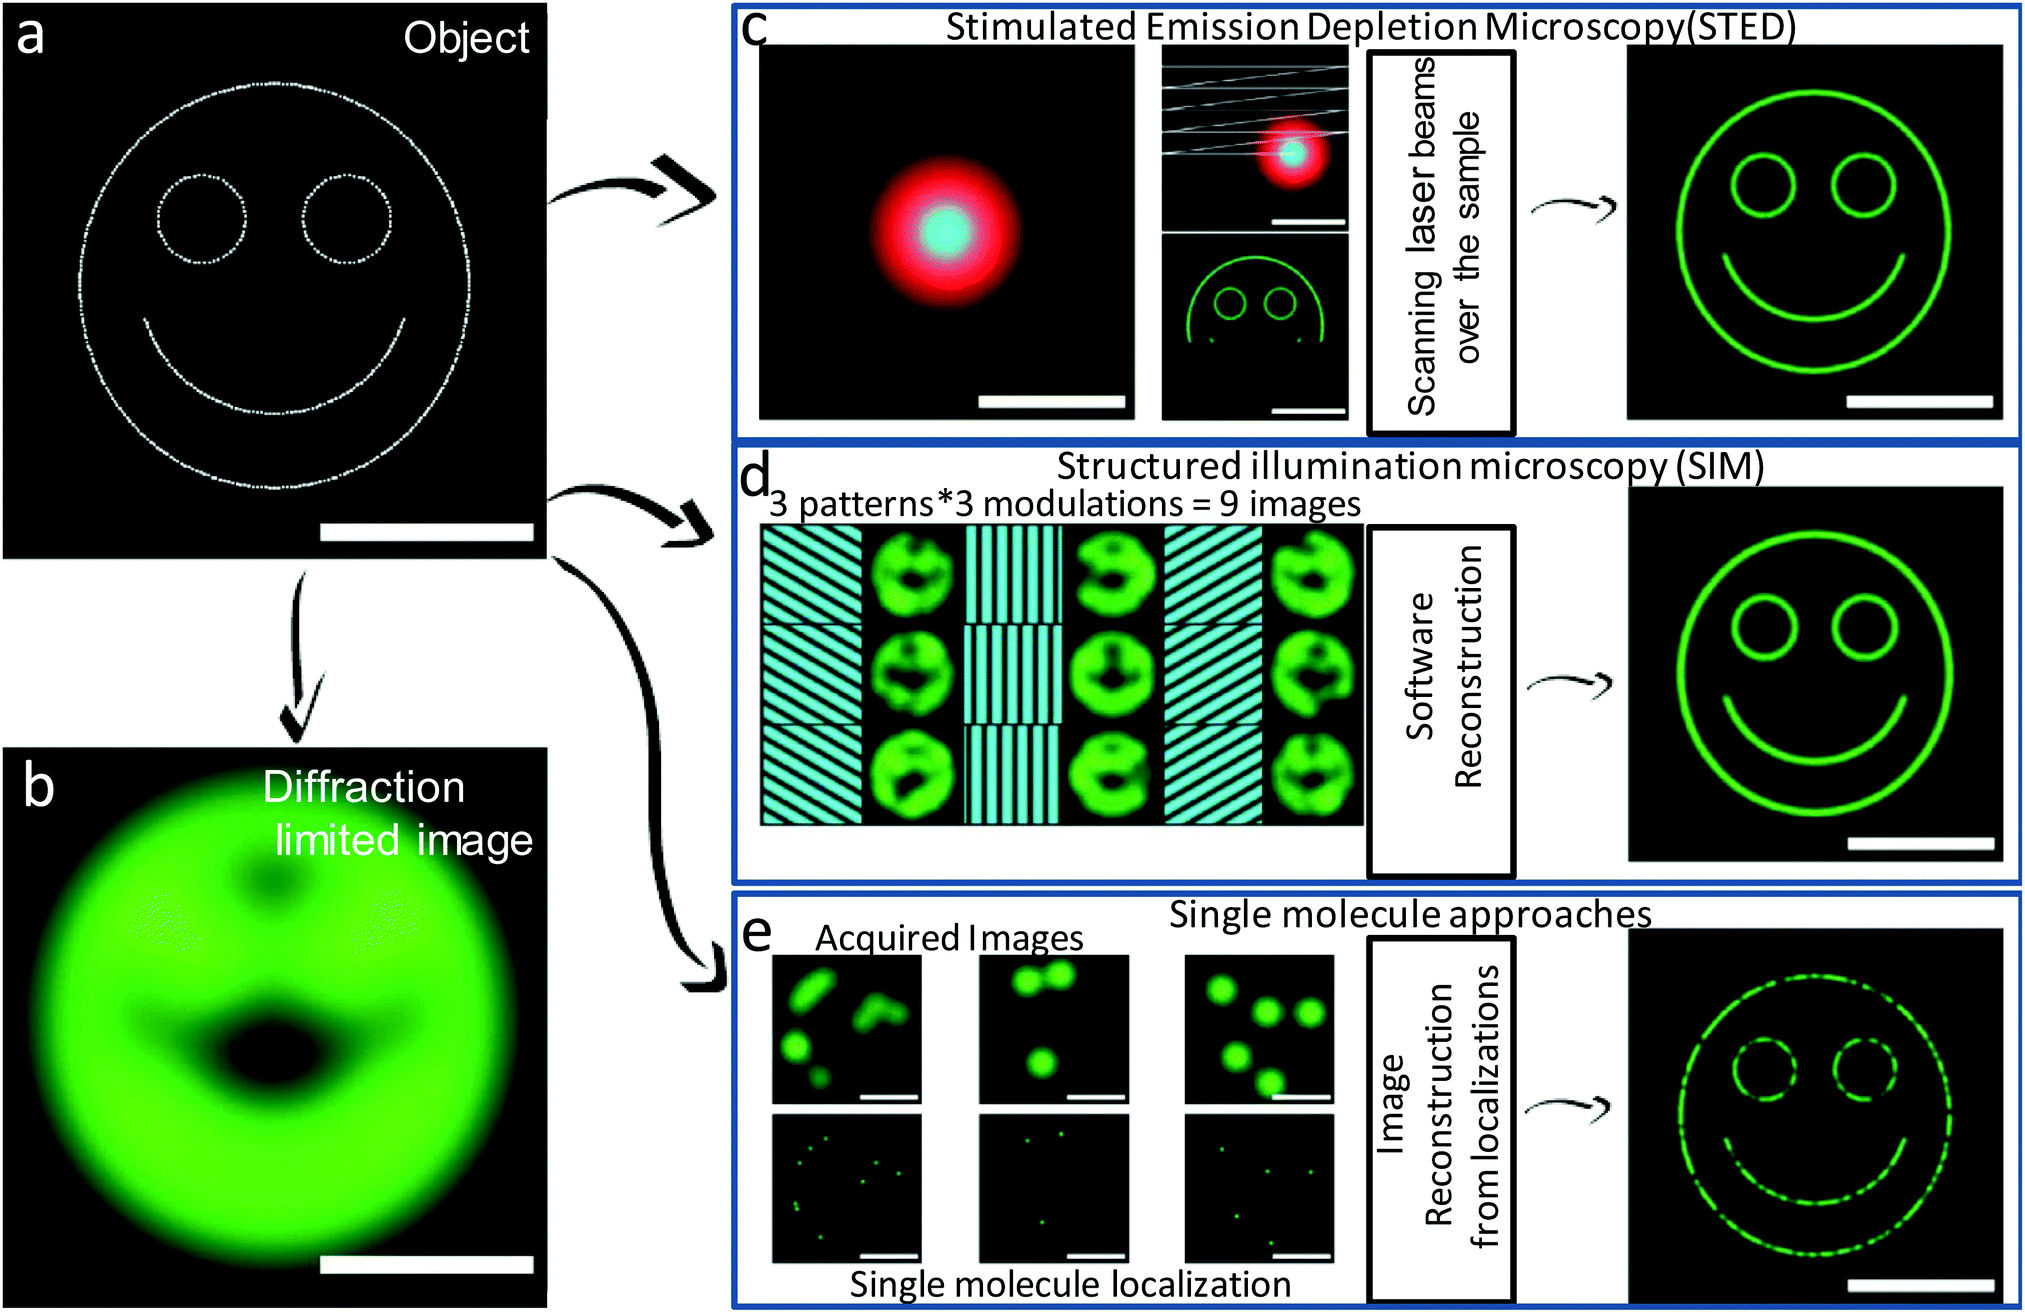 | ||
| Fig. 1 Schematic representation of different super-resolution microscopy approaches. Object to be imaged consists of fluorescent emitters (a) and corresponding diffraction-limited image (b). (c) In STED, a focused excitation beam (cyan) superimposed with a doughnut-shaped depletion beam (red) are scanned over the sample to acquire an image at high resolution (down to ∼50–80 nm in live cells). (d) In SIM, after the necessary software reconstruction, multiple wide-field images are acquired using sinusoidal illumination grid patterns to obtain high-resolution images (down to ∼50–100 nm in live cells using nonlinear saturated illumination). (e) In single-molecule localization microscopy, a large number of wide-field images containing a few isolated single fluorescent emitters are consecutively acquired. A high-resolution image is reconstructed from the localizations of each individual molecule. Resolutions down to ∼50 nm are commonly achieved in live cells. Scale bar represents 1 μm. (a–e) Reproduced with permission.20 Copyright 2014, Elsevier. | ||
One intermediate technique is Structured Illumination Microscopy (SIM) which improves spatial resolution by utilizing a patterned illumination field to a sample.6 However, as the illumination mask is also limited by the diffraction of light, by combining two diffraction-limited sources of information, this technique provides improvements in resolutions restricted to 100 nm and 300 nm in the lateral and axial directions, respectively.3,21
As SIM is still fundamentally limited by diffraction limits any further resolution improvements require sub-diffraction-limit excitation patterns to enable readout at smaller length-scales.21,22 This is addressed in true Super-Resolution Microscopic techniques, which encompass STED, RESOLFT, SOFI, SSIM and single-molecule localization-based methods, such as STORM (Fig. 2).21–31 In the following section we provide a brief overview of these methods.
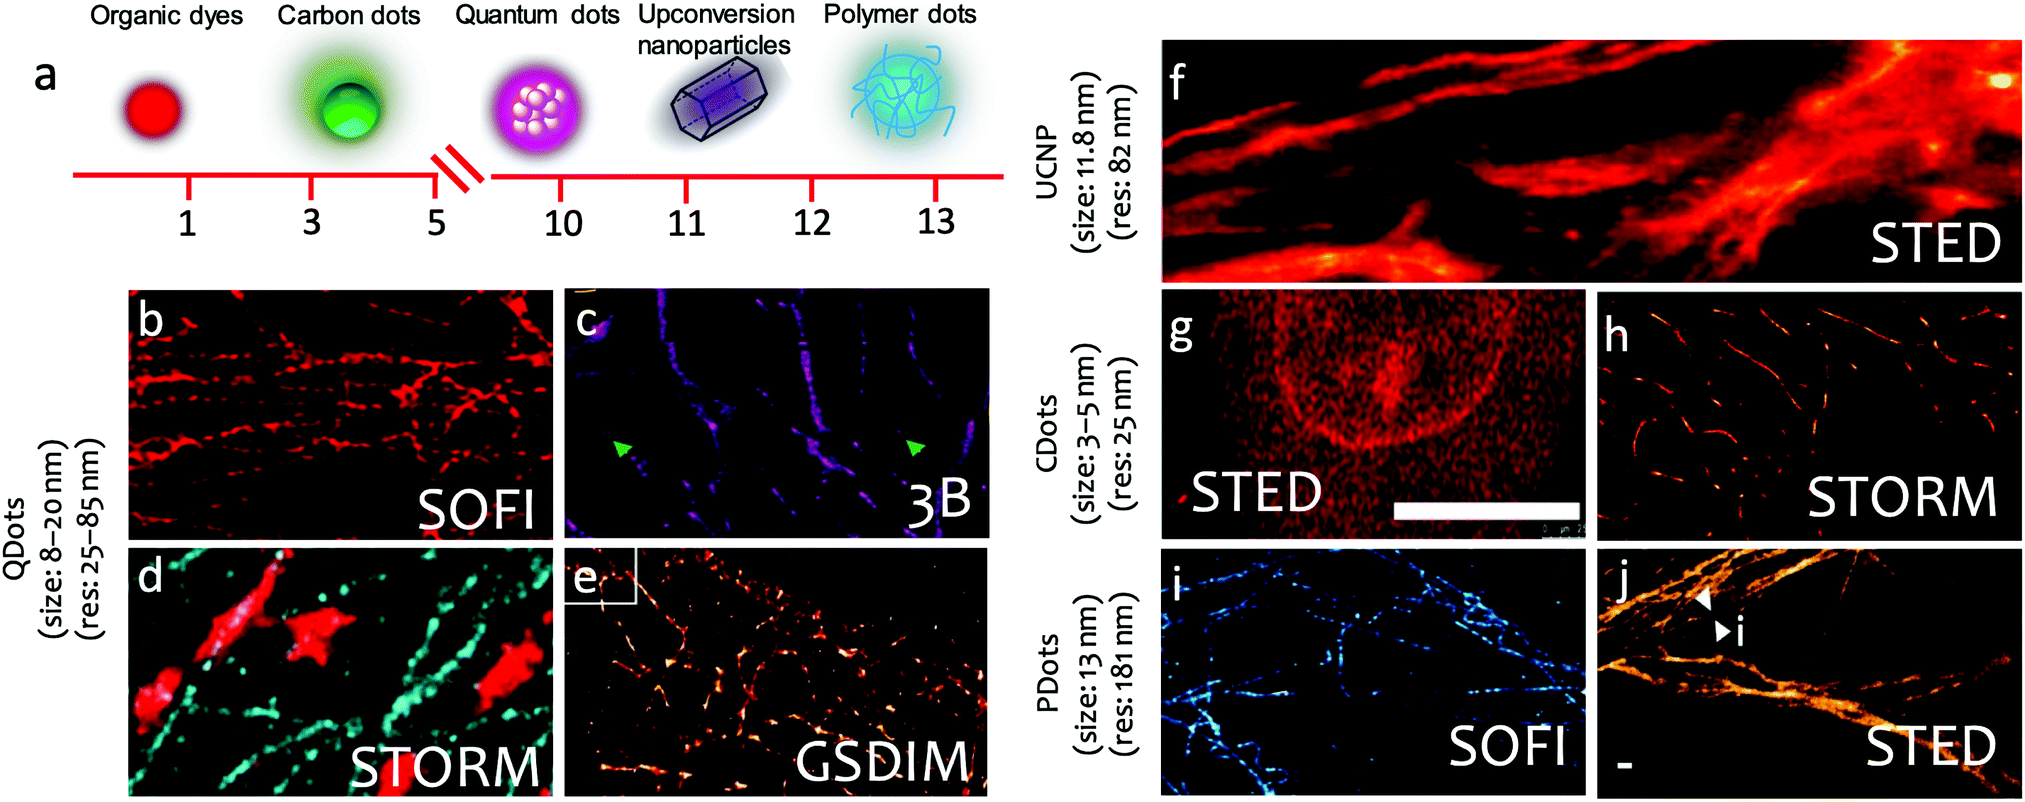 | ||
| Fig. 2 Fluorescent nanoparticles used in super-resolution microscopy imaging. (a) Sketch of the physical dimensions of dye molecules, carbon dots, quantum dots, up conversion nanoparticles, and polymer dots used in super resolution microscopy. (b–e) Quantum dots used in super-resolution imaging. (b) SOFI image of microtubule networks in COS7 cells. (c) 3B nanoscopy image of Microtubule network in HeLa cells. (d) Two-color STORM imaging of microtubules (blue) and mitochondria (red) (e) Ground-state depletion microscopy followed by individual molecule return (GSDIM) image of the microtubule network in mammalian PtK2 cells. (f) UCNPs used in STED imaging of cellular cytoskeleton protein in cancer HeLa cells (g) STED image of A549 cell stained by Carbon Dots. (h) Carbon dots used in STORM imaging of microtubules in HeLa cells. (i) Polymer Dots used in single-color SOFI microscopy imaging of microtubule structure in HeLa cells. (j) STED imaging of the microtubule structures labeled using the Red-AIE nanodots in HeLa cells. (b) Reproduced with permission.23 Copyright 2015, Nature Publishing Group. (c) Reproduced with permission.24 Copyright 2016, American Chemical Society. (d) Reproduced with permission.25 Copyright 2015, American Chemical Society. (e) Reproduced with permission.26 Copyright 2011, American Chemical Society. (f) Reproduced with permission.27 Copyright 2017, Nature Publishing Group. (g) Reproduced with permission.28 Copyright 2019, American Chemical Society. (h) Reproduced with permission.29 Copyright 2017, American Chemical Society. (i) Reproduced with permission.31 Copyright 2017, American Chemical Society. (j) Reproduced with permission.30 Copyright 2017, Wiley-VCH. | ||
Stimulated emission depletion microscopy, STED, which was first experimentally demonstrated in 1994, requires a second laser source to suppress emission, through stimulated emission, from luminophores located off-center of the excitation. For a sharper point spread function (PSF), the second laser, responsible for the generation of stimulated emission, needs to display zero intensity at the center of the excitation laser focus and nonzero intensity at its periphery, which is again limited by the diffraction of light.22 Thus, the effect of STED alone is not sufficient for sub-diffraction-limit imaging. However, using a higher power for the STED laser, it is possible to expand the saturated depletion region without strongly affecting emission at the focal point because the STED laser intensity is minimized at this point. This significantly reduces the effective width of the PSF thus achieving super-resolution imaging. Using specific phase masking, it is possible to generate toroidal STED patterning in the xy plane to achieve xy resolutions of around 30 nm; while an adaption for 4Pi microscopy results in STED-4Pi, producing axial resolution of 30–40 nm.32,33
A range of single-molecule localization methods, SMLM, such as STORM, PALM, and PAINT, have been developed. All SMLM techniques involve a stochastic sampling of optical output from a small subset of luminescent molecules in a sample to facilitate nanometer localization of individual dye molecules. This approach is typified by stochastic optical reconstruction microscopy (STORM); a localization-based microscopy technique that utilizes time-resolved localization and sequential activation of photo-switchable fluorophores resulting in the generation of high-quality super-resolution images.1,22
This technique depends on a small number of molecules being switched on at any time after excitation, although all of the probes in the sample will eventually be recorded. Stochastic techniques produce images with spatial resolutions of ~30 nm.1,34 STORM relies on dye “blinking” caused by stochastic switching of fluorophores from an excited state into a dark/triplet state or through photobleaching which can be enhanced by reducing buffers, whereas photo switchable or photoconvertible fluorophores are used in PALM. Unlike PALM, which usually employs fluorescent proteins, STORM probes are typically small fluorescent molecules. In both techniques, superior localization accuracy is an essential criterion for generating an ideal images.8,9
Because of their small size and compatibility with physiological conditions, fluorescent proteins and organic small molecule dyes are commonly employed as probes in fluorescence imaging.5 Although the advent of nanoscopy made it possible to resolve cellular structures and subcellular organelles on the nanometer scale and has revolutionized optical microscopy in the life sciences,35,36 long-term tracking of single molecules and real-time nanoscopy imaging of subcellular organelle, require brighter and highly photostable probes, as the existing molecular dyes and fluorescent proteins are often too dim, can only be optically switched in a limited number of ways, and often undergo fast photobleaching.20,37–39
Recent advances in the materials sciences have provided significant opportunities to address the limitations of these fluorescent probes.
The use of nanomaterials for intracellular delivery of therapeutic agents is a key application of nanotechnology and material chemistry.40–42 Current developments in the tailor-made design of nanomaterial with well-defined optical properties have resulted in a large collection of fluorescent nanoparticles, such as semiconductor quantum dots, carbon nanodots, fluorescent nanodiamonds, upconversion nanocrystals, and polymer dots (Fig. 2).43–47 These nanoparticles have several advantages over conventional systems (small molecule dyes) and offer new opportunities for the cell biology and materials science communities to explore their full capability in subcellular functional imaging at the nanoscale. A thorough analysis of the properties of these newly developed systems may help in designing potent therapeutics or delivering vital information on the etiology of specific diseases and chronic conditions.3,48 Herein we discuss recent developments and potential future application of a variety of nanomaterials in tracking single molecules through super-resolution imaging of subcellular structures.
Nanoparticles in super-resolution microscopy
Semiconductor quantum dots are familiar examples of nanoparticles used for fluorescent imaging.49 Compared with traditional dyes, they have a much larger absorption coefficient, a higher fluorescent quantum yield, and, as a result, superior brightness.49 They exhibit narrow emission bandwidth (<50 nm), and their emission color can be tuned through alterations of their sizes or dimensions, which makes them ideal for multicolor imaging applications and a range of super-resolution imaging modes.50 Other examples or related systems include lanthanide up-conversion nanodots or diamond nanodots.For in vitro live-cell imaging, the insufficient brightness and photostability of small molecule organic probes allow only around 30 nm localization precision and paths composed of tens of scattered data points, whereas quantum dots and other inorganic nanoparticles, allow precision to below 5 nm at temporal resolution of tens of milliseconds with thousands of data points.51 Apart from the general advantages discussed for semiconductor nanodots, up-conversion nanoparticles have additional advantages: they absorb light at near-infrared wavelengths and emit as lower-wavelength (and, thus, higher-frequency). This unique nonlinear response helps in nullifying intracellular auto-fluorescence, while achieving good photostability, large Stokes shift and high tissue penetration achieving the depth of NIR excitation light. These have provided up-conversion nanoparticles a distinct edge over conventional luminophores and such material have been preferred as a new library of super-resolution imaging and single-molecule tracking probes.52–55
Up-conversion super-resolution can produce a maximum resolution of 28 nm for fluorescence imaging of single 13 nm up-conversion nanodots.27 Lanthanide up-conversion nanodots contain thousands of co-doped lanthanide ions that form a network of activators and photon sensitizers, which upconvert near-infrared light into visible and ultraviolet radiation. The large anti-Stokes spectral separation between excitation and emission makes these probes highly useful in background-free and photostable bioimaging.
In comparison with other nanoscale carbon allotropes, nanodiamond is unique in that it consists solely of sp3-hybridized carbon atoms and thus is optically transparent and biologically inert. The material often contains point defects, such as nitrogen-vacancy complexes (e.g. NV−), which form photoluminescent color centers. These built-in fluorophores are atom like and exceptionally photostable. Photobleaching is not detected even under continuous high-power laser excitation at the single-molecule level. This combination of features has made fluorescent nanodiamond (FND) – which contains a high concentration of NV centers – an appealing alternative to organic dyes and fluorescent proteins as a bio-label for long-term in vitro and in vivo imaging applications.43
Recently, semiconductor polymer dots (Pdots) have been utilized in biological imaging because of their outstanding photophysical properties,31 such as high brightness, extraordinary photostability, and favorable biocompatibility, in comparison with those of organic dyes and conventional quantum dots. Polymer particles with particle sizes of ≈15 nm or larger exhibit continuous fluorescence kinetics with no obvious photoblinking, while fluorescence intermittency is sometimes observed for small Pdots when their particle sizes are decreased to ≈10 nm. This phenomenon is intuitively attributable to the fact that the fluorescence of smaller particles originates from a small number of emitting chromophores with reversible on–off dynamics, while larger particles, containing a higher number of chromophores, produce relatively steady fluorescence.
The use of nanocapsules offers a different but complementary range of applications as they provide an unlimited opportunity for encapsulation of useful compounds ranging from hydrophobic to hydrophilic drugs, small RNAs, inorganic nanoparticles, and imaging/contrast agents. They protect their payload from their bulk external environment, in vivo degradation, and can provide site specificity for controlled release of encapsulated payloads. In the rest of this review we discuss illustrative examples of use of these nanomaterials and focus on studies where super-resolution microscopy techniques have been a vital aspect of this research.
In 2011 Tzeng et al. reported BSA coated diamond nanoparticles for imaging of HeLa cells using STED (Fig. 3).43
 | ||
| Fig. 3 Confocal and STED imaging of HeLa cells labeled with BSA-conjugated diamond nanoparticles taken up by endocytosis. (a) Confocal image acquired by raster scanning of diamond nanoparticles loaded cell. The fluorescence image of the complete cell is shown in the white box and reveals fairly uniform cell labeling by BSA-conjugated diamond nanoparticles. (b) STED image of single BSA-conjugated diamond nanoparticles surrounded within the green box in (a). (c) Confocal and STED fluorescence intensity profiles of the particle showed in (b) with a blue line. Solid curves are best fits to one-dimensional Gaussian (confocal) or Lorentzian (STED)functions. The corresponding full widths at half-maximum are given in parentheses. (a–c) Reproduced with permission.43 Copyright 2011, Wiley-VCH. | ||
These composite nanoparticles were internalized into the cytoplasm through endocytosis. STED imaging, with a resolution of approximately 40 nm revealed that the majority of the diamond nanoparticles were located in an isolated form. The combination of the photostability of the functionalized diamond nanoparticles with the sub-diffraction-imaging capability of STED microscopy demonstrated new possibilities for probing intracellular dynamics and interactions with nanometric precision and resolution.
Wojnilowicz and co-workers have employed STORM, for the direct visualization of sequential siRNA trafficking process, including analysis of individual polyplexes and endosomes.56 Polyplexes are polymeric systems containing condensed complexed gene or siRNA through electrostatic interactions between cationic groups of the polymer and the negatively charged nucleic acids. They protect the encapsulated gene or siRNA from cellular enzymatic degradation and release them at the targeted sites. They investigated the probable mechanism by which polyplexes break the endosomal membrane and release their encapsulated nucleic acid cargo in the cytosol. Such studies help in understanding the architecture of the polyplex and reveal that the rigidity of the cationic polymer chains is an important parameter for the mechanism of the rupture of the endosomal membrane (Fig. 4). With highly branched and rigid cationic polymers such as glycogen or polyethylenimine immobilized on silica nanoparticles, the proton sponge effect causes osmotic swelling and rupture of endosomes. This concept shows the versatility of STORM for direct visualization of the intracellular trafficking of therapeutic agents such as siRNA and allows further investigation on the intracellular dynamics of therapeutic proteins.
 | ||
| Fig. 4 Multicolor STORM super-resolution images of polyethylenimine immobilized silica nanoparticles and early and late endosome compartments in the cells. The red signal is related with the analyzed vesicles, whereas the green signal comes from the polyethylenimine immobilized silica nanoparticles. (a) Intracellular trafficking of polyethylenimine immobilized silica nanoparticles and early endosome compartments after 2 h incubation with cells. Image 1, large view of a representative cell showing cytosol distribution of early endosomal compartments and polyethylenimine immobilized silica nanoparticles; images 2–4, high-magnification images of cytosol showing colocalization of polyethylenimine immobilized silica nanoparticles with early endosomes (yellow), noncolocalization, and escape of single polyethylenimine immobilized silica nanoparticles (green). (b) Intracellular trafficking of polyethylenimine immobilized silica nanoparticles and late endosome compartments after 6 h incubation with cells. Image 1, large view of a single representative cell showing predominant cytosol distribution of late endosome compartments and polyethylenimine immobilized silica nanoparticles; image 2, high-magnification image showing intact polyethylenimine immobilized silica nanoparticles (green dots) with no overlap with lysosome membranes (red spots); image 3, super-resolved image of a single polyethylenimine immobilized silica nanoparticles escaping from the enveloping late endosome–lysosome compartment; image 4, single late endosome compartments without polyethylenimine immobilized silica nanoparticles. (a and b) Reproduced with permission.56 Copyright 2019, American Chemical Society. | ||
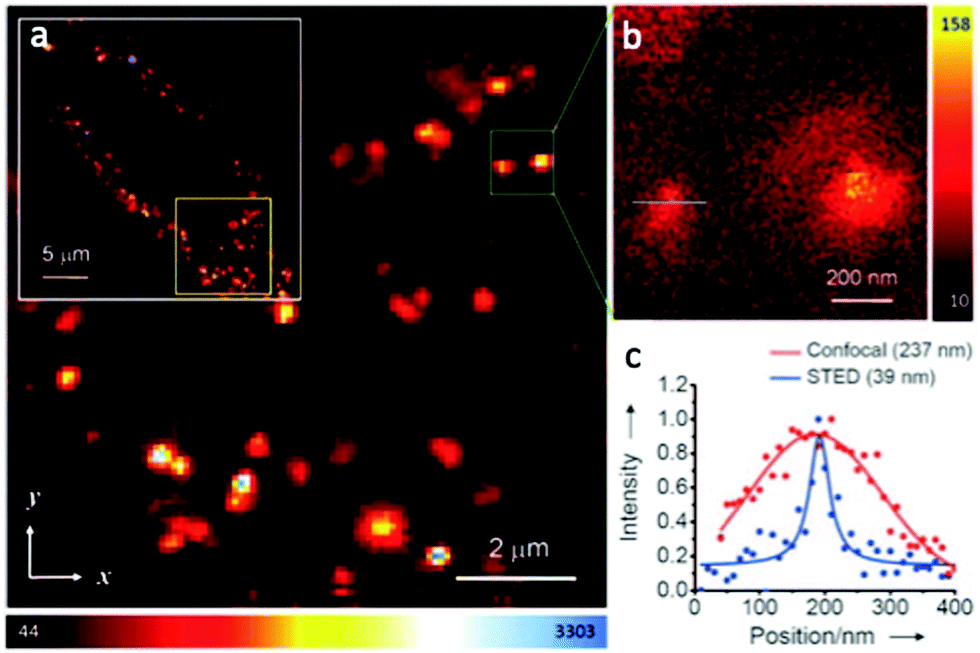
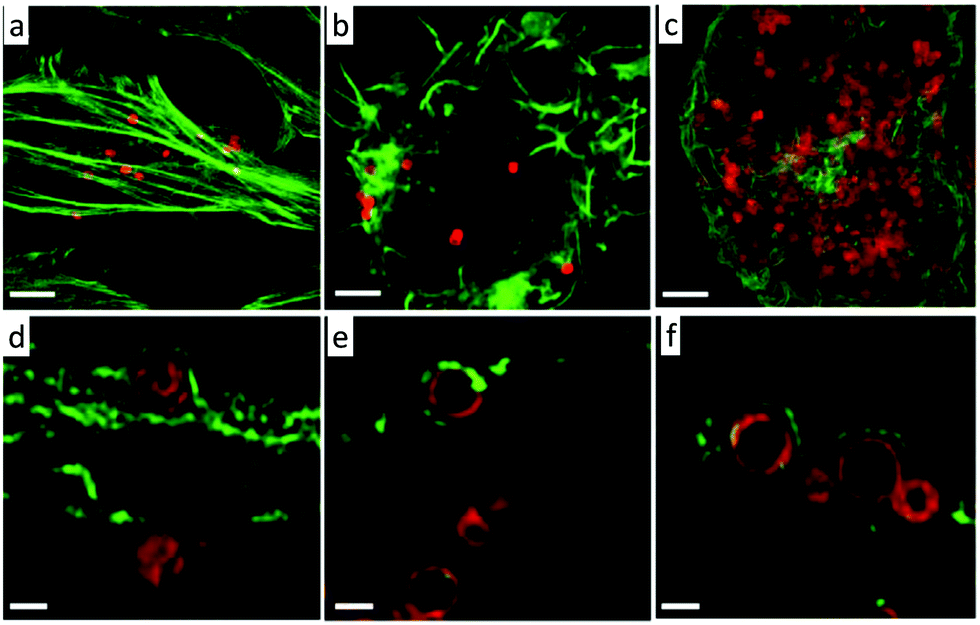
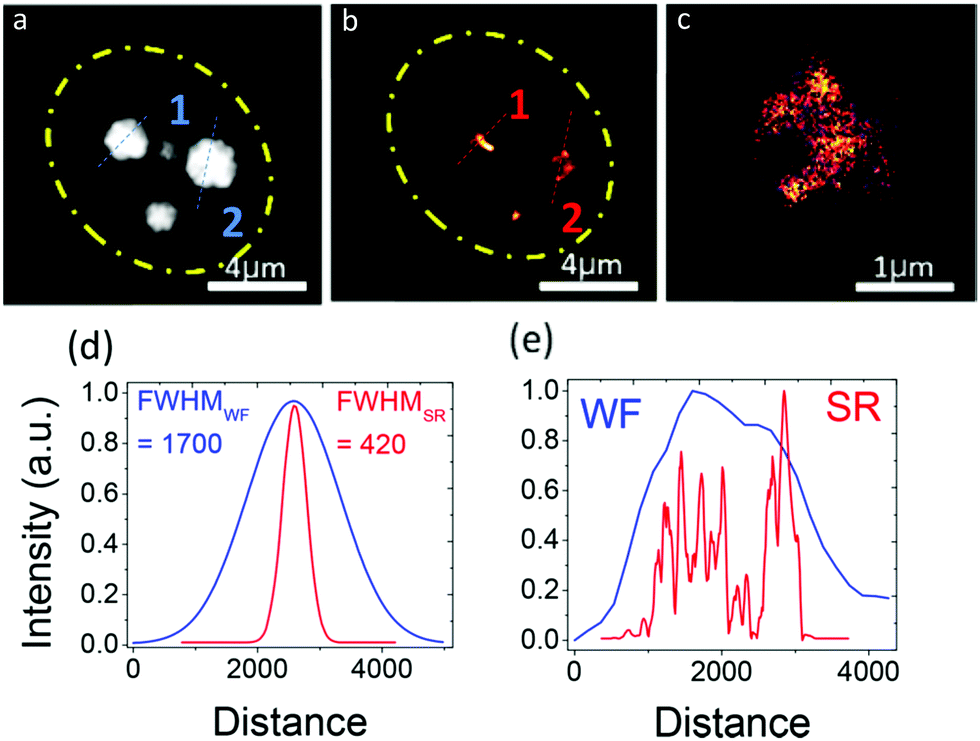
Zwaag, et al. have reported the quantitative investigation of nanoparticle interactions with cell membranes and subsequent intracellular trafficking by using a combination of STORM microscopy and quantitative image analysis.57 Polystyrene beads, functionalized with the carboxylic acid, were used for quantitative investigation within HeLa cells. They also developed image analysis tools for extracting quantitative information about internalized polystyrene particles from STORM images (Fig. 5). This information was crucial in understanding the mechanism of single endocytic events, subcellular localization of the nanoparticles, and the fate of intracellular drug delivery. This method was validated by comparing it with data from confocal microscopy and electron microscopy on the uptake of nanoparticulate model-antigens by dendritic cells.
 | ||
| Fig. 5 (a) Super resolution colocalization of organelle markers (green) and internalized 80 nm polystyrene nanoparticles (red) in HeLa cells. Image size = 40 μm, zoomed image size = 5 μm. (b) Super resolution images of a micropinocytosis event of a 220 nm polystyrene nanoparticle (magenta). Plasma membrane is stained with WGA (green). Scale bar = 700 nm. (a and b) Reproduced with permission.57 Copyright 2016, American Chemical Society. | ||
Shang et al. has reported on protein-based luminescent nanoparticles for STED imaging of live HeLa cells. They have used Atto647N (a NIR-emitting dye frequently used for STED nanoscopy) loaded transferrin nanoparticles as model nanoparticles.58 In STED nanoscopy, the Atto647N loaded transferrin nanoparticles show four times better resolution than that of pure Atto647N dye. As an example, in CLSM, adjacent clusters appear as a single large structure, whereas in STED they can be distinguished as separate particles (Fig. 6). These protein nanoparticles show good biocompatibility, excellent colloidal stability and photostability which make them attractive candidates for future biological studies.
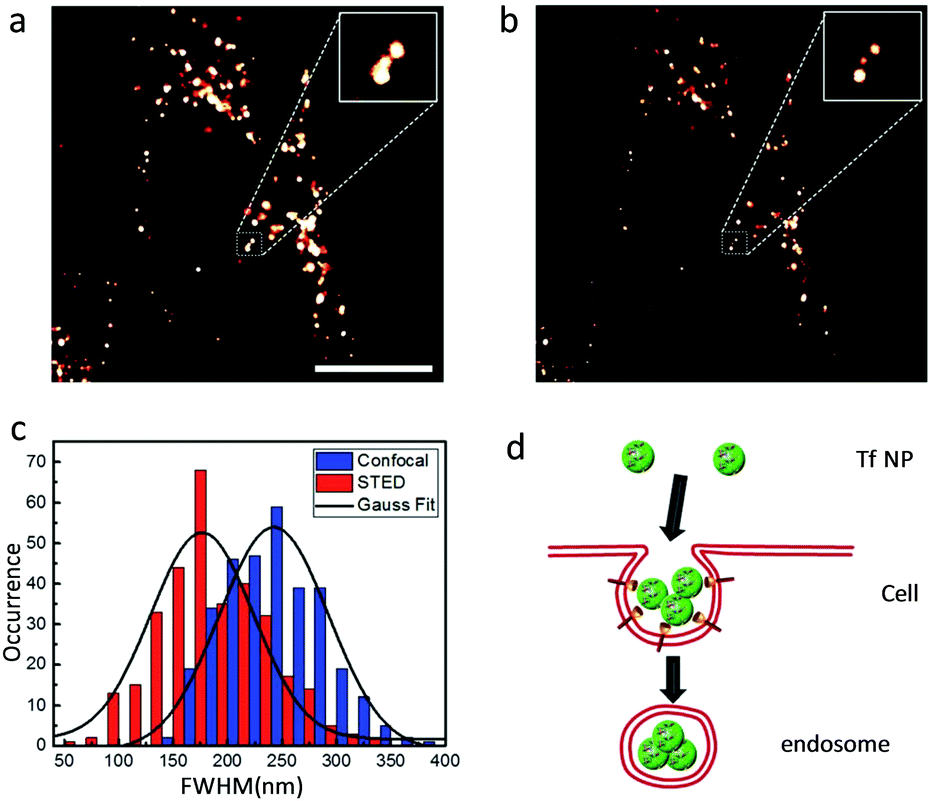 | ||
| Fig. 6 Typical (a) confocal and (b) STED microscopy images of Atto647N – transferrin nanoparticles inside HeLa cells. Insets are close-up views of the regions indicated with a dotted white square. Scale bar: 10 mm. (c) Statistical analysis of full width at half maximum values obtained for >200 individual emitting species in both confocal (blue) and STED (red) microscopy images; the black curves represent corresponding Gaussian fits. (d) Schematic illustration of the internalization of multiple transferrin nanoparticles into one vesicle. (a–d) Reproduced with permission.58 Copyright 2017, Royal Society of Chemistry. | ||
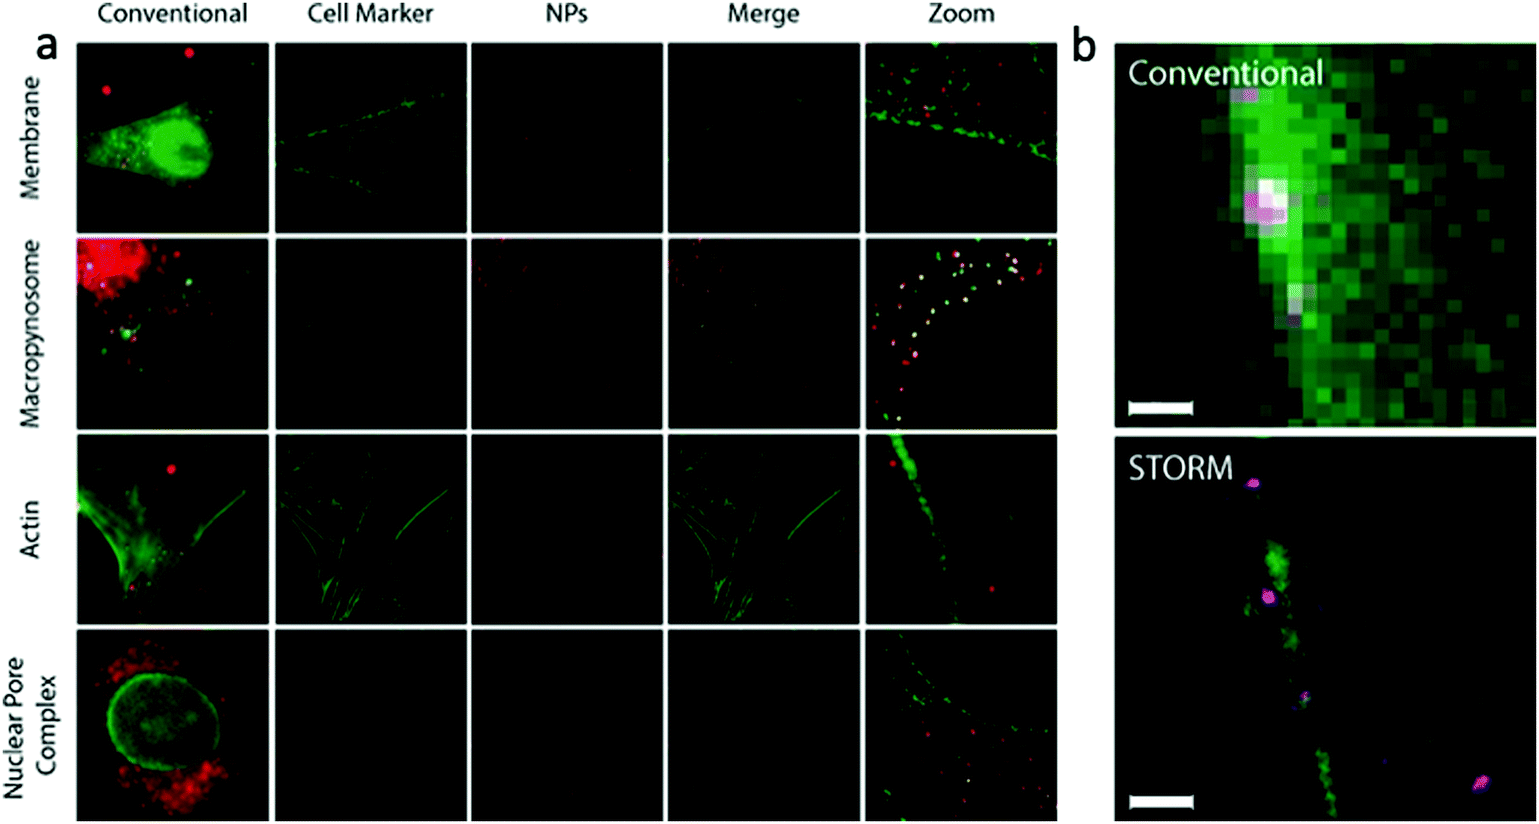
Feiner-Gracia, et al. have used two-color direct stochastic optical reconstruction microscopy (dSTORM) for in-depth study of the structure and molecular composition of polyplexes containing mRNA and cell-penetrating peptide R9.59 The nanocarriers comprising of mRNA and peptide nona-arginine were imaged to resolutions below 20 nm (Fig. 7). The two-color STORM images reveal the impact of peptide stoichiometry on polyplex structure and composition and their destabilization in blood serum. Moreover, the differences in the stoichiometry of polyplexes explain the differences in their cellular uptake behavior in HeLa cells. Furthermore, the dSTORM imaging visualized the effect of protein corona formation on polyplex structure in blood serum which can readily explain the differences in cellular uptake behavior.
 | ||
| Fig. 7 Imaging of polyplexes using dSTORM microscopy. (a) Schematic representation of polyplex formation from mRNA-Cy5 and AlexaFluor488-R9, with imaging and analysis. (b) Conventional fluorescent image of polyplexes at N/P5 (red represents mRNA molecules and green R9 molecules). (c) dSTORM imaging of polyplexes, with the same field of view as in B. Scale bar 2 μm. (d) Close-up images of three different areas showing low-resolution data on the left and high-resolution data on the right. Scale bar 400 nm. (a–d) Reproduced with permission.59 Copyright 2019, American Chemical Society. | ||
The Caruso group has investigated the intracellular deformation of thiolated poly(methacrylic acid) nano-capsules architectures in various cell lines using super-resolution microscopy (Fig. 8).60 They found insignificant differences in the cellular association of spherical capsules among HeLa, RAW and dTHP-1 cells; whereas, significant differences in the cellular association of cylindrical capsules were observed with each of these cell lines. Spherical nano-capsule deformation was highest in HeLa cells (96%), compared to RAW (56%), and dTHP-1 cells (29%). This trend in cell line dependent deformation was also observed with cylindrical capsules. This study may help in the design of drug nanocarriers which are sensitive to deformation for controlled drug release properties.
 | ||
| Fig. 8 SIM images of AF633-labelled poly(methacrylic acid) nano-capsules capsules with spherical shapes in HeLa (a and d), RAW (b and e) and dTHP-1 (c and f). Cell actin was stained with AF488 phalloidin. Images a, b, and c present images at the maximum intensity projection and images d, e, and f represent a single z-plane image of cells. The capsules were incubated with all cell types for 24 h at 37 °C, 5% CO2. Scale bars: a–c, 2.5 μm; d–f, 0.5 μm. (a–f) Reproduced with permission.60 Copyright 2016, Royal Society of Chemistry. | ||
Kenar and colleagues have reported multicolor 3D super-resolution imaging by combining quantum dot asynchronous spectral blueing with STORM without sacrificing resolution.25 For multicolor imaging, two different sizes of CdSe quantum dots (QD 705 nm and QD 565 nm) were used as the probes, and two narrow band-pass filters (625 nm center/15 nm width and 504 nm center/12 nm width) were used to collect the emission from the quantum dots. By optimizing the mounting medium and excitation laser intensity, the quantum dots show around 80 nm blue shift.61 Furthermore, by using these quantum dots the microtubule of mitochondria of width 46 nm was successfully imaged in HepG2 cells (Fig. 9).
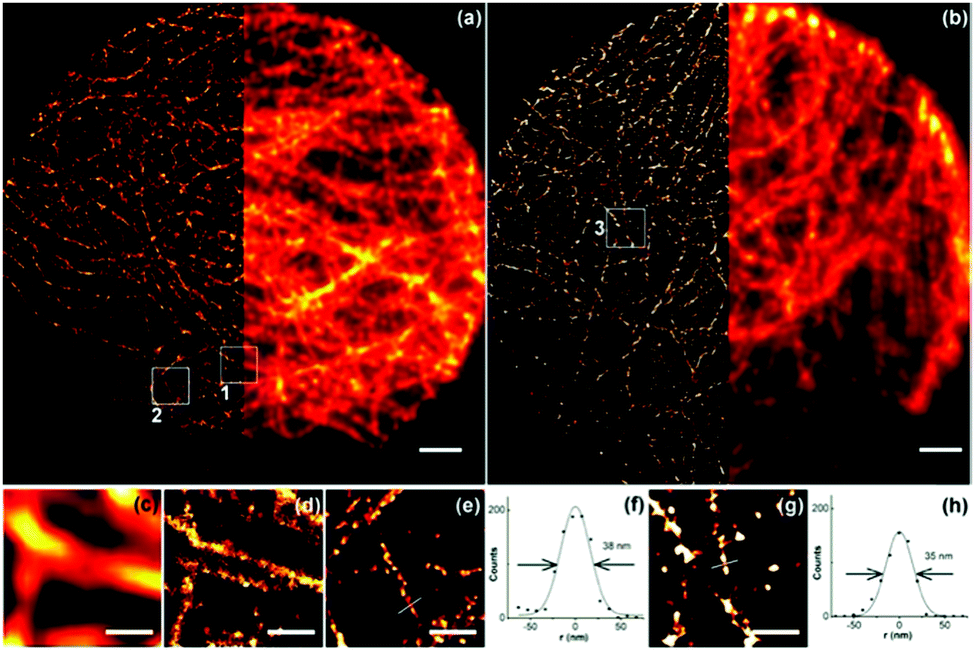 | ||
| Fig. 9 (a and b) STORM (left) and wide-field (right) images of microtubules in HepG2 cells labeled with 565 and 705 nm quantum dots, respectively. Scale bar is 2 μm. (c and d) Wide-field and STORM images of box 1 in (a). Scale bar is 500 nm. (e) STORM image of box 2 in (a). Scale bar is 500 nm. A cross-section of a microtubule is shown in (f). The full width at half-maximum is 38 nm. (g) STORM image of box 3 in (b). Scale bar is 500 nm. A cross-section of a microtubule is shown in (h). The full width at half-maximum is 35 nm. (a–h) Reproduced with permission.25 Copyright 2015, American Chemical Society. | ||
Zhi, et al. have used malic acid carbon dots for super-resolution fluorescence localization microscopy for both fixed and live trout gill epithelial cells.62 The photo blinking properties of the, as synthesized, malic acid carbon dots are outstanding and superior compared to those of conventional dyes as they exhibit enhanced spatial resolution in super-resolution localization imaging experiments (Fig. 10).
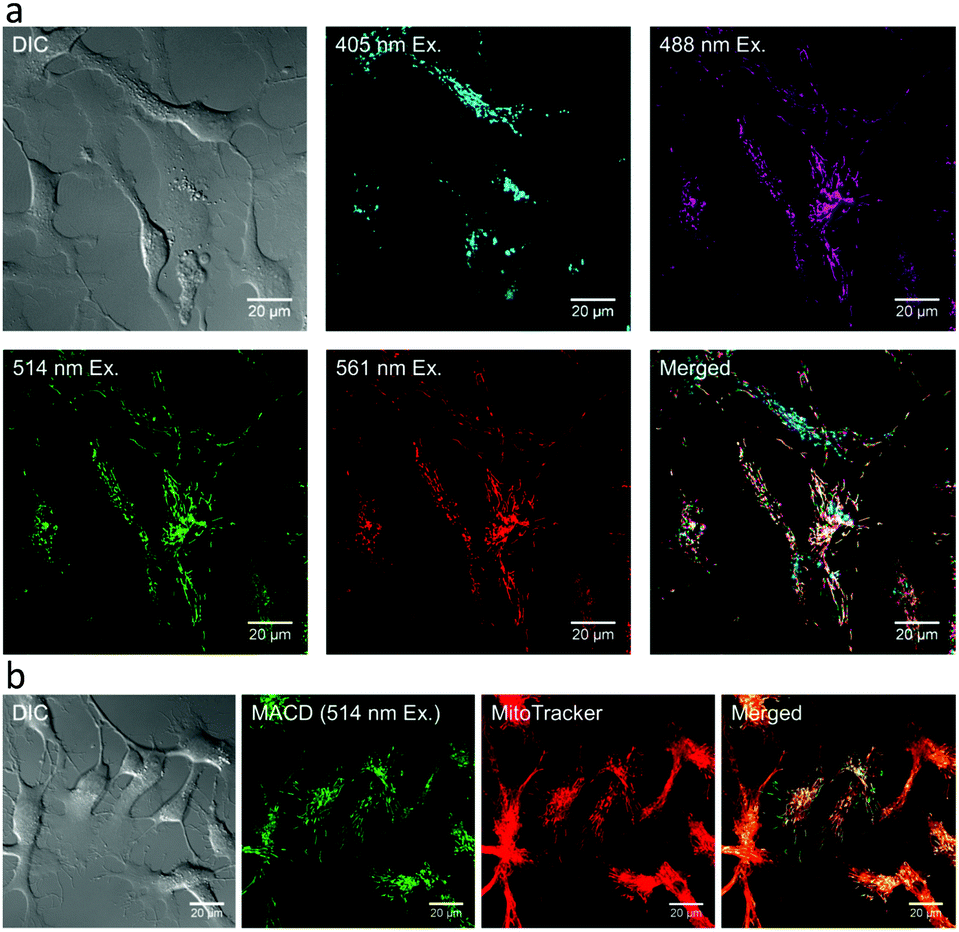 | ||
| Fig. 10 Distribution of malic acid carbon dots in live trout gill epithelial cells. (a) malic acid carbon dots of different sizes, corresponding to excitation wavelengths 488, 514, and 561 nm, were found to localize at the same intracellular compartments, whereas malic acid carbon dots that were excited with 405 nm were found to localize in different compartments. (b) Green-to-yellow malic acid carbon dots (with excitation wavelength ≥488 nm) were present mainly in mitochondria, as determined by their colocalization with MitoTracker. (a and b) Reproduced with permission.62 Copyright 2018, American Chemical Society. | ||
Additionally, by using C18 reverse-phased silica gel column chromatography, they developed a time-saving high-throughput method to separate as-synthesized malic acid carbon dots. The malic acid carbon dot fractions acquired in this manner exhibit distinct particle size distributions and wavelength-independent emission.
The Sun research group has developed two types of small photoblinking semiconductor polymer dots: semiconducting polymer poly[(9,9dioctylfluorenyl-2,7-diyl)-co-(1,4-benzo-[[2,1′,3]]-thiadazole)] (PFBT) and poly[2-methoxy-5-(2-ethylhexyloxy)-1,4-(1-cyanovinylene-1,4-phenylene)] (CN-PPV), for fluorescence nanoscopy (Fig. 11).63
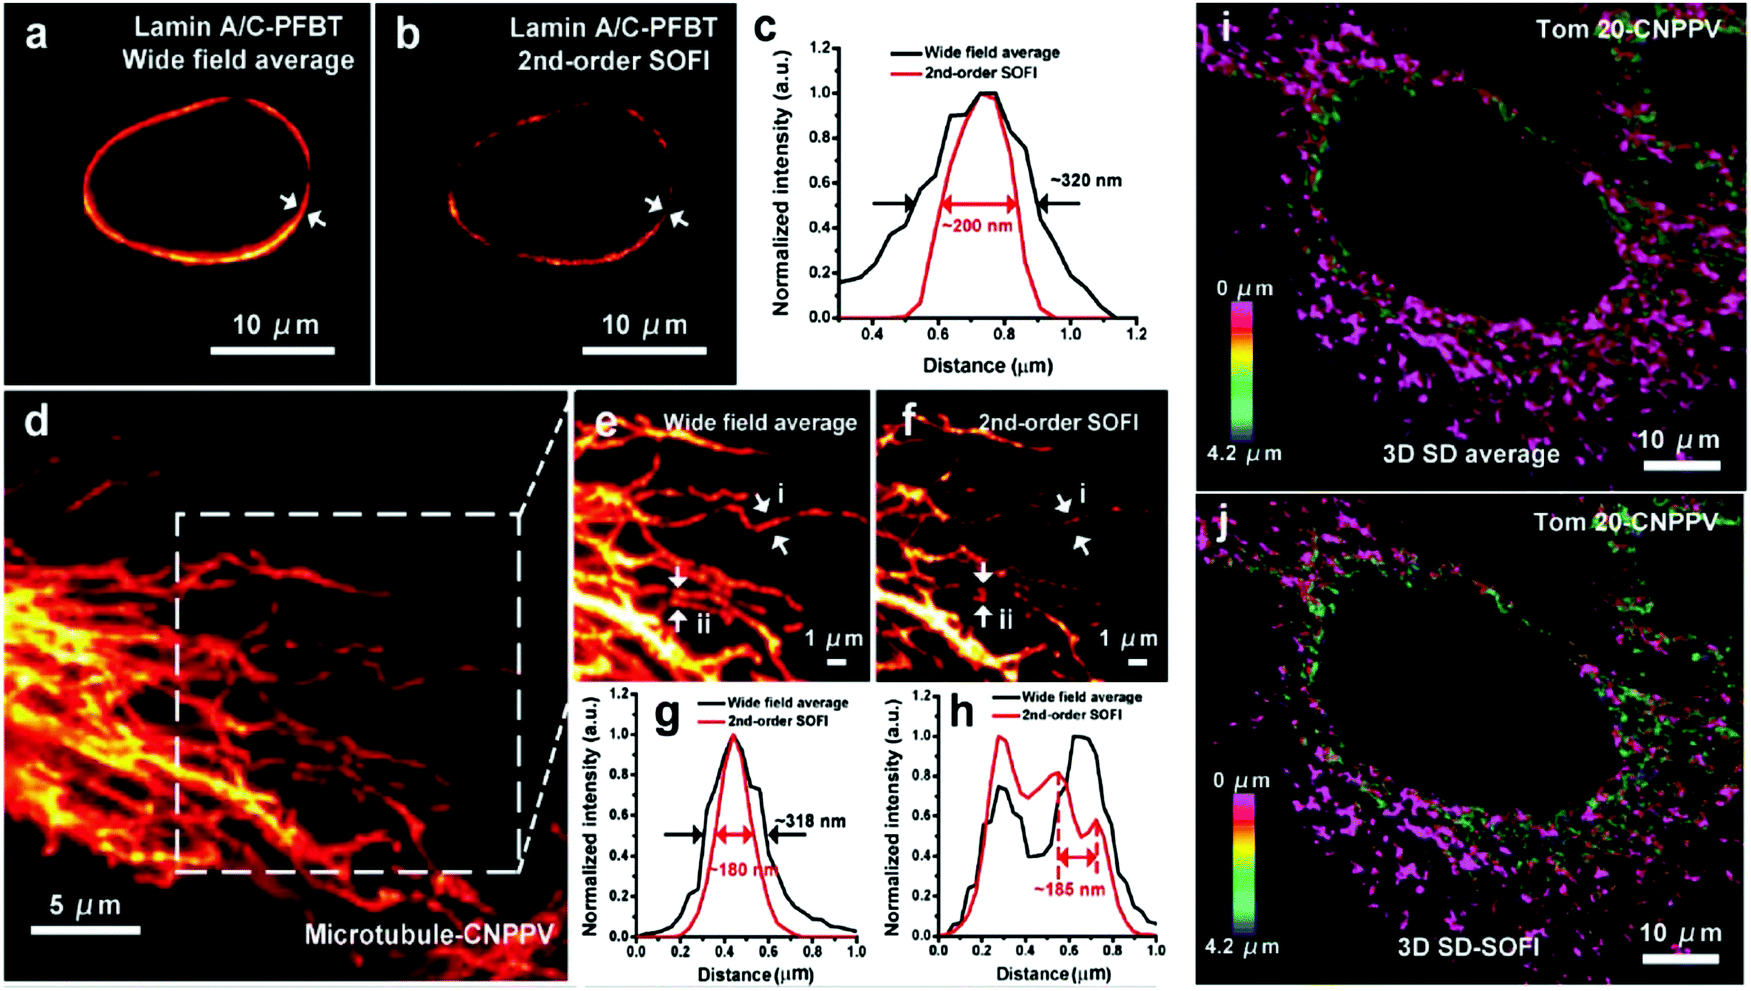 | ||
| Fig. 11 SOFI nanoscopy of subcellular structures labeled with small photoblinking polymer dots. (a) Conventional averaged wide-field image of Lamin A/C labeled with small PFBT polymer dots. (b) 2nd-order SOFI image generated by analyzing 1000 frames of raw data from panel (a). (c) The intensity profiles of the white arrows shown in panels (a and b). (d) Conventional wide-field imaging of tubulin labeled with small CN-PPV polymer dots. (e) A magnified area in the square in panel (d). (f) 2nd-order SOFI image generated by analyzing 1000 frames of raw data from panel (e). (g and h) The intensity profiles of the white arrows shown in panels (e and f). (i) 3D maximum intensity projection of spinning disk (SD) confocal and (j) corresponding 3D 2nd-order SD-SOFI imaging of the mitochondria structure of fixed BS-C-1 cells immunolabeled with small CN-PPV Pdots, which covers a volume of ≈72 μm × 72 μm × 4.2 μm. Scale bar: 10 μm in panels (a, b and i, j), 5 μm in (d) and 1 μm in (e and f). (a–j) Reproduced with permission.63 Copyright 2017, Wiley-VCH. | ||
These polymer dots exhibit ultrahigh brightness, favorable biocompatibility, very strong photostability, and obvious fluorescence fluctuation. Using super-resolution optical fluctuation imaging (SOFI) these small semiconductor polymer dots can image subcellular organelles. Their unique properties include evident fluorescence fluctuation/photoblinking and almost no photobleaching during the acquisition time. Second-order deconvolution analysis of the SOFI data revealed detailed nuclear envelope and microtubule filaments features, due to improved spatial resolution (≈1.6-fold and 1.76-fold) and signal-to-noise. This indicates that these small photo-blinking polymer dots are excellent probes for super-resolution, long-term visualization of subcellular dynamics. To overcome the limitation of color choice, broad emission spectrum, and heavy spectrum crosstalk, similar methodology was adopted by the same research group to develop two more small photo-blinking semiconductor polymer dots [polydioctylfluorene (PFO) and poly(9,9-dioctylfluorene)-co-(4,7-di-2-thienyl-2,1,3-benzothiadiazole) (PFTBT5)] of blue and carmine color (Fig. 12).31 These photoblinking semiconducting polymer dots cover color gaps in the labels used for multicolor statistical super-resolution imaging. The streptavidin-conjugated PFO and PFTBT5 polymer dots targeted specific subcellular organelle with high labeling density in green monkey kidney epithelial (BS-C-1) cells, including mitochondrial outer membranes, cytoskeleton microtubule laments, and clathrin-coated vesicles. Furthermore, these polymer dots can distinguish different mitochondrial structures, including tubular, elongated, and globular morphologies. These polymer dots also performed very well in indirect immunofluorescence imaging of the microtubule network and a clathrin-coated pit in BS-C-1 cells.
 | ||
| Fig. 12 Dual-color SOFI nanoscopy of subcellular structures labeled with narrow emissive small photoblinking polymer dots. (a) Widefield imaging of clathrin-coated pits labeled with PFO polymer dots and microtubule labeled with PFTBT5 polymer dots. (b) Magnified region shown in the white box in panel a. (c) Second-order SOFI image generated by analyzing 500 frames of raw data from panel b. (d and e) The intensity profiles of the white arrows i and ii shown in panels b and c. Scale bar = 1 μm in panel a and 500 nm in panels b and c. (a–e) Reproduced with permission.31 Copyright 2017, American Chemical Society. | ||
Chizhik and co-workers have reported SOFI of biological samples with dual-color emissive (λem ∼ 420 and 515 nm, for λex ∼ 360 and 410 nm) carbon-nanodots.64 In the Sarcoma osteogenic (Saos-2) and Madin-Darby Canine Kidney Epithelial (MDCK-II) cell lines, the neutral blue carbon dots preferentially penetrate the nuclear membrane and localize over the nucleus (Fig. 13). Their specific localization over the nuclei of Saos-2 and MDCK cells suggests their potential use as inexpensive, easily produced nucleus-specific labels. Interestingly, the green carbon-nanodots were excluded from the nucleus and instead localized to fibrous, network-like intracellular structures, possibly endosomes or mitochondria. These results open up new possibilities for the use of carbon nanodots in the various super-resolution microscopy methods based on stochastic optical switching.
 | ||
| Fig. 13 (a and d) Fluorescence wide-field and second-order SOFI images of a Saos-2 cell, respectively. (b and c) and (e and f) showing two subareas of the cell-widefield and SOFI images, respectively. The dotted lines in figures b and e indicate cross-sections shown in figure g. Scale bars 10 μm. (g) Cross-sections through the sub-images of the wide field and SOFI images shown in images b and e, respectively. (h) Cross-sections through a single bright spot in the wide-field and SOFI image. (a–h) Reproduced with permission.64 Copyright 2016, American Chemical Society. | ||
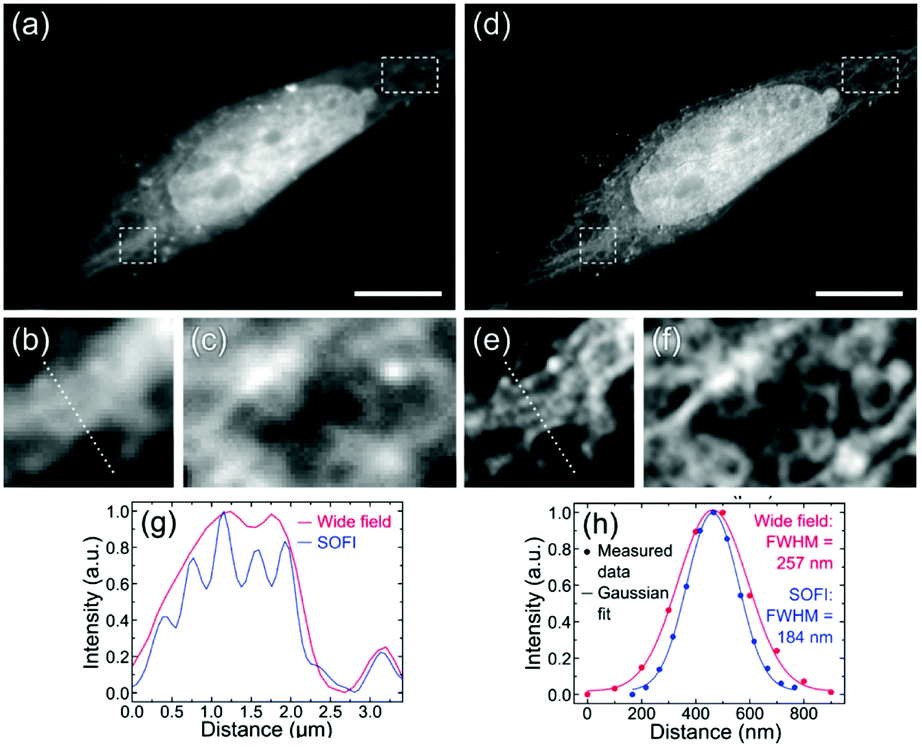
Singh, et al. have reported the two-photon excitable graphene quantum dots for lysosome and tissue-dependent imaging by structured illumination microscopy.65 The biocompatible graphene quantum dots were synthesized by the hydrothermal method using neem root extracts as starting materials. In vitro experiments in RAW cells show specific localization in lysosomes (Fig. 14), whereas in vivo imaging in zebrafish confirmed that the graphene quantum dots specifically localize in the yolk sac region. The presence of the –COOH, C–O–C and amino functionalities on the surface of the graphene quantum dots helps to achieve the appropriate lipophilicity for the observed localization.
 | ||
| Fig. 14 Colocalization experiments of the intracellular localization of the graphene quantum dots using LysoTracker probes in RAW cells: Wide-field microscopy images of intracellular emission of GQDs (panel a) with intensity along the traced line shown underneath. Emission from LysoTracker Deep Red (panel b) and intensity along the same line shown below. Panel C shows the overlap of green and red fluorescence, indicating lysosomal localization of the graphene quantum dots. Panel d shows that the Pearson coefficient = 0.936. (a–d) Reproduced with permission.65 Copyright 2019, Royal Society of Chemistry. | ||
Nandi, et al. have synthesized yellow-orange emissive carbon dots that selectively bind to RNA and spontaneously localize inside the nucleolus of HeLa cells.68 Their single-particle fluorescence exhibits blinking with a high photon budget, enabling single-molecule imaging that shows carbon dots localize spontaneously in the central region of the nucleolus of the cells (Fig. 15).
 | ||
| Fig. 15 Single-molecule imaging of carbon dots inside the nucleolus. (a) WF diffraction-limited image of three nucleoli of a HeLa cell. The yellow dotted circle shows the boundary of the nucleolus. (b) Reconstructed and SR image of three nucleoli. (c) Magnified view of a resolved nucleolus showing greater detail than the WF image. (d) Intensity profile along the dotted lines on nucleolus 1 showing 4 times improvement of the intensity. (e) Intensity profile along the dotted line on nucleolus 2 showing the detail of some well-resolved ultrastructures inside the nucleolus. (a–e) Reproduced with permission.68 Copyright 2018, American Chemical Society. | ||
These carbon dots can be used for monitoring the dynamics of nucleolar RNA organization, especially in the propagation of various diseases. The same research group adopted a similar methodology where they reported the surface modification of lanthanide upconversion nanoparticles with organelle targeting ligands to transform inorganic nanoparticles into organelle-specific two-photon imaging nano-probes.66,67
Recently, Wu, et al. have synthesized a series of nucleolus-targeted red emissive carbon dots. Among them, Ni-para-phenyl-diamine carbon dots (Ni-pPCDs) have several distinct advantages, including high photostability, good water dispersibility, high quantum yield (45.6% in dimethyl sulfoxide), excitation-independent and polarity dependent fluorescence emission, and unique intracellular performance such as organelle-specific targeting.28 STED imaging of A549 cell shows enlarged nucleoli with an imaging resolution as high as 146 nm (Fig. 16). Furthermore, the Ni-pPCDs were successfully utilized for in vivo imaging in both mice and in zebrafish models.
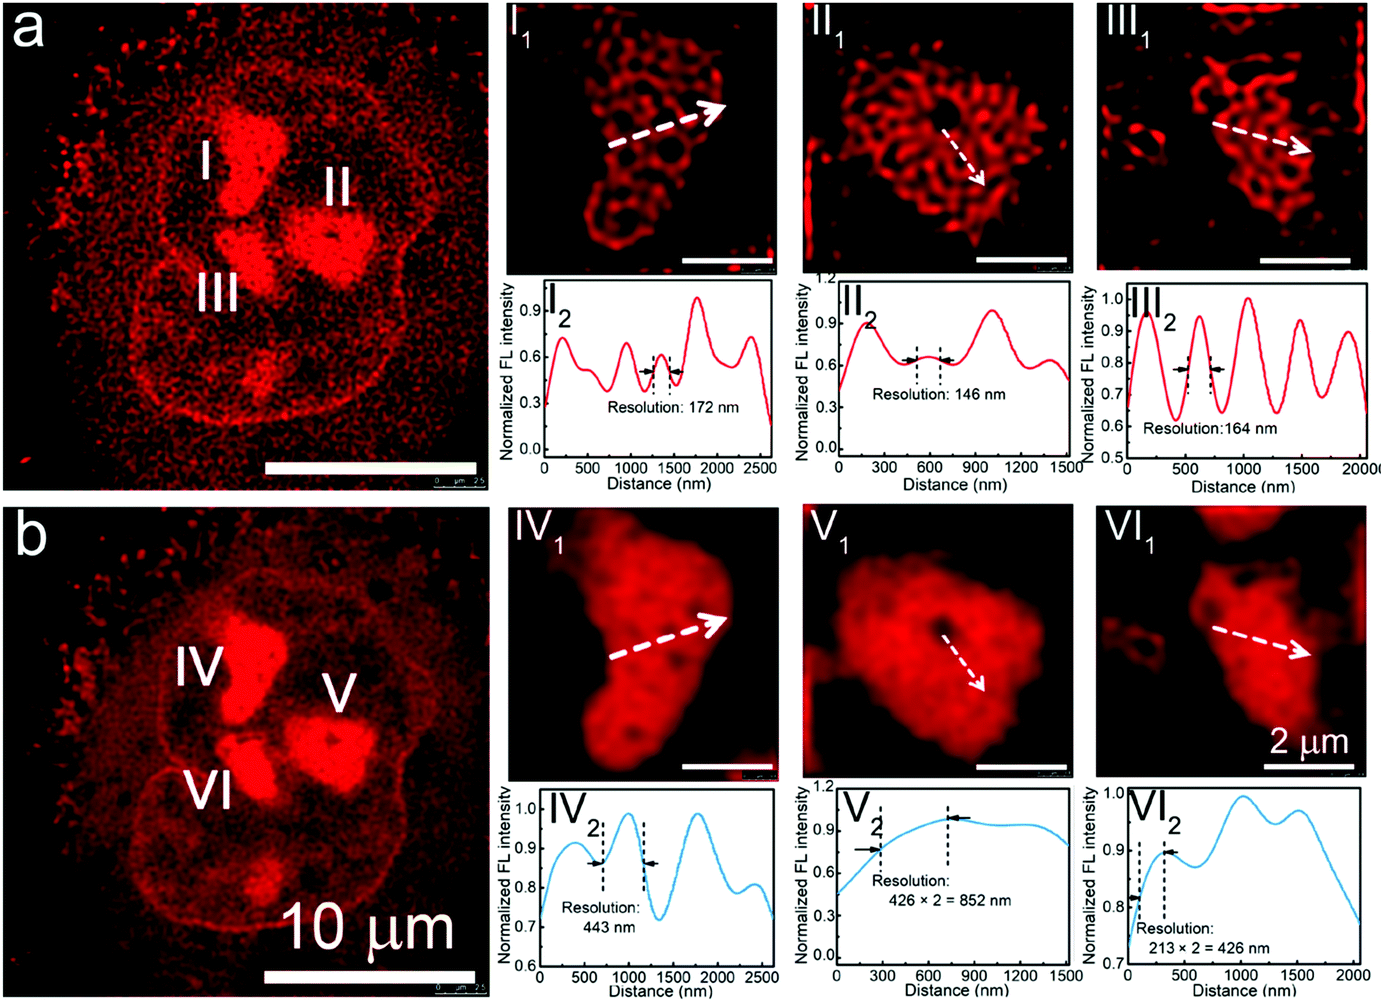 | ||
| Fig. 16 (a) STED image and (b) confocal image of a representative A549 cell stained by Ni-pPCDs. (I1, II 1, and III1) Enlarged STED images of the nucleoli of the A549 cell in a, and (I2, II 2, and III2) corresponding fluorescence intensity analysis results of the marked lines in I1, II 1, and III1. (IV1,V 1, and VI1) Enlarged confocal images of the nucleoli of the A549 cell in b, and (IV2,V 2, and VI2) corresponding fluorescence intensity analysis results of the marked lines in IV1,V 1, and VI1. (a and b) Reproduced with permission.28 Copyright 2019, American Chemical Society. | ||
Pramanik and co-workers reported biologically benign nano-capsules for super-resolution imaging and drug delivery (Fig. 17).69 The polymeric backbone of these nano-capsules was designed to undergo programmed rupture in response to an enzymatic stimulus with subsequent release of an encapsulated drug within mitochondria. The endogenous-enzyme-activated nano-capsule rupture and consequent release of its encapsulated payload were also demonstrated in a zebrafish model.
 | ||
| Fig. 17 The colocalization experiments of intracellular localization of dye loaded nano-capsules using MitoTracker probes: (a) SIM images of intracellular emission of sample dye loaded nano-capsules. (b) Emission obtained from Mito Tracker Deep Red and intensity along the same line shown below. (c) an overlap image of a and b, indicating mitochondria localization of the nano-capsules. (d) is the 3D view of c. (e) Pearson coefficient of value 0.92. (a–e) Reproduced with permission.69 Copyright 2018, American Chemical Society. | ||
Conclusion and outlook
Summing up, nanomaterials, in combination with super-resolution microscopy, provides new tools to understand the dynamics of cells at a fundamental level. The application of a range of nanomaterials as super-resolution microscopy probes has extended understanding on various biological mechanisms within cells. Processes such as configurational changes of proteins, DNA and other biomolecules have been studied effectively with the help of the greatly improved spatial resolution provided by various super-resolution microscopy techniques. Inter alia, this has facilitated an understanding of the role of specific proteins in bio-signaling mechanisms within intracellular organelles.To facilitate further reading, a succinct overview of the function of nanomaterials discussed in this review is provided by Table 1, which précises their specific role in enhancing the outcomes of chosen super-resolution imaging techniques used in these studies and provides references for the relevant reports.
| Nanoparticles | SRM type | Role | Ref. |
|---|---|---|---|
| Quantum dots | STORM, SIM | Pairing of a short-pass filter with quantum dots high resolution three-dimensional imaging was achieved, by using single CdSe/ZnS quantum dots (QDs). Room temperature time-resolved luminescence was exhibited, and graphene quantum dots localized in lysosomes were studied by SIM | 25, 61 and 65 |
| Upconversion Nanoparticles | STED | Lowering the laser intensity requirements of optical depletion by using lanthanide-doped upconversion nanoparticles, a two-photon excitable composite lanthanide based upconversion nanoprobe was developed and used to image cellular trafficking processes in real time inside lysosome and mitochondria | 27, 66 and 67 |
| Nanodiamonds | STED | Used as photostable fluorescent markers in cells for STED | 43 |
| Polymer dots | SOFI | PFBT and CN-PPV polymer dots were used as outstanding labels for dual-color SOFI nanoscopy with high spatiotemporal resolution, imaging subcellular structures | 31 and 63 |
| Polyplex | STORM | Direct visualization of the siRNA trafficking process silica nanoparticle based polyplex revealed the molecular basis of the “proton sponge effect” and facilitated the study of the impact of peptide stoichiometry on polyplex structure and composition | 56 and 59 |
| Polystyrene Nanoparticles | STORM | Addressed the size, position and interaction of nanoparticles inside the cell at nanoscale resolution | 57 |
| Protein based nanoparticles | STED | Synthesis of transferrin nanoparticles loaded with Atto647N achieved improved resolution | 58 |
| Nanocapsule | SIM | Study of intracellular deformation of layer-by-layer assembled polymer capsules. Polyurethane nanocapsules for enzyme-triggered drug release localize in mitochondria | 60 and 69 |
| Carbon Dots | SRLM, SOFI | Malic acid carbon dot synthesis proved to be superior in terms of photoblinking properties, thus useful in SRLM. Biocompatible intrinsic dual-color fluorescence carbon nanodots produced nucleus-specific label & yellow-orange emissive carbon dots specifically binding to the RNA that spontaneously localize inside the nucleolus of HeLa cells | 28, 61, 64 and 68 |
Conflicts of interest
There are no conflicts to declare.Acknowledgements
We are grateful to the reviewers whose insightful comments have greatly improved the quality of this review. Financial supports from SERB grants (EMR/2016/001850 and JCB/2017/000004) and DBT (India) (grant BT/PR22251/NNT/28/1274/2017) are acknowledged by AD.Notes and references
- B. Huang, H. Babcock and X. Zhuang, Breaking the Diffraction Barrier: Super-Resolution Imaging of Cells, Cell, 2010, 143, 1047–1058 CrossRef CAS PubMed.
- M. Bates, G. T. Dempsey, K. H. Chen and X. Zhuang, Multicolor Super-Resolution Fluorescence Imaging via Multi-Parameter Fluorophore Detection, ChemPhysChem, 2012, 13, 99–107 CrossRef CAS PubMed.
- S. Pujals and L. Albertazzi, Super-resolution Microscopy for Nanomedicine Research, ACS Nano, 2019, 13, 9707–9712 CrossRef CAS PubMed.
- A. H. Ashoka, F. Ali, R. Tiwari, R. Kumari, S. K. Pramanik and A. Das, Recent Advances in Fluorescent Probes for Detection of HOCl and HNO, ACS Omega, 2020, 5, 1730–1742 CrossRef CAS PubMed.
- H. Singh, K. Tiwari, R. Tiwari, S. K. Pramanik and A. Das, Small Molecule as Fluorescent Probes for Monitoring Intracellular Enzymatic Transformations, Chem. Rev., 2019, 119, 11718–11760 CrossRef CAS PubMed.
- G. Shtengel, J. A. Galbraith, C. G. Galbraith, J. Lippincott-Schwartz, J. M. Gillette, S. Manley, R. Sougrat, C. M. Waterman, P. Kanchanawong, M. W. Davidson, R. D. Fetter and H. F. Hess, Interferometric fluorescent super-resolution microscopy resolves 3D cellular ultrastructure, Proc. Natl. Acad. Sci. U. S. A., 2009, 106, 3125 CrossRef CAS PubMed.
- E. Slenders, S. Seneca, S. K. Pramanik, N. Smisdom, P. Adriaensens, M. vandeVen, A. Ethirajan and M. Ameloot, Dynamics of the phospholipid shell of microbubbles: a fluorescence photoselection and spectral phasor approach, Chem. Commun., 2018, 54, 4854–4857 RSC.
- B. Huang, W. Wang, M. Bates and X. Zhuang, Three-Dimensional Super-Resolution Imaging by Stochastic Optical Reconstruction Microscopy, Science, 2008, 319, 810 CrossRef CAS PubMed.
- M. J. Rust, M. Bates and X. Zhuang, Sub-diffraction-limit imaging by stochastic optical reconstruction microscopy (STORM), Nat. Methods, 2006, 3, 793–796 CrossRef CAS PubMed.
- H. Singh, S. Sreedharan, R. Tiwari, C. Walther, C. Smythe, S. K. Pramanik, J. A. Thomas and A. Das, A Fluorescent Chemodosimeter for Organelle-Specific Imaging of Nucleoside Polyphosphate Dynamics in Living Cells, Cryst. Growth Des., 2018, 18, 7199–7206 CrossRef CAS.
- H. Agarwalla, H. A. Anila, F. Ali, S. R. Pradhan, B. Ganguly, S. K. Pramanik and A. Das, Fluorescent chemodosimeter for quantification of cystathionine-γ-synthase activity in plant extracts and imaging of endogenous biothiols, Chem. Commun., 2018, 54, 9079–9082 RSC.
- S. Seneca, S. K. Pramanik, L. D’Olieslaeger, G. Reekmans, D. Vanderzande, P. Adriaensens and A. Ethirajan, Nanocapsules with stimuli-responsive moieties for controlled release employing light and enzymatic triggers, Mater. Chem. Front., 2020, 4, 2103–2112 RSC.
- A. Dani, B. Huang, J. Bergan, C. Dulac and X. Zhuang, Superresolution Imaging of Chemical Synapses in the Brain, Neuron, 2010, 68, 843–856 CrossRef CAS PubMed.
- M. Wu, B. Huang, M. Graham, A. Raimondi, J. E. Heuser, X. Zhuang and P. De Camilli, Coupling between clathrin-dependent endocytic budding and F-BAR-dependent tubulation in a cell-free system, Nat. Cell Biol., 2010, 12, 902–908 CrossRef CAS PubMed.
- K. Isobe, H. Kawano, T. Takeda, A. Suda, A. Kumagai, H. Mizuno, A. Miyawaki and K. Midorikawa, Background-free deep imaging by spatial overlap modulation nonlinear optical microscopy, Biomed. Opt. Express, 2012, 3, 1594–1608 CrossRef PubMed.
- A. Doi, R. Oketani, Y. Nawa and K. Fujita, High-resolution imaging in two-photon excitation microscopy using in situ estimations of the point spread function, Biomed. Opt. Express, 2017, 9, 202–213 CrossRef PubMed.
- S. Weiss, Shattering the diffraction limit of light: a revolution in fluorescence microscopy?, Proc. Natl. Acad. Sci. U. S. A., 2000, 97, 8747–8749 CrossRef CAS PubMed.
- T. Yoshitake, M. G. Giacomelli, L. C. Cahill, D. B. Schmolze, H. Vardeh, B. E. Faulkner-Jones, J. L. Connolly and J. G. Fujimoto, Direct comparison between confocal and multiphoton microscopy for rapid histopathological evaluation of unfixed human breast tissue, J. Biomed. Opt., 2016, 21, 126021 CrossRef PubMed.
- A. Diaspro, P. Bianchini, G. Vicidomini, M. Faretta, P. Ramoino and C. Usai, Multiphoton excitation microscopy, Biomed. Eng. Online, 2006, 5, 36 CrossRef PubMed.
- A. G. Godin, B. Lounis and L. Cognet, Super-resolution microscopy approaches for live cell imaging, Biophys. J., 2014, 107, 1777–1784 CrossRef CAS PubMed.
- B. Huang, M. Bates and X. Zhuang, Super-Resolution Fluorescence Microscopy, Annu. Rev. Biochem., 2009, 78, 993–1016 CrossRef CAS PubMed.
- L. Schermelleh, A. Ferrand, T. Huser, C. Eggeling, M. Sauer, O. Biehlmaier and G. P. C. Drummen, Super-resolution microscopy demystified, Nat. Cell Biol., 2019, 21, 72–84 CrossRef CAS PubMed.
- Z. Zeng, X. Chen, H. Wang, N. Huang, C. Shan, H. Zhang, J. Teng and P. Xi, Fast Super-Resolution Imaging with Ultra-High Labeling Density Achieved by Joint Tagging Super-Resolution Optical Fluctuation Imaging, Sci. Rep., 2015, 5, 8359 CrossRef CAS PubMed.
- X. Yang, K. Zhanghao, H. Wang, Y. Liu, F. Wang, X. Zhang, K. Shi, J. Gao, D. Jin and P. Xi, Versatile Application of Fluorescent Quantum Dot Labels in Super-resolution Fluorescence Microscopy, ACS Photonics, 2016, 3, 1611–1618 CrossRef CAS.
- J. Xu, K. F. Tehrani and P. Kner, Multicolor 3D Super-resolution Imaging by Quantum Dot Stochastic Optical Reconstruction Microscopy, ACS Nano, 2015, 9, 2917–2925 CrossRef CAS PubMed.
- P. Hoyer, T. Staudt, J. Engelhardt and S. W. Hell, Quantum Dot Blueing and Blinking Enables Fluorescence Nanoscopy, Nano Lett., 2011, 11, 245–250 CrossRef CAS PubMed.
- Q. Zhan, H. Liu, B. Wang, Q. Wu, R. Pu, C. Zhou, B. Huang, X. Peng, H. Ågren and S. He, Achieving high-efficiency emission depletion nanoscopy by employing cross relaxation in upconversion nanoparticles, Nat. Commun., 2017, 8, 1058 CrossRef PubMed.
- X.-W. Hua, Y.-W. Bao, J. Zeng and F.-G. Wu, Nucleolus-Targeted Red Emissive Carbon Dots with Polarity-Sensitive and Excitation-Independent Fluorescence Emission: High-Resolution Cell Imaging and in Vivo Tracking, ACS Appl. Mater. Interfaces, 2019, 11, 32647–32658 CrossRef CAS PubMed.
- H. He, X. Liu, S. Li, X. Wang, Q. Wang, J. Li, J. Wang, H. Ren, B. Ge, S. Wang, X. Zhang and F. Huang, High-Density Super-Resolution Localization Imaging with Blinking Carbon Dots, Anal. Chem., 2017, 89, 11831–11838 CrossRef CAS PubMed.
- X. Fang, X. Chen, R. Li, Z. Liu, H. Chen, Z. Sun, B. Ju, Y. Liu, S. X.-A. Zhang, D. Ding, Y. Sun and C. Wu, Multicolor Photo-Crosslinkable AIEgens toward Compact Nanodots for Subcellular Imaging and STED Nanoscopy, Small, 2017, 13, 1702128 CrossRef PubMed.
- X. Chen, Z. Liu, R. Li, C. Shan, Z. Zeng, B. Xue, W. Yuan, C. Mo, P. Xi, C. Wu and Y. Sun, Multicolor Super-resolution Fluorescence Microscopy with Blue and Carmine Small Photoblinking Polymer Dots, ACS Nano, 2017, 11, 8084–8091 CrossRef CAS PubMed.
- J. Hüve, R. Wesselmann, M. Kahms and R. Peters, 4Pi microscopy of the nuclear pore complex, Biophys. J., 2008, 95, 877–885 CrossRef PubMed.
- J. Heine, C. A. Wurm, J. Keller-Findeisen, A. Schönle, B. Harke, M. Reuss, F. R. Winter and G. Donnert, Three dimensional live-cell STED microscopy at increased depth using a water immersion objective, Rev. Sci. Instrum., 2018, 89, 053701 CrossRef PubMed.
- M. Bates, G. T. Dempsey, K. H. Chen and X. Zhuang, Multicolor super-resolution fluorescence imaging via multi-parameter fluorophore detection, ChemPhysChem, 2012, 13, 99–107 CrossRef CAS PubMed.
- D. Jin, P. Xi, B. Wang, L. Zhang, J. Enderlein and A. M. van Oijen, Nanoparticles for super-resolution microscopy and single-molecule tracking, Nat. Methods, 2018, 15, 415–423 CrossRef CAS PubMed.
- S. W. Hell, Nanoscopy with focused light, Ann. Phys., 2015, 527, 423–445 CrossRef CAS.
- Z. Liu, Luke D. Lavis and E. Betzig, Imaging Live-Cell Dynamics and Structure at the Single-Molecule Level, Mol. Cell, 2015, 58, 644–659 CrossRef CAS PubMed.
- H. Zhu, J. Fan, J. Du and X. Peng, Fluorescent Probes for Sensing and Imaging within Specific Cellular Organelles, Acc. Chem. Res., 2016, 49, 2115–2126 CrossRef CAS PubMed.
- Y.-L. Wang, C. Fan, B. Xin, J.-P. Zhang, T. Luo, Z.-Q. Chen, Q.-Y. Zhou, Q. Yu, X.-N. Li, Z.-L. Huang, C. Li, M.-Q. Zhu and B. Z. Tang, AIE-based super-resolution imaging probes for β-amyloid plaques in mouse brains, Mater. Chem. Front., 2018, 2, 1554–1562 RSC.
- L. Y. T. Chou, K. Ming and W. C. W. Chan, Strategies for the intracellular delivery of nanoparticles, Chem. Soc. Rev., 2011, 40, 233–245 RSC.
- C. Azevedo, M. H. Macedo and B. Sarmento, Strategies for the enhanced intracellular delivery of nanomaterials, Drug Discovery Today, 2018, 23, 944–959 CrossRef CAS PubMed.
- M. R. Mohammadi, A. Nojoomi, M. Mozafari, A. Dubnika, M. Inayathullah and J. Rajadas, Nanomaterials engineering for drug delivery: a hybridization approach, J. Mater. Chem. B, 2017, 5, 3995–4018 RSC.
- Y.-K. Tzeng, O. Faklaris, B.-M. Chang, Y. Kuo, J.-H. Hsu and H.-C. Chang, Superresolution Imaging of Albumin-Conjugated Fluorescent Nanodiamonds in Cells by Stimulated Emission Depletion, Angew. Chem., Int. Ed., 2011, 50, 2262–2265 CrossRef CAS PubMed.
- I. V. Martynenko, A. P. Litvin, F. Purcell-Milton, A. V. Baranov, A. V. Fedorov and Y. K. Gun'ko, Application of semiconductor quantum dots in bioimaging and biosensing, J. Mater. Chem. B, 2017, 5, 6701–6727 RSC.
- J. Zhou, Q. Liu, W. Feng, Y. Sun and F. Li, Upconversion Luminescent Materials: Advances and Applications, Chem. Rev., 2015, 115, 395–465 CrossRef CAS PubMed.
- Z. Li, L. Wang, Y. Li, Y. Feng and W. Feng, Frontiers in carbon dots: design, properties and applications, Mater. Chem. Front., 2019, 3, 2571–2601 RSC.
- W. Su, H. Wu, H. Xu, Y. Zhang, Y. Li, X. Li and L. Fan, Carbon dots: a booming material for biomedical applications, Mater. Chem. Front., 2020, 4, 821–836 RSC.
- G. Huszka and M. A. M. Gijs, Super-resolution optical imaging: A comparison, Micro Nano Eng., 2019, 2, 7–28 CrossRef.
- S. B. Rizvi, S. Ghaderi, M. Keshtgar and A. M. Seifalian, Semiconductor quantum dots as fluorescent probes for in vitro and in vivo bio-molecular and cellular imaging, Nano Rev., 2010, 1 DOI:10.3402/nano.v3401i3400.5161..
- G. Patterson, M. Davidson, S. Manley and J. Lippincott-Schwartz, Superresolution imaging using single-molecule localization, Annu. Rev. Phys. Chem., 2010, 61, 345–367 CrossRef CAS PubMed.
- K. T. Stein, S. J. Moon and H. D. Sikes, Mitochondrial H2O2 Generation Using a Tunable Chemogenetic Tool To Perturb Redox Homeostasis in Human Cells and Induce Cell Death, ACS Synth. Biol., 2018, 7, 2037–2044 CrossRef CAS PubMed.
- X. Zhu, Q. Su, W. Feng and F. Li, Anti-Stokes shift luminescent materials for bio-applications, Chem. Soc. Rev., 2017, 46, 1025–1039 RSC.
- S. Xie, C. Tong, H. Tan, N. Li, L. Gong, J. Xu, L. Xu and C. Zhang, Hydrothermal synthesis and inkjet printing of hexagonal-phase NaYF4:Ln3+ upconversion hollow microtubes for smart anti-counterfeiting encryption, Mater. Chem. Front., 2018, 2, 1997–2005 RSC.
- W. Zheng, B. Sun, Y. Li, R. Wang and Y. Xu, Multicolor tunable luminescence and laser-sensitization induced upconversion enhancement in Ln-doped Gd2O3 crystals for anti-counterfeiting, Mater. Chem. Front., 2019, 3, 2403–2413 RSC.
- S. Gan, J. Zhou, T. A. Smith, H. Su, W. Luo, Y. Hong, Z. Zhao and B. Z. Tang, New AIEgens with delayed fluorescence for fluorescence imaging and fluorescence lifetime imaging of living cells, Mater. Chem. Front., 2017, 1, 2554–2558 RSC.
- M. Wojnilowicz, A. Glab, A. Bertucci, F. Caruso and F. Cavalieri, Super-resolution Imaging of Proton Sponge-Triggered Rupture of Endosomes and Cytosolic Release of Small Interfering RNA, ACS Nano, 2019, 13, 187–202 CrossRef CAS PubMed.
- D. van der Zwaag, N. Vanparijs, S. Wijnands, R. De Rycke, B. G. De Geest and L. Albertazzi, Super Resolution Imaging of Nanoparticles Cellular Uptake and Trafficking, ACS Appl. Mater. Interfaces, 2016, 8, 6391–6399 CrossRef CAS PubMed.
- L. Shang, P. Gao, H. Wang, R. Popescu, D. Gerthsen and G. U. Nienhaus, Protein-based fluorescent nanoparticles for super-resolution STED imaging of live cells, Chem. Sci., 2017, 8, 2396–2400 RSC.
- N. Feiner-Gracia, R. A. Olea, R. Fitzner, N. El Boujnouni, A. H. van Asbeck, R. Brock and L. Albertazzi, Super-resolution Imaging of Structure, Molecular Composition, and Stability of Single Oligonucleotide Polyplexes, Nano Lett., 2019, 19, 2784–2792 CrossRef CAS PubMed.
- X. Chen, J. Cui, H. Sun, M. Müllner, Y. Yan, K. F. Noi, Y. Ping and F. Caruso, Analysing intracellular deformation of polymer capsules using structured illumination microscopy, Nanoscale, 2016, 8, 11924–11931 RSC.
- W. G. J. H. M. van Sark, P. L. T. M. Frederix, A. A. Bol, H. C. Gerritsen and A. Meijerink, Blueing, Bleaching, and Blinking of Single CdSe/ZnS Quantum Dots, ChemPhysChem, 2002, 3, 871–879 CrossRef CAS.
- B. Zhi, Y. Cui, S. Wang, B. P. Frank, D. N. Williams, R. P. Brown, E. S. Melby, R. J. Hamers, Z. Rosenzweig, D. H. Fairbrother, G. Orr and C. L. Haynes, Malic Acid Carbon Dots: From Super-resolution Live-Cell Imaging to Highly Efficient Separation, ACS Nano, 2018, 12, 5741–5752 CrossRef CAS PubMed.
- X. Chen, R. Li, Z. Liu, K. Sun, Z. Sun, D. Chen, G. Xu, P. Xi, C. Wu and Y. Sun, Small Photoblinking Semiconductor Polymer Dots for Fluorescence Nanoscopy, Adv. Mater., 2017, 29, 1604850 CrossRef PubMed.
- A. M. Chizhik, S. Stein, M. O. Dekaliuk, C. Battle, W. Li, A. Huss, M. Platen, I. A. T. Schaap, I. Gregor, A. P. Demchenko, C. F. Schmidt, J. Enderlein and A. I. Chizhik, Super-Resolution Optical Fluctuation Bio-Imaging with Dual-Color Carbon Nanodots, Nano Lett., 2016, 16, 237–242 CrossRef CAS PubMed.
- H. Singh, S. Sreedharan, K. Tiwari, N. H. Green, C. Smythe, S. K. Pramanik, J. A. Thomas and A. Das, Two photon excitable graphene quantum dots for structured illumination microscopy and imaging applications: lysosome specificity and tissue-dependent imaging, Chem. Commun., 2019, 55, 521–524 RSC.
- S. K. Pramanik, S. Sreedharan, H. Singh, N. H. Green, C. Smythe, J. A. Thomas and A. Das, Imaging cellular trafficking processes in real time using lysosome targeted up-conversion nanoparticles, Chem. Commun., 2017, 53, 12672–12675 RSC.
- H. Singh, S. Sreedharan, E. Oyarzabal, T. Singha Mahapatra, N. Green, S. Yen-Yu Ian, M. Das, J. A. Thomas, S. K. Pramanik and A. Das, Mitochondriotropic Lanthanide Nanorods: Implications for Multimodal Imaging, Chem. Commun., 2020, 56, 7945–7948 RSC.
- S. Khan, N. C. Verma, Chethana and C. K. Nandi, Carbon Dots for Single-Molecule Imaging of the Nucleolus, ACS Appl. Nano Mater., 2018, 1, 483–487 CrossRef CAS.
- S. K. Pramanik, S. Sreedharan, H. Singh, M. Khan, K. Tiwari, A. Shiras, C. Smythe, J. A. Thomas and A. Das, Mitochondria Targeting Non-Isocyanate-Based Polyurethane Nanocapsules for Enzyme-Triggered Drug Release, Bioconjugate Chem., 2018, 29, 3532–3543 CrossRef CAS PubMed.
Footnote |
| † These author contributed equally to this work. |
| This journal is © the Partner Organisations 2021 |