 Open Access Article
Creative Commons Attribution 3.0 Unported Licence
VRAI-selectivity: calculation of selectivity beyond transition state theory†
Sanha
Lee
 and
Jonathan M.
Goodman
 *
*
Yusuf Hamied Department of Chemistry, University of Cambridge, Lensfield Road, Cambridge, CB2 1EW, UK. E-mail: jmg11@cam.ac.uk
First published on 6th April 2021
Abstract
In recent years, a growing number of organic reactions in the literature have shown selectivity controlled by reaction dynamics rather than by transition state theory. Such reactions are difficult to analyse because the transition state theory approach often does not capture the subtlety of the energy landscapes the compounds traverse and, therefore, cannot accurately predict the selectivity. We present an algorithm that can predict the major product and selectivity for a wide range of potential energy surfaces where the product distribution is influenced by reaction dynamics. The method requires as input calculation of the transition states, the intermediate (if present) and the product geometries. The algorithm is quick and simple to run and, except for two reactions with long alkyl chains, calculates selectivity more accurately than transition state theory alone.
Introduction
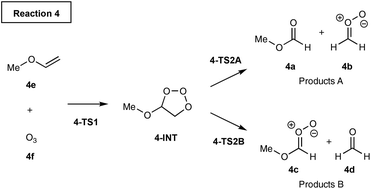
Transition State Theory (TST)1,2 is widely used to predict selectivity for kinetically controlled chemical reactions. For reactions that produce two products by separate pathways, calculating the free energy of activation for each pathway gives a straightforward measure of the selectivity. Selectivity can be quantified by calculating the activation free energies and determining the product ratio from the rates for each competing reaction pathway.3 One key assumption of TST is that the timescale for the barrier crossing is slower than the intramolecular vibrational energy redistribution. Although this approximation is valid for many organic reactions, there are several examples in the literature for which the barrier crossing is faster than the vibrational redistribution. The selectivity in such reactions is governed by nonstatistical dynamics.4,5For example, Singleton et al. discovered the experimental product ratios in ozonolysis of alkyl vinyl ethers do not fit the predictions based on the transition state theory, Scheme 1.6 Mechanistically, the vinyl ether 4e and O3 react together to form the intermediate 4-INT. The intermediate can either fragment to products 4a and 4bvia TS2A or 4c and 4dvia TS2B. Singleton et al. discovered the comparison of barrier heights of TS2A and TS2B would predict the A/B ratio to be more than three orders of magnitude higher than the experimentally observed product distributions. The unexpected selectivity arises because the intermediate formed from TS1 has enough excess energy to favour the cleavage leading to products B over A. Therefore, TST does not give an accurate product ratio prediction.
The importance of reaction dynamics has been highlighted in many other organic reactions. In bifurcating reactions, a single TS is shared by two or more reaction pathways leading to different products. The product distribution is then governed by the shape of the potential energy surface (PES) and the resulting dynamic effects.7,8 Reactions with very shallow intermediates on the PES can also show selectivity dependent on nonstatistical dynamics. Examples of well-known organic reactions showing such behaviour include hydroboration,9,10 C2–C6 cyclisation,11 Garratt-Braverman cyclisations,12 and ketene cycloadditions.13 Shallow intermediates on a single reaction profile can also lead to multiple reaction paths due to the ‘concerted components’ and ‘stepwise components’. Acetone radical cation fragmentation,14 1,2,6-heptatriene rearrangement,15 cope rearrangement of 1,5-hexadiene16 and triplet di-π-methane rearrangement17 are examples showing this behaviour. Reactions involving a flat region on the PES called a ‘caldera’ also show dynamically controlled selectivities.18,19 Finally, Merrer et al. found the reaction between dichlorocarbene and 1,2-disubstituted cyclopropenes preferred the thermodynamically unfavoured reaction pathway due to the conservation of momentum.20
We have previously developed an algorithm ‘ValleyRidge.py’ which can quickly predict selectivity for organic reaction proceeding on bifurcating potential energy surfaces.21 The algorithm achieves this by importing the transition states and the product geometries and reducing the dimensionality of the PES by identifying the key bond difference between the products. The major product is determined by analysing the direction the imaginary eigenvector of the first transition state (TS1) points on the ridge. Finally, the product ratios are calculated using the harmonic approximation on the first transition state real normal modes.
ValleyRidge.py was developed for bifurcating organic reactions with a valley-ridge inflection point (VRI) on the PES, Fig. 1a. However, the study by Singleton et al.13 motivated us to investigate how this algorithm could be extended beyond these applications to PES without a VRI. When the cycloaddition of dichloroketene is modelled using the MPW1K functional, the reaction path does bifurcate as shown in Fig. 1a. When the same reaction is modelled using the B3LYP functional, a shallow intermediate is now present between the two products as illustrated. However, the reaction trajectories can easily bypass this shallow intermediate to form the products directly from TS1. Our new algorithm is able to predict the selectivity in such circumstances and to a range of other PES types with the selectivity controlled by nonstatistical dynamics.
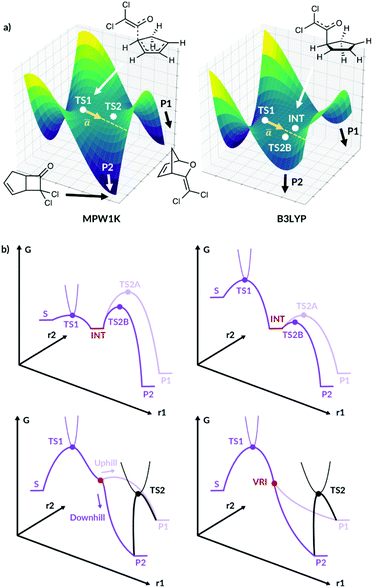 | ||
| Fig. 1 (a) The qualitative PES for cycloaddition of dichloroketene modelled by Singleton et al.13 for the MPW1K surface and the B3LYP surface. P1 and P2 are the two products, INT is the intermediate and ā is the imaginary eigenvector of TS1. (b) Fourty. | ||
We present this new algorithm, Valley Ridge Augmented Implementation Selectivity (VRAI-selectivity), which can model reactions with a shallow intermediate and diverging reaction pathways, as well as TST-controlled reactions. We summarise the different PES VRAI-selectivity can model in Fig. 1b.
Results and discussion
Algorithm changes and summary
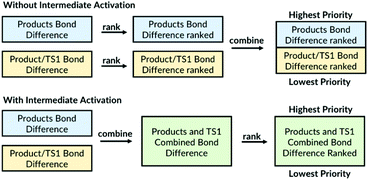
The VRAI-selectivity algorithm makes it possible to model reactions with shallow intermediates. The key step in the previous algorithm was reducing the dimensionality of the PES to two dimensions. This was achieved by examining the bond differences between the products and selecting the bonds that do not exist in both geometries as the first priority. When more than one bond-difference pair exists, the bond pair combinations are ranked following prioritisation rules and the bond pair with the highest rank is chosen. For cases where only one bond difference exists between the products, the algorithm searches for the bond difference between the products and the first transition state. The new algorithm has an ‘intermediate activation’ option for modelling reactions with shallow intermediates. The activation now assigns same level of priority to bond differences between the products and to bond differences between the products and the transition state (Fig. 2). We found the performance of the algorithm is superior for reactions with shallow intermediates when the dimensionality is reduced using the bond differences between the products and TS1 (see ESI, section 7†). When the intermediate option is used, the user should input the intermediate geometries as well as the TS1 and the two product geometries. The detailed user manual is provided in ESI, section 5.† The remaining selectivity prediction method is kept the same as the original.Importantly, the algorithm automatically picks out the bond differences and, thus, the dimensionality reduction does not require any user input.21 When different users model the same reaction, this ensures that the same set of bond differences are always used.
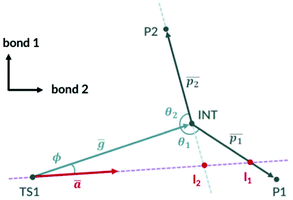
The simplified 2D PES diagram for Fig. 1a, B3LYP PES with a shallow intermediate, is shown in Fig. 3. If we let vector ḡ be the separation of the intermediate from TS1, the angle ϕ becomes the angle the imaginary eigenvector of TS1 (ā) makes with vector ḡ. We can define vectors  and
and  to be the displacement vectors from TS2 to product 1 and product 2, respectively. By defining the product vectors, θ1 becomes the angle vector −ḡ makes with vector
  (product vector on the side of ḡ that vector ā points directly) and θ2 becomes the angle −ḡ makes with product vector
  on the opposite side of vector
  . VRAI-selectivity rejects the bond difference pair if ϕ is less than 0.1 degrees and selects the next highest pair in the rank. Qualitatively, the algorithm examines which side of the intermediate the imaginary eigenvector of TS1 points to decide the major product. The harmonic oscillator approximation is then used on the real eigenvectors of TS1 to estimate the width of the trajectory stream. The selectivity of the reaction is then estimated by considering the point of the closest approach of the intermediate and how much of the trajectory stream favour each product. We have found a strong linear correlation between the prediction error and [ϕ + (π − θ2)] (see ESI, section 4†). We use this relationship to correct the predicted selectivity. We will discuss all the reasons for these changes from the earlier algorithm in the following sections.
Reactions with shallow intermediates
The calculated energy profile for the two reactions modelled from Singleton et al.13 at B3LYP/6-31G(d) level of theory is shown in Fig. 4. The dichloroketene reaction has a large 12.6 kJ mol−1 drop in energy from TS1, leaving the intermediate with some excess energy. The following two transition states for [4 + 2] and [2 + 2] reactions have very similar barrier heights at 5.2 and 4.9 kJ mol−1, respectively. The TST theory would predict the major product selectivity to be 52.4%, which is well off from the MD trajectory prediction of 83.3%. As we are considering the B3LYP PES, we have compared our results to Singleton's MD simulations at B3LYP/6-31G(d) level of theory. We modelled the same reaction using the VRAI-selectivity with the intermediate activation option. The predicted selectivity is 82.9%, performing significantly better than the TST result. Therefore, the dynamic effects are likely to be significant in this reaction. When these reactions are modelled using the mPW1K functional, the PES bifurcates and we have already shown that ValleyRidge.py algorithm can predict these selectivities well.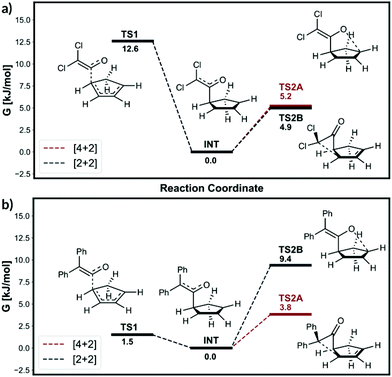 | ||
| Fig. 4 Energy profile from Singleton et al. 200613 study at B3LYP/6-31G(d) level. | ||
The free energy profile for the diphenylketene reactant shows different characteristics to the dichloroketene case (Fig. 4b). The free energy drop from TS1 is smaller at 1.5 kJ mol−1. Furthermore, the barrier height for [4 + 2] and [2 + 2] additions are significantly higher than the 1.5 kJ mol−1 free energy gained from intermediate formation at 3.8 and 9.4 kJ mol−1 respectively. In such circumstances, we would expect the intermediate will be sufficiently relaxed before proceeding over TS2 and the dynamic effects will be negligible. VRAI-selectivity therefore, uses the free energy difference between the TS2A and TS2B to calculate the selectivity using the TST. The [4 + 2] addition product is predicted to be the major product with 90.4% selectivity. The MD prediction at B3LYP/6-31G(d) level is 85.7% and therefore VRAI-selectivity is able to replicate the MD ratio.
The results show two important conclusions. For nonstatistical predictions from VRAI-selectivity to be valid
1. The energy drop from TS1 should be sufficiently large that the intermediates gain significant energy.
2. The barriers for the subsequent reactions are small relative to the energy drop from TS1 and, therefore, the trajectories pass over the intermediates easily and the dynamic effects dominate.
For all the reactions we have analysed, if TS2A and TS2B are both lower in free energy than TS1 by more than 6.6 kJ mol−1, the dynamics analysis gives the correct selectivity predictions (see ESI, section 6†). We therefore approximate the behaviour of the molecules to be Arrhenius and the algorithm decides whether to use TST or the dynamics based on the barrier height difference between TS1 and the two TS2s. If either of the TS2 barrier heights is greater than TS1 free energy minus 5 kJ mol−1, the algorithm will use TST analysis to predict the selectivity. Otherwise, VRAI-selectivity will output the nonstatistical selectivity analysis as seen from dichloroketene example.
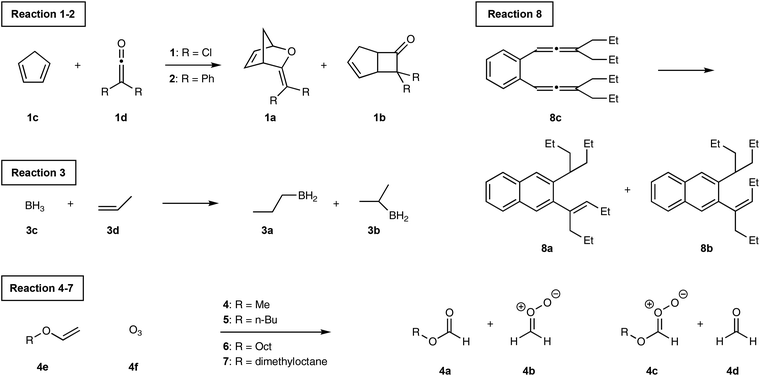
Considerable dynamic effects are observed in the hydroboration reaction studied by Singleton et al.9 (Scheme 2, reaction (3)). Truhlar et al. have reported a qualitative theory to account for the selectivity.22 The intermediate in this reaction is the reactive complex formed by molecules 3c and 3d coming together. Singleton et al. found the formation of the intermediate is barrierless on the enthalpic surface but does have a barrier on the free energy surface. Locating such point on the free energy surface is difficult. We therefore decided the TS1 geometry should simply be the free energy barrier geometry quoted by Singleton et al. The frequency calculation on this structure shows two imaginary frequencies. Performing the bond length constrained optimisation removes one of the imaginary frequencies as the alkene and the BH3 became staggered from eclipsed, Fig. 5. However, we believe the eclipsed structure is better because the IRC calculation required fewer steps and showed a smoother profile (see ESI, section 3†).
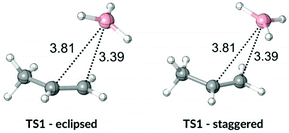 | ||
| Fig. 5 Eclipsed and staggered TS1 geometries from Singleton et al. 2009.9 | ||
The computed energy profile showed a significant free energy drop of 19.7 kJ mol−1 from the eclipsed TS1 geometry to the intermediate complex. The subsequent anti-Markovnikov and Markovnikov activation barriers are 2.9 and 13.0 kJ mol−1 respectively. The TST selectivity for anti-Markovnikov product is 98.3%, higher than the MD simulation predicted 90.0%. Expressing the product selectivity as ratio highlights the difference better as TST ratio is 59![[thin space (1/6-em)]](https://www.rsc.org/images/entities/char_2009.gif) :
:![[thin space (1/6-em)]](https://www.rsc.org/images/entities/char_2009.gif) 1 whereas the MD ratio is 9
1 whereas the MD ratio is 9![[thin space (1/6-em)]](https://www.rsc.org/images/entities/char_2009.gif) :
:![[thin space (1/6-em)]](https://www.rsc.org/images/entities/char_2009.gif) 1. The VRAI-selectivity prediction for anti-Markovnikov product is 91.4% with the intermediate activation, showing a better agreement with the MD simulation results.
1. The VRAI-selectivity prediction for anti-Markovnikov product is 91.4% with the intermediate activation, showing a better agreement with the MD simulation results.
As previously outlined, the MD study of ozonolysis reaction by Singleton et al.6 (reactions (4)–(7), Scheme 2) found that the experimental product ratios do not fit the expectations based on the TST. We investigated the same reaction and the calculated the energy profile for reaction (4) is shown in Fig. 6. The free energy drop from TS1 to INT is very large at 223.0 kJ mol−1. The barriers for fragmentation steps are less than a third of the energy gained by the intermediate and, therefore, dynamic effects are likely to prevail. The energy difference in subsequent fragmentation transition states is fairly large at 21.6 kJ mol−1 and TST would predict the major product ratio to be over 6000![[thin space (1/6-em)]](https://www.rsc.org/images/entities/char_2009.gif) :
:![[thin space (1/6-em)]](https://www.rsc.org/images/entities/char_2009.gif) 1. This prediction is much higher than the experimental selectivity of 96.3%. The VRAI-selectivity predicts the major product selectivity to be 97.1%, in better agreement with the experimental result.
1. This prediction is much higher than the experimental selectivity of 96.3%. The VRAI-selectivity predicts the major product selectivity to be 97.1%, in better agreement with the experimental result.
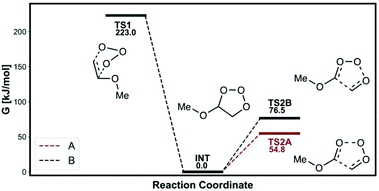 | ||
| Fig. 6 Energy profile from Singleton et al. 20116 (reaction (4)). | ||
We then explored the effect of the chain length on the selectivity prediction. The modification of the R group to butyl, octyl and dimethyl octyl groups does not change the free energy drop from TS1 significantly since the values were 221.7, 221.7 and 221.8 kJ mol−1 respectively. The difference in TS2A and TS2B free energy gap does not change significantly either and the values were 19.0 kJ mol−1, 19.0 kJ mol−1 and 18.9 kJ mol−1 for butyl, octyl and dimethyloctyl groups respectively. The TST selectivity prediction still remains very high above 2000![[thin space (1/6-em)]](https://www.rsc.org/images/entities/char_2009.gif) :
:![[thin space (1/6-em)]](https://www.rsc.org/images/entities/char_2009.gif) 1.
1.
Modifying the R group from methyl to butyl does not change the experimental selectivity much. The VRAI-selectivity predicts the major product selectivity to be 95.0%, again showing a good agreement with the experimental 97.8%. Modifying the R group to octyl and dimethyl octyl groups increases the experimental selectivity to 98.2% and 98.3%, respectively. The high frequency vibrations in such reactions with long alkyl chains have very small real eigenvector components. We therefore modelled the octyl and the dimethyl octyl group reaction with VRAI-selectivity but ignored the real eigenvector components that have zero components up to 5 decimal places. The VRAI-selectivity results are less successful for these reactions since the product selectivity are predicted to be 88.7% and 89.0% for octyl and dimethyl octyl groups respectively. The long chain molecules have more normal modes, and so TS1 is broader. Following the VRAI-selectivity analysis, this leads to a lower selectivity. The experimental results have higher selectivity, suggesting a switch from the non-statistical process back to a TST controlled process because the relaxation of the intermediate is faster. Capturing the effect of the long alkane chain on the selectivity is currently beyond the capability of the algorithm but is something we are looking to investigate in our future work.
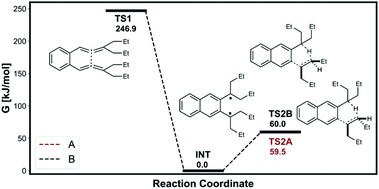
Schmittel et al.12 found significant nonstatistical dynamic effects in [1,5]-H shift of 8c (reaction (8)). We investigated the same reaction and the calculated energy profile is shown in Fig. 7. The intermediate, TS1 and the H-transfer TSs were modelled as triplet states using the UB3LYP open shell method. The intermediate would have plenty of excess energy from the 246.9 kJ mol−1 free energy drop from TS1. The Z-alkene forming H-transfer TS (TS2A) has slightly lower free energy barrier than E-alkene forming H-transfer TS. Therefore, TST would incorrectly predict the major product to be the Z-alkene. Furthermore, the free energy difference between the H-transfer TSs is very small at 0.5 kJ mol−1. The predicted TST major product percentage would be 45.0%, long way off from the experimental 91.1%. The VRAI-selectivity on the other hand correctly predicts the E-alkene major product with 92.2% selectivity. Therefore, the VRAI-selectivity result has better agreement with the experimental outcome.
Bifurcation on single minimum energy pathway
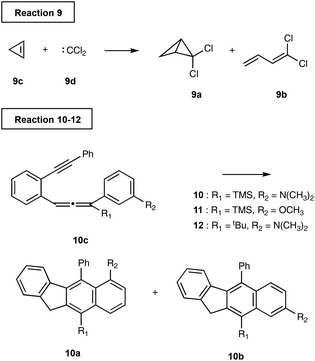
Merrer et al.20 investigated the reaction between 1,2-disubstituted cyclopropenes and dichlorocarbene which forms either cyclobutenes or butadienes, Scheme 3. After passing the first transition state (TS1), the minimum energy path (MEP) reaches the bifurcation point. One of the reaction paths continues to proceed via descending path towards the butadiene product. The other reaction path crosses a small barrier from the bifurcation point and then descends to the less stable bicyclobutane product. However, the bicyclobutane product is on the direct line with TS1 whereas the reaction trajectory must change the momentum at the bifurcation point in order to reach the thermodynamically preferred butadiene product. Therefore, the experimentally observed major product is the bicyclobutane with 80![[thin space (1/6-em)]](https://www.rsc.org/images/entities/char_2009.gif) :
:![[thin space (1/6-em)]](https://www.rsc.org/images/entities/char_2009.gif) 20 ratio23 since the reaction trajectories prefers to conserve the momentum.
20 ratio23 since the reaction trajectories prefers to conserve the momentum.
We modelled the reaction using the VRAI-selectivity code without the intermediate activation. We used the TS connecting the bicyclobutane and butadiene product as the TS2 geometry since no stationary point is present at the branching point. The algorithm predicted the bicyclobutane to be the major product with 86![[thin space (1/6-em)]](https://www.rsc.org/images/entities/char_2009.gif) :
:![[thin space (1/6-em)]](https://www.rsc.org/images/entities/char_2009.gif) 14 ratio, showing a good agreement with the experimental results.
14 ratio, showing a good agreement with the experimental results.
Reaction with multiple pathways to the intermediate
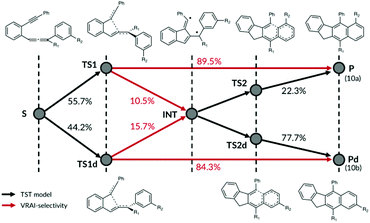
The computational investigation of C2–C6/DA cyclisation of 10c by Schmittel et al.24 revealed nonstatistical behaviour dependent on the substituents R1 and R2. The inspection of the PES showed two independent reaction paths from the starting material that share a common intermediate well, Fig. 8. A certain proportion of the reaction trajectories crossing the transition state TS1 will go directly to the product P (10a), whereas the remaining trajectories will enter the intermediate well and relax. The relaxed molecules will then diverge to either P or Pd (10b) via TS2 or TS2d respectively. Comparatively, the trajectories crossing TS1d can go directly to Pd or the intermediate well.We modelled this reaction using a combination of TST and VRAI-selectivity method without intermediate activation. The proportion of the reaction trajectory passing over TS1 and TS1d is estimated using the transition state theory. The increase in free energy going from the starting material to TS1 and TS1d is 84.0 and 84.6 kJ mol−1 respectively for reaction (10). Therefore, the use of TST is justifiable. The proportion of the reaction trajectories passing through TS1 reaching directly the products is then estimated using VRAI-selectivity. For reaction (2), 89.5% of the molecules are estimated to go directly from TS1 to 10a and remaining 10.5% will reach the intermediate. Applying VRAI-selectivity to TS1d estimated 84.3% of the trajectories to reach 10b directly whereas the remaining 15.7% will fall into the intermediate well. Finally, we used TST to estimate the proportion of the molecules in the intermediate well that will reach 10a by TS2 and 10b by TS2d. The intermediate should be sufficiently relaxed because the barrier heights of TS2A and TS2B are very similar to the free energy drop from TS1 to the intermediate.
The starting material can reach product 10a by three possible paths: [S → TS1 → P], [S → TS1 → INT → TS2 → P] or [S → TS1d → INT → TS2 → P]. We calculated the percentage of the trajectories reaching 10a by multiplying the probabilities at each stage and summing over the three possible routes. The method then predicts the 10a![[thin space (1/6-em)]](https://www.rsc.org/images/entities/char_2009.gif) :
:![[thin space (1/6-em)]](https://www.rsc.org/images/entities/char_2009.gif) 10b ratio to be 53
10b ratio to be 53![[thin space (1/6-em)]](https://www.rsc.org/images/entities/char_2009.gif) :
:![[thin space (1/6-em)]](https://www.rsc.org/images/entities/char_2009.gif) 47 which is in good agreement with the experimentally observed ratio of 60
47 which is in good agreement with the experimentally observed ratio of 60![[thin space (1/6-em)]](https://www.rsc.org/images/entities/char_2009.gif) :
:![[thin space (1/6-em)]](https://www.rsc.org/images/entities/char_2009.gif) 40. The experimental selectivity increases for reactions (11) and (12) as 11a
40. The experimental selectivity increases for reactions (11) and (12) as 11a![[thin space (1/6-em)]](https://www.rsc.org/images/entities/char_2009.gif) :
:![[thin space (1/6-em)]](https://www.rsc.org/images/entities/char_2009.gif) 11b ratio is 63
11b ratio is 63![[thin space (1/6-em)]](https://www.rsc.org/images/entities/char_2009.gif) :
:![[thin space (1/6-em)]](https://www.rsc.org/images/entities/char_2009.gif) 37 and 12a
37 and 12a![[thin space (1/6-em)]](https://www.rsc.org/images/entities/char_2009.gif) :
:![[thin space (1/6-em)]](https://www.rsc.org/images/entities/char_2009.gif) 12b ratio is 71
12b ratio is 71![[thin space (1/6-em)]](https://www.rsc.org/images/entities/char_2009.gif) :
:![[thin space (1/6-em)]](https://www.rsc.org/images/entities/char_2009.gif) 29. Our analysis predicted the 11a
29. Our analysis predicted the 11a![[thin space (1/6-em)]](https://www.rsc.org/images/entities/char_2009.gif) :
:![[thin space (1/6-em)]](https://www.rsc.org/images/entities/char_2009.gif) 11b ratio to be 64
11b ratio to be 64![[thin space (1/6-em)]](https://www.rsc.org/images/entities/char_2009.gif) :
:![[thin space (1/6-em)]](https://www.rsc.org/images/entities/char_2009.gif) 36 and 12a
36 and 12a![[thin space (1/6-em)]](https://www.rsc.org/images/entities/char_2009.gif) :
:![[thin space (1/6-em)]](https://www.rsc.org/images/entities/char_2009.gif) 12b ratio to be 74
12b ratio to be 74![[thin space (1/6-em)]](https://www.rsc.org/images/entities/char_2009.gif) :
:![[thin space (1/6-em)]](https://www.rsc.org/images/entities/char_2009.gif) 26. Therefore, VRAI-selectivity is able to predict the selectivity as well as the experimental trend as the R groups are changed.
26. Therefore, VRAI-selectivity is able to predict the selectivity as well as the experimental trend as the R groups are changed.
In Fig. 1b, we previously summarised the four types of potential energy surfaces for which VRAI-selectivity analysis can correctly predict the selectivity. The first case is when the free energy drop from TS1 is small and both TS2A and TS2B have high barriers from the intermediate. The VRAI-selectivity selects TST to predict the selectivity as explained for the Singleton et al. diphenylketene example. VRAI-selectivity is also able to analyse the selectivity for PES of type (a) if TS1 is not present and the starting material connects the two products via TS2A and TS2B. The algorithm would simply use TST, only requiring TS2A and TS2B data as the input. The second case is when the free energy drop from TS1 is large and the intermediate has sufficient excess energy to go over the TS2 barriers. The selectivity is then controlled by the dynamic effects and TST often cannot predict the selectivity accurately. The VRAI-selectivity approach can accurately predict the MD and the experimental selectivity, Table 1. The third type of potential energy surface is the Merrer et al. example where the minimum energy path does not connect TS1 to the major product. TST approach is not applicable for such PES since no intermediate is present. However, VRAI-selectivity analysis can predict the correct selectivity. The final type of PES is bifurcating reaction profile. TST is again not applicable for such PES. However, the VRAI-selectivity analysis predicts the correct major product and the selectivity using the TS2 geometry instead of the intermediate geometry. VRAI-selectivity can, therefore, analyse selectivity on PES for which TST is applicable as well as other types of PES where TST will not give a correct outcome.
| Study | Reaction | Exp/Traj % | TST % | VRAI % |
|---|---|---|---|---|
Singleton 2006![[thin space (1/6-em)]](https://www.rsc.org/images/entities/char_2009.gif) 13 13 |
Cl | 83.3 | 52.4 | 82.9 |
Singleton 2006![[thin space (1/6-em)]](https://www.rsc.org/images/entities/char_2009.gif) 13 13 |
Ph | 85.7 | 90.4 | 90.4 |
Singleton 2009![[thin space (1/6-em)]](https://www.rsc.org/images/entities/char_2009.gif) 9 9 |
B | 90.0 | 98.3 | 91.4 |
Singleton 2011![[thin space (1/6-em)]](https://www.rsc.org/images/entities/char_2009.gif) 6 6 |
Me | 96.4 | 100.0 | 97.1 |
Singleton 2011![[thin space (1/6-em)]](https://www.rsc.org/images/entities/char_2009.gif) 6 6 |
But | 97.8 | 100.0 | 95.0 |
Singleton 2011![[thin space (1/6-em)]](https://www.rsc.org/images/entities/char_2009.gif) 6 6 |
Oct | 98.2 | 100.0 | 88.8 |
Singleton 2011![[thin space (1/6-em)]](https://www.rsc.org/images/entities/char_2009.gif) 6 6 |
DimeOct | 98.3 | 100.0 | 89.1 |
Schmittel 2014A![[thin space (1/6-em)]](https://www.rsc.org/images/entities/char_2009.gif) 12 12 |
Triplet | 91.1 | 100.0 | 92.2 |
Merrer 2005![[thin space (1/6-em)]](https://www.rsc.org/images/entities/char_2009.gif) 20 20 |
Cl | 80.0 | 0.0 | 85.5 |
Schmittel 2014![[thin space (1/6-em)]](https://www.rsc.org/images/entities/char_2009.gif) 24 24 |
TSM/N(CH3)2 | 59.7 | 42.5 | 52.7 |
Schmittel 2014![[thin space (1/6-em)]](https://www.rsc.org/images/entities/char_2009.gif) 24 24 |
TMS/OCH3 | 63.2 | 58.7 | 63.3 |
Schmittel 2014![[thin space (1/6-em)]](https://www.rsc.org/images/entities/char_2009.gif) 24 24 |
t Bu/N(CH3)2 | 71.4 | 44.7 | 72.2 |
Conclusions
We present a new algorithm, VRAI-selectivity, that can predict the product ratios for a variety of potential energy surface types including bifurcating organic reactions. We have demonstrated that the algorithm works well for reactions with paths splitting from an intermediate, provided the free energy drop from the first transition state to the intermediate is large and the intermediate is shallow on the potential energy surface. The algorithm has successfully predicted the major product and the ratio for all the reactions studied. The correction for nonstatistical effects gives more accurate results that transition state theory alone, except for the two processes with long alkyl chains. For the reactions where the nonstatistical selectivity tests are not satisfied, VRAI-selectivity uses TST to predict the selectivity. We also demonstrated the application of the algorithm to bifurcation on a single minimum energy pathway and reactions with multiple pathways to the intermediate. The major advantage of VRAI-selectivity is that the calculation requires a fraction of a time needed for molecular dynamics simulation methods and can predict the correct results for potential energy surfaces where TST cannot be used. VRAI-selectivity allows facile prediction and analysis of subtle reaction processes in a way that TST or a simple bifurcating reaction analysis cannot provide.The latest version of VRAI-selectivity script is available for download on GitHub (https://github.com/sanha0213/VRAI-selectivity).
Computational methods
All quantum mechanical calculations were performed using the Gaussian 16 package.25 The geometry optimisation and the frequency calculations were performed using the theoretical methods published in the original works. The initial optimisation geometries were also taken from the original works. The full list of computational methods used are provided in ESI, section 2.† The frequency calculations were performed on all stationary points to ensure the geometries were optimised to the minima or the saddle point.Conflicts of interest
There are no conflicts of interest.Acknowledgements
We are grateful to Trinity College, University of Cambridge, for their financial support of this research. This work was performed using resources provided by the Cambridge Service for Data Driven Discovery (CSD3), operated by the University of Cambridge Research Computing Service (http://www.csd3.cam.ac.uk), provided by Dell EMC and Intel using Tier-2 funding from the Engineering and Physical Sciences Research Council (capital grant EP/P020259/1) and DiRAC funding from the Science and Technology Facilities Council (http://www.dirac.ac.uk). We would also like to thank N. Y. S. Lam and M. J. Anketell for their helpful discussions.Notes and references
- H. Eyring, J. Chem. Phys., 1934, 3, 107–115 CrossRef.
- E. Wigner, Trans. Faraday Soc., 1938, 34, 29–41 RSC.
- Q. Peng, F. Duarte and R. S. Paton, Chem. Soc. Rev., 2016, 45, 6093–6107 RSC.
- B. K. Carpenter, Chem. Rev., 2013, 113, 7265–7286 CrossRef CAS PubMed.
- J. Rehbein and B. K. Carpenter, Phys. Chem. Chem. Phys., 2011, 13, 20906–20922 RSC.
- L. M. M. Quijano and D. A. Singleton, J. Am. Chem. Soc., 2011, 133, 13824–13827 CrossRef CAS PubMed.
- D. H. Ess, S. E. Wheeler, R. G. Iafe, L. Xu, N. Çelebi-Ölçüm and K. N. Houk, Angew. Chem., Int. Ed., 2008, 47, 7592–7601 CrossRef CAS PubMed.
- S. R. Hare and D. J. Tantillo, Pure Appl. Chem., 2017, 89, 679–698 CAS.
- Y. Oyola and D. A. Singleton, J. Am. Chem. Soc., 2009, 131, 3130–3131 CrossRef CAS PubMed.
- J. O. Bailey and D. A. Singleton, J. Am. Chem. Soc., 2017, 139, 15710–15723 CrossRef CAS PubMed.
- T. Bekele, C. F. Christian, M. A. Lipton and D. A. Singleton, J. Am. Chem. Soc., 2005, 127, 9216–9223 CrossRef CAS PubMed.
- D. Samanta, A. Rana and M. Schmittel, J. Org. Chem., 2014, 79, 8435–8439 CrossRef CAS PubMed.
- B. R. Ussing, C. Hang and D. A. Singleton, J. Am. Chem. Soc., 2006, 128, 7594–7607 CrossRef CAS PubMed.
- J. A. Nummela and B. K. Carpenter, J. Am. Chem. Soc., 2002, 124, 8512–8513 CrossRef CAS PubMed.
- S. L. Debbert, B. K. Carpenter, D. A. Hrovat and W. T. Borden, J. Am. Chem. Soc., 2002, 124, 7896–7897 CrossRef CAS PubMed.
- J. L. Mackey, Z. Yang and K. N. Houk, Chem. Phys. Lett., 2017, 683, 253–257 CrossRef CAS.
- J.-O. Gonzalo, P. Liu, R. A. Matute and K. N. Houk, Angew. Chem., Int. Ed., 2014, 53, 8664–8667 CrossRef PubMed.
- C. P. Suhrada and K. N. Houk, J. Am. Chem. Soc., 2002, 124, 8796–8797 CrossRef CAS PubMed.
- C. Doubleday, C. P. Suhrada and K. N. Houk, J. Am. Chem. Soc., 2006, 128, 90–94 CrossRef CAS PubMed.
- D. C. Merrer and P. R. Rablen, J. Org. Chem., 2005, 70, 1630–1635 CrossRef CAS PubMed.
- S. Lee and J. M. Goodman, J. Am. Chem. Soc., 2020, 142, 9210–9219 CrossRef CAS PubMed.
- J. Zheng, E. Papajak and D. G. Truhlar, J. Am. Chem. Soc., 2009, 131, 15754–15760 CrossRef CAS PubMed.
- J. Weber and U. H. Brinker, Angew. Chem., Int. Ed. Engl., 1997, 36, 1623–1626 CrossRef CAS.
- D. Samanta, A. Rana and M. Schmittel, J. Org. Chem., 2014, 79, 2368–2376 CrossRef CAS PubMed.
- M. J. Frisch, G. W. Trucks, H. B. Schlegel, G. E. Scuseria, M. A. Robb, J. R. Cheeseman, G. Scalmani, V. Barone, G. A. Petersson, H. Nakatsuji, X. Li, M. Caricato, A. V. Marenich, J. Bloino, B. G. Janesko, R. Gomperts, B. Mennucci, H. P. Hratchian, J. V. Ortiz, A. F. Izmaylov, J. L. Sonnenberg, D. Williams-Young, F. Ding, F. Lipparini, F. Egidi, J. Goings, B. Peng, A. Petrone, T. Henderson, D. Ranasinghe, V. G. Zakrzewski, J. Gao, N. Rega, G. Zheng, W. Liang, M. Hada, M. Ehara, K. Toyota, R. Fukuda, J. Hasegawa, M. Ishida, T. Nakajima, Y. Honda, O. Kitao, H. Nakai, T. Vreven, K. Throssell, J. A. Montgomery Jr., J. E. Peralta, F. Ogliaro, M. J. Bearpark, J. J. Heyd, E. N. Brothers, K. N. Kudin, V. N. Staroverov, T. A. Keith, R. Kobayashi, J. Normand, K. Raghavachari, A. P. Rendell, J. C. Burant, S. S. Iyengar, J. Tomasi, M. Cossi, J. M. Millam, M. Klene, C. Adamo, R. Cammi, J. W. Ochterski, R. L. Martin, K. Morokuma, O. Farkas, J. B. Foresman and D. J. Fox, Gaussian 16, Revision B.01, Gaussian Inc., Wallingford, CT, 2016 Search PubMed.
Footnote |
| † Electronic supplementary information (ESI) available: VRAI-selectivity: better calculation of selectivity than transition state theory (PDF). VRAI-selectivity is available for download from Github: https://github.com/sanha0213/VRAI-selectivity. See DOI: 10.1039/d1ob00234a |
| This journal is © The Royal Society of Chemistry 2021 |

