Dual magnetic field and temperature optical probes of controlled crystalline phases in lanthanide-doped multi-shell nanoparticles†‡
Flavia de Sousa
Ferreira
a,
Amanda Justino
de Morais
 a,
Claudia Manuela
Santos Calado
a,
Fernando
Iikawa
b,
Odilon D. D.
Couto Junior
a,
Claudia Manuela
Santos Calado
a,
Fernando
Iikawa
b,
Odilon D. D.
Couto Junior
 b,
Gabriel
Brunet
 c,
Muralee
Murugesu
 c,
Italo O.
Mazali
 a and
Fernando A.
Sigoli
 *a
*a
aInstitute of Chemistry – University of Campinas – UNICAMP, P.O. Box 6154, Campinas, Sao Paulo 13083-970, Brazil. E-mail: fsigoli@unicamp.br
bInstitute of Physics “Gleb Wataghin” – University of Campinas – UNICAMP, P.O. Box 6165, Campinas, Sao Paulo 13083-970, Brazil
cDepartment of Chemistry and Biomolecular Sciences, University of Ottawa, Ottawa, Ontario K1N 6N5, Canada
First published on 30th July 2021
Abstract
The engineering of core@multi-shell nanoparticles containing heterogeneous crystalline phases in different layers constitutes an important strategy for obtaining optical probes. The possibility of obtaining an opto-magnetic core@multi-shell nanoparticle capable of emitting in the visible and near-infrared ranges by upconversion and downshifting processes is highly desirable, especially when its optical responses are dependent on temperature and magnetic field variations. This work proposes the synthesis of hierarchically structured core@multi-shell nanoparticles of heterogeneous crystalline phases: a cubic core containing DyIII ions responsible for magnetic properties and optically active hexagonal shells, where ErIII, YbIII, and NdIII ions were distributed. This system shows at least three excitation energies located at different biological windows, and its emission intensities are sensitive to temperature and external magnetic field variations. The selected crystalline phases of the core@multi-shell nanoparticles obtained in this work is fundamental to the development of multifunctional materials with potential applications as temperature and magnetic field optical probes.
1. Introduction
The whole is greater than the sum of its parts is at the heart of designing multifunctional materials. Engineering a nanoscale material that contains more than one physical property is an ongoing challenge that has attracted much attention over the last few decades.1–4 As such, owing to their remarkable luminescence and magnetic properties, lanthanide ions have often been the metal of choice for synthesizing opto-magnetic systems.5–12 Rare-earth NaLnF4 nanoparticles have been extensively investigated as multifunctional materials owing to their tunability via a dilution method.13–16 Through careful composition control within the NaLnF4 matrix using various lanthanide ions, thanks to chemical and ionic radii similarities,17–21 it was possible to tap into unique optical properties such as upconversion,22–24 optical thermometry25–27 and optical barcoding.28 Similarly, by employing diverse paramagnetic lanthanide ions, it is possible to also fine-tune the magnetic properties; however, this is much less explored in contrast to the optical properties.29,30 With that being said, optimizing each individual physical property in one single layer of a multilayer material is a difficult task. For example, through careful composition control in NaLnF4 with optically active ions such as EuIII, TbIII, ErIII and/or YbIII, attaining remarkable upconversion performance becomes a reality.31–36 Enhancing magnetic performance using highly anisotropic DyIII, a Kramer ion, will presumably lead to higher magnetic moments, yet it will also likely quench ErIII upconversion emission.37–39 Similarly, lessons learned from the molecular systems indicate that a higher coordination geometry around the metal ions tends to favour improved magnetic performances owing to more significant separation in the Stark sublevels.40–42 On the other hand, inducing distortion around the lanthanide ions leads to brighter luminescence. This summarizes the hurdles faced in optimizing all properties in one single material. One way to overcome this challenge is using Janus nanoparticles43–46 or by core@shell crystal growth engineering.47–49 Therefore, core–shell nanoparticles are poised to offer a solution to this problem as one specific property can be confined in the core while a different property can be targeted in the outer shells. Multi-shell nanoparticles can confine various properties within their layers; additionally, an inert shell can be introduced between them to insulate the layers. As such, over the years, many NaLnF4 multi-shell systems have been developed to target various properties ranging from catalysis to biomedical applications. Nevertheless, all these core–shell particles have all been synthesized with the cubic crystalline phase (α) and the hexagonal phase (β) owing to the control of the particle size or just the photophysical properties.50–52 Controlled α and β phase layers of core@multi-shell nanoparticles with specific opto-magnetic properties are yet to be reported and especially using the high boiling point solvent precipitation methodology.The opto-magnetic properties of the LnIII-doped NaLnF4 nanoparticles are affected by their micro-symmetry (i.e., coordination environment around the metal ions) within their crystalline lattice. It is well known that the hexagonal phase (β) is ideal for obtaining brighter luminescence, while the cubic crystalline phase is better suited for enhancing the magnetic properties.53 In the former, metal ions adopt a nine-coordination environment, while in the latter cubic phase, an eight-coordinate environment can be seen. Thus, the crystal field generated within the hexagonal phase does not have a centre of inversion relaxing the Laporte rule and giving brighter emissions.54,55 In its turn, the cubic phase is known to yield enhanced magnetic anisotropy and subsequently yield superior magnetic performance.53 With this in mind, we have focused our attention on isolating core–multi-shell NaLnF4 nanoparticles that are composed of both phases to target and optimize magnetic and optical properties. Herein, we report the first example of a core–multi-shell NaLnF4 system that is composed of an α-core with the enhanced magnetic property, while the outer hexagonal phase (β) is optimized with the luminescence property. Through the high boiling point solvent methodology of creating hierarchical core–multi-shell particles, with specific crystalline phases and physical properties, we pave a way for creating optimized multifunctional nanomaterials as opto-magnetic probes for sensing and biological imaging.
2. Experimental
2.1 Synthesis
For the synthesis of the α-core NaY0.85Dy0.15F4 nanoparticles, 1.5 mMol of rare earth trifluoroacetate ( YIII and DyIII trifluoroacetates in a molar ratio of 0.85![[thin space (1/6-em)]](https://www.rsc.org/images/entities/char_2009.gif) :
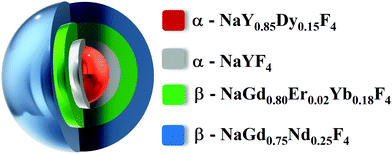
:![[thin space (1/6-em)]](https://www.rsc.org/images/entities/char_2009.gif) 0.15) were combined with 30 mMol of 1-octadecene (Sigma Aldrich, 90%), 15 mMol of oleic acid (Sigma Aldrich, 90%) and 15 mMol of oleylamine (Sigma Aldrich, 70%) in a 3-neck-round bottom flask. The mixture was heated at 100 °C and kept under vacuum and vigorously stirred until the complete dissolution of precursors. After that, the atmosphere was replaced by an argon flow, and the reaction was heated to 310 °C with a heating rate of 10 °C min−1 and maintained at this temperature for 15 min. Three different shells were grown around the α-core nanoparticles. Each shell consists of two sequential additions of precursors. The compositions of the outer shells are NaYF4, NaGd0.80Er0.02Yb0.18F4 and NaGd0.75Nd0.25F4, respectively. For the formation of the first α-NaYF4-shell, the temperature of the previsously preprared dispersion containing α-core nanoparticles was decreased to 260 °C. In a second round bottom flask, the shell precursors containing 0.5 mMol of Y(CF3COO)3 was dissolved together with 0.5 mMol of CF3COONa in 10 mMol of 1-octadecene and 10 mMol of oleic acid at 100 °C. The α-NaYF4-shell precursors were kept under vacuum and magnetically stirred until the complete dissolution of the precursors. Then, the atmosphere was replaced by argon flow, and the solution was transferred into the α-core nanoparticle dispersion using a peristaltic pump. The final dispersion was kept at 260 °C for 20 min, giving rise to α-NaY0.85Dy0.15F4@α-NaYF4 nanoparticles. Following the same procedure, the precursors of the second and the third shells were added to the system. However, to induce the hexagonal phase, an excess amount of Na(CF3COO) was also added into the reaction flask, and the reaction temperature was increased to 350 °C for 5 min. After that, the temperature of the reaction flask was maintained at 260 degrees for 45 min. In the end, the suspension was allowed to cool down to room temperature, followed by the addition of 20 mL of ethanol (Synth, 99.5%) to precipitate the core@multi-shell nanoparticles. The nanoparticles were separated by centrifugation and washed with ethanol, cyclohexane, water, and further ethanol. The final core@multi-shell nanoparticles were named α-NaY0.85Dy0.15F4@α-NaYF4@β-NaGd0.80Er0.02Yb0.18F4@β-NaGd0.75Nd0.25F4 (Fig. 1).
0.15) were combined with 30 mMol of 1-octadecene (Sigma Aldrich, 90%), 15 mMol of oleic acid (Sigma Aldrich, 90%) and 15 mMol of oleylamine (Sigma Aldrich, 70%) in a 3-neck-round bottom flask. The mixture was heated at 100 °C and kept under vacuum and vigorously stirred until the complete dissolution of precursors. After that, the atmosphere was replaced by an argon flow, and the reaction was heated to 310 °C with a heating rate of 10 °C min−1 and maintained at this temperature for 15 min. Three different shells were grown around the α-core nanoparticles. Each shell consists of two sequential additions of precursors. The compositions of the outer shells are NaYF4, NaGd0.80Er0.02Yb0.18F4 and NaGd0.75Nd0.25F4, respectively. For the formation of the first α-NaYF4-shell, the temperature of the previsously preprared dispersion containing α-core nanoparticles was decreased to 260 °C. In a second round bottom flask, the shell precursors containing 0.5 mMol of Y(CF3COO)3 was dissolved together with 0.5 mMol of CF3COONa in 10 mMol of 1-octadecene and 10 mMol of oleic acid at 100 °C. The α-NaYF4-shell precursors were kept under vacuum and magnetically stirred until the complete dissolution of the precursors. Then, the atmosphere was replaced by argon flow, and the solution was transferred into the α-core nanoparticle dispersion using a peristaltic pump. The final dispersion was kept at 260 °C for 20 min, giving rise to α-NaY0.85Dy0.15F4@α-NaYF4 nanoparticles. Following the same procedure, the precursors of the second and the third shells were added to the system. However, to induce the hexagonal phase, an excess amount of Na(CF3COO) was also added into the reaction flask, and the reaction temperature was increased to 350 °C for 5 min. After that, the temperature of the reaction flask was maintained at 260 degrees for 45 min. In the end, the suspension was allowed to cool down to room temperature, followed by the addition of 20 mL of ethanol (Synth, 99.5%) to precipitate the core@multi-shell nanoparticles. The nanoparticles were separated by centrifugation and washed with ethanol, cyclohexane, water, and further ethanol. The final core@multi-shell nanoparticles were named α-NaY0.85Dy0.15F4@α-NaYF4@β-NaGd0.80Er0.02Yb0.18F4@β-NaGd0.75Nd0.25F4 (Fig. 1).
2.2 Characterization studies
The crystalline phases of the isolated materials were probed via powder X-ray diffraction (P-XRD). The analyses were performed on a Shimadzu XRD 7000 diffractometer, operating at 40 kV/30 mA using CuKα radiation (1.5417 Å). The scanning speed was 2° min−1 in a 2θ range from 10 to 60°. The size distribution and morphology of the nanoparticles were analyzed by TEM images, using a Libra 120 (Carl Zeiss) transmission electron microscope equipped with an omega filter in-column, operated at 120 kV and with LaB6 thermionic emission. The EDS mapping of the core@multi-shell was performed using a TEM-FEG (JEOL-2100) transmission electron microscope operated at 200 kV, located at the Brazilian Nanotechnology National Laboratory (LNNano). The measurements were obtained from the acquisition of high-angle annular dark-field (HAADF)-STEM images. The sample was prepared from a cyclohexane stock suspension for microscopy analysis. One drop of the suspension was dispersed in 2 mL of ethanol, kept in an ultrasonic bath for one hour, and left to decant for 10 minutes. Then three drops of the ethanolic suspension were added successively on a copper grid with carbon film (TedPella) and dried naturally before measurements. The emission spectra of the nanoparticles in powder form were obtained using a Fluorog-3 spectrofluorimeter (Horiba Jobin–Yvon FL3-22-iHR320). The emission spectra were obtained using CW-lasers at 980 nm (Crystalaser DL980-1WT0), 808 (Crystalaser DL808-1WT0) nm and 1550 nm (Crystalaser DL91550-1WT0). The upconversion emission spectra, obtained in the range of 500 to 750 nm, were corrected according to the optical system and the sensitivity of the photomultiplier (Hamamatsu R928P). The downshifting NIR spectra were obtained using an iHR 320 imaging spectrometer. For the temperature-dependent luminescence experiments, a Linkam system (THMS 600) coupled with a spectrofluorimeter was used. The magnetic field-dependent luminescence spectra of the powder nanoparticles were obtained using a homemade setup described in the ESI (Scheme 1†). The powder sample is placed on an Attocube XYZ piezoelectric positioner allowing the laser beam to focus exactly on the sample. The setup containing the sample is placed inside an Oxford Superconducting magnet cryostat capable of reaching fields of up to 15 T and whose temperature can range from 2 to 250 K. The applied magnetic field value and the temperature were automatically controlled using a Labview program. The laser beam was focused on the sample using an Olympus 50× objective lens positioned inside the magnet. The luminescence signal was obtained using an Andor (Shamrock 500i) monochromator and CCD system. The magnetic measurements were performed using a Quantum Design SQUID magnetometer (SQUID MPMS-XL7). Hysteresis measurements were carried out at 2, 4, and 5 K with magnetic fields ranging from 0 to 7 T. Field cooled (FC) measurements were performed between 2 and 300 K with an applied field of 100 Oe.3. Results
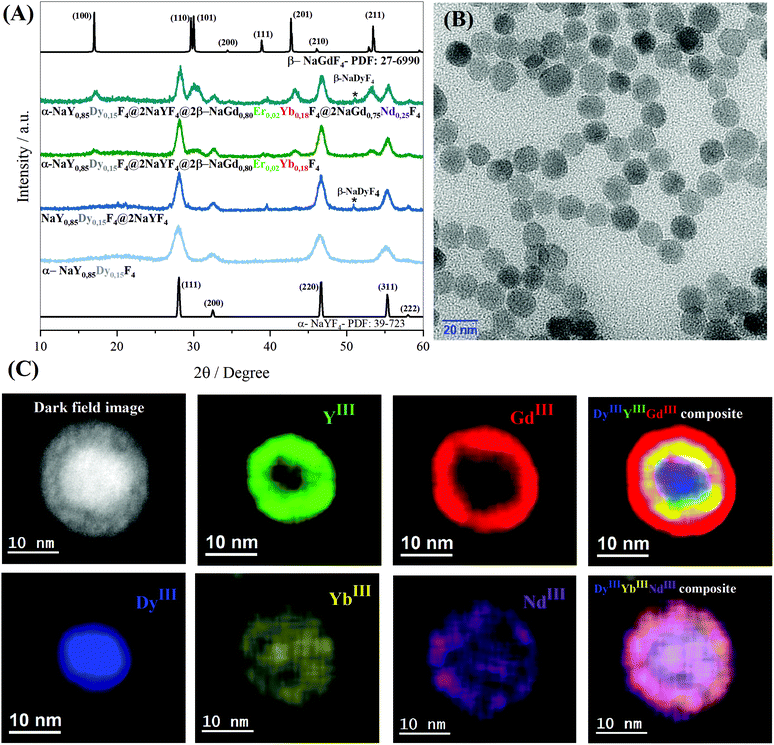
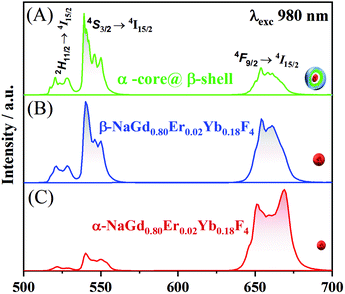
To investigate how the crystalline phases favour the optical and magnetic properties, the core@multi-shell nanoparticles composed of the lanthanide ions, DyIII, ErIII, YbIII, NdIII, and GdIII, were carefully arranged in the core@multi-shell hierarchy. First, the core composed of a cubic crystalline phase of NaY0.85Dy0.15F4 was coated with an optically and magnetically inert shell of NaYF4, to minimize any deleterious effect of DyIII on ErIII emissions, as proximity to DyIII ions tends to quench the luminescence of ErIII emission. Subsequently, we added an optically active NaGd0.80Er0.02Yb0.18F4 shell. Finally, a second optically active NaGd0.75Nd0.25F4 shell was added, improving the optical excitation versatility. The experimental conditions were chemically and physically controlled to promote the formation of the optically active hexagonal shells around the pre-formed cubic core containing magnetic DyIII ions, leading to the formation of a hierarchically structured core@multi-shell opto-magnetic nanosystem. Fig. 2(A–C) correspond to the P-XRD patterns, bright field TEM image, and EDS elemental mapping data. The P-XRD patterns of the core@multi-shell nanoparticles can be seen in Fig. 2A, where it is possible to index the diffraction peaks to the cubic and hexagonal phases, showing the formation of a mixture of cubic and hexagonal phases. Although the NaYF4 and NaDyF4 matrices are more stable in the hexagonal phase, they often initially crystallize in the cubic phase.14 The transformation from the cubic to hexagonal phase has a high energy barrier, occurring at high temperatures with an excess amount of sodium ions and longer reaction times.15,56 The precursors of optically inert shell (NaYF4) were added at 260 °C over the core with cubic phase. During this synthesis step no sodium trifluoroacetate was added. The optically active NaGd0.80Er0.02Yb0.18F4 shell was obtained at 350 °C using an excess amount of sodium ions. These synthesis parameters induced the formation of hexagonal shells. However, the reaction time must be carefully controlled to avoid phase transformation of the magnetic cubic core. The diffraction peaks attributed to the planes (111) and (220) of the cubic phase are more intense, indicating a greater abundance of this phase. The TEM images (Fig. 2B and Fig. S1†) show the formation of spheroidal nanoparticles with an average size of about 13 nm (Fig. S2†). The core@multi-shell nanoparticles exhibit high crystallinity, confirmed by TEM high-resolution images (Fig. S3†) and the HAADF image (Fig. S4†) shows the formation of core@multi-shell nanoparticles, preferably. The core@multi-shell hierarchy was investigated by the EDS (electron diffraction spectroscopy) mapping of the main ions of the nanoparticles (Fig. 1C and Fig. S5†). The EDS mapping and the ion distribution profile along the nanoparticles show that the hierarchically structured core@multi-shell NPs were obtained satisfactorily. The DyIII ions are in the core surrounded by a shell containing YIII, and the GdIII ion is present in the outmost shells. Likewise, the mapping of doping ions also confirms the presence of the YbIII and outmost NdIII ions. The EDS mapping not only confirms the formation of the core@multi-shell structure but also proves that the arrangement of the ions and the proposed hierarchy were achieved by the synthesis protocol. Fig. 3(A–C) show the selected area electron diffraction (SAED) pattern, bright field and reconstructed dark-field TEM images, respectively. Fig. 3A shows the SAED pattern, with the simulation for the hexagonal (green) and cubic (red) structure, respectively. The set of (100) planes of the hexagonal phase (Fig. 3A) was used to generate the contrast in the dark field image (Fig. 3C). Comparing the bright field image (Fig. 3B) with the dark field image (Fig. 3C) formed by the contrast generated by the set of hexagonal planes, it is possible to notice that the (100) planes of the hexagonal phase are preferably in the nanoparticle shell, confirming the P-XRD results.As a proof of concept, the upconversion emission spectra of the NaGd0.80Er0.02Yb0.18F4 nanoparticles (composition of the second shell) in both the cubic and hexagonal phases are compared with the emission spectrum of the α-NaY0.85Dy0.15F4@α-NaYF4@β-NaGd0.80Er0.02Yb0.18F4@β-NaGd0.75Nd0.25F4 core@multi-shell nanoparticles (Fig. 4). The cubic phase of the α-NaGd0.80Er0.02Yb0.18F4 nanoparticles (Fig. 4A) exhibits an emission profile favouring the band emission attributed to the 4F9/2 → 4I5/2 transition indicating a preferential population of the 4F9/2 level at the expense of the depopulation of the 4S3/2 level of ErIII ions. On the other hand, the hexagonal phase of the β-NaGd0.80Er0.02Yb0.18F4 nanoparticles (Fig. 4B) has a higher 4S3/2 → 4I15/2/4F9/2 → 4I15/2 intensity ratio. Finally, the α-NaY0.85Dy0.15F4@α-NaYF4@β-NaGd0.80Er0.02Yb0.18F4@β-NaGd0.75Nd0.25F4 nanoparticles (Fig. 4C) exhibit an emission profile similar to the hexagonal phase of the NaGd0.80Er0.02Yb0.18F4 nanoparticles (Fig. 4B), with a higher 4S3/2 → 4I15/2/4F9/2 → 4I15/2 intensity ratio. The luminescence results, together with the X-ray diffraction and TEM microscopy data, indicate the formation of core@multi-shell nanoparticles, where a hexagonal optically active shell is enveloping the magnetic cubic core.
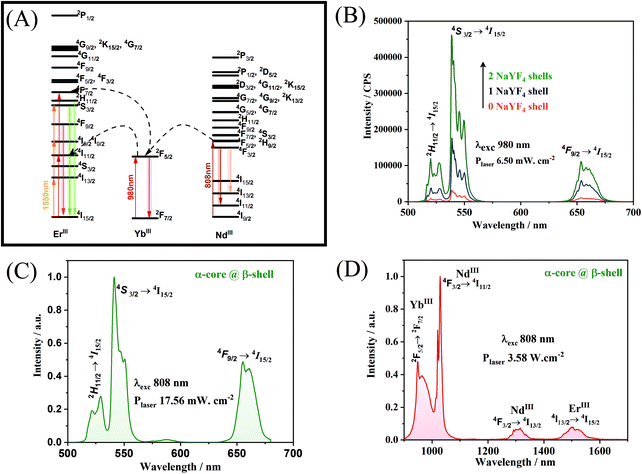
The diagram of energy levels and the possible upconversion mechanism involved in the process wherein the nanoparticles are excited at 980 or 808 or 1550 nm is shown in Fig. 5A. The upconversion mechanisms were investigated through the power law, in which the power dependence of the emission provides the number of photons absorbed for each photon emitted. As can be seen (Fig. S6†), the upconversion mechanisms involve the emission of approximately two photons for each photon absorbed, for excitation at both 808 and 980 nm, proving the existence of the mechanisms proposed in Fig. 5A. As described, the optically active β-NaGd0.80Er0.02Yb0.18F4 shell responsible for the photophysical properties must be physically separated from the DyIII doped core. The results indicate that the addition of an inert optical shell of NaYF4 (Fig. 5B) to separate the magnetic core from the optically active shell is a viable alternative to minimize the deleterious effects of DyIII on the ErIII upconversion emission. The emission spectra (Fig. 5C and Fig. S7†) show the characteristic profile of the hexagonal phase for the upconversion emissions of ErIII (Fig. 4) under excitation at two different wavelengths, 808 nm and 1550 nm, respectively. The core@multi-shell nanoparticles can also emit in the NIR region through a downshifting mechanism. If the excitation occurs at 808 nm (NdIII), the emission bands of YbIII, ErIII, and NdIII are observed (Fig. 5D). The bands attributed to NdIII and ErIII ions are also observed in the range from 1000 to 1700 nm when the excitation occurs at 980 nm (YbIII – 2F5/2 → 2F7/2; Fig. S8†), indicating that there is an energy transfer between NdIII and YbIII ions. However, when the sample is excited at 980 nm, the ErIII emission band at 1550 nm is more intense than the NdIII emissions at 1050 nm and 1300 nm, indicating that YbIII prefers to transfer its excitation energy to ErIII ions. The excitation wavelengths affect the profile and intensity of the emission bands of upconversion or downshifting processes. Through the choice of doping ions, their distribution in the nanoparticles, and control over the crystalline phase, an extremely versatile system concerning excitation wavelengths and emission wavelengths was obtained. Therefore, this nanomaterial may be excited at 808, 980, or 1550 nm emitting in the visible or NIR ranges. A system with these characteristics has potential application in bioimaging and can be excited in two different biological windows, where the penetrability of light in the tissues is maximum (low absorption) with reasonable light scattering.57 Emissions in the NIR range, especially the bands at 1300 and 1550 nm, also comprise two optical transmission windows,58 making nanoparticles with this configuration applicable in different areas of science such as telecommunications and memory devices.59
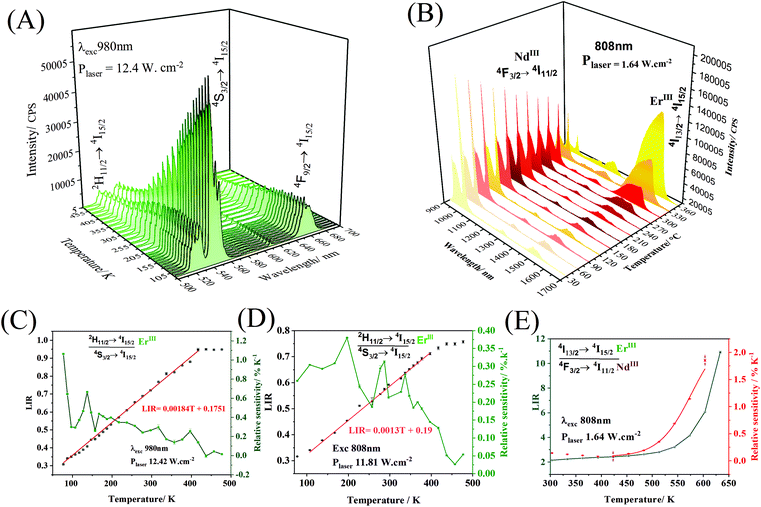
Temperature variations can promote changes in the emission spectrum intensity (Fig. 6A and B), which can be used in the construction of luminescent temperature probes. As the temperature varies, the intensity of the upconversion emission band (980 nm at 12.42 mW cm−2, Fig. 6A), attributed to the transition 2H11/2 → 4I15/2 (ErIII) remains practically constant until close to 200 K, and it subtly decreases at higher temperatures. The intensity of the emission band at 540 nm, attributed to the 4S3/2 → 4I15/2 transition, decreases as the temperature increases. The construction of the nanothermometer, in this case, can be based on the intensity ratio between the emission bands at 528 and 540 nm.
The 2H11/2 and 4S3/2 levels are thermally coupled, and at lower temperatures, these levels remain discrete, and there is no population at the highest energy 2H11/2 level. A slight increase in temperature promotes electrons from the 4S3/2 level to the 2H11/2 level. From approximately 200 K, thermal vibrations are more important than the thermal coupling, and both 2H11/2 and 4S3/2 levels have non-radiative decays competing with radiative ones. In this way, the emission intensities of both bands, centered at 528 nm and 540 nm, decrease with the gradual increase in temperature. Thus, the 2H11/2 → 4I15/2 and 4S3/2 → 4I15/2 transitions were taken to propose a ratiometric temperature optical probe based on upconversion emissions. While the operating range of a ratiometric thermometer is determined by the linear region of the ratio between intensities (LIR), the rate of change of the LIR as a function of temperature provides the sensitivity (Fig. 6C) of the thermometer  .60 The probe operating range is between 77 and 427 K, where the LIR ratio (2H11/2 → 4I15/2/4S3/2 → 4I15/2) increases. After 427 K, the LIR is constant, indicating that the system no longer responds as an optical temperature probe. The core@multi-shell nanoparticles have a maximum thermal sensitivity of 0.93% K−1 at 77 K. The system also responds to temperature variations under 808 nm excitation (Fig. 6D), with a maximum relative thermal sensitivity of 0.36% K−1 at 200 K. Emissions in the NIR range (exc. 808 nm – 1.64 W cm−2, Fig. 6B) show the suppression of NdIII emissions at 1050 nm (4F3/2 → 4I11/2) as the temperature increases. In contrast, the 1550 nm emission band of ErIII, attributed to the 4I13/2 → 4I15/2 transition, increases exponentially as a function of temperature. This abrupt increase of the ErIII emission intensity is due to the thermal population of the 4I13/2 excited level. The graphs containing Luminescence Intensity Ratio (LIR) and the relative sensitivities are shown in Fig. 6E. The intensity ratio increases in the range from 423 to 633 K, showing the potential application of this material as an optical sensor for high temperatures with a maximum thermal sensitivity of 1.86% K−1 at 633 K.
Besides temperature variation, another way to modulate the luminescence of the samples containing LnIII ions is the application of an external magnetic field. The magnetization curve as a function of the applied magnetic field (Fig. 7A) from 0 to 70![[thin space (1/6-em)]](https://www.rsc.org/images/entities/char_2009.gif) 000 Oe at 1.9 K shows a steep increase in the magnetization values below 15
000 Oe at 1.9 K shows a steep increase in the magnetization values below 15![[thin space (1/6-em)]](https://www.rsc.org/images/entities/char_2009.gif) 000 Oe. Above this field, the curve starts to saturate without reaching complete saturation. Such a feature is indicative of the presence of low-lying excited states that can be easily populated even at 1.9 K and at 70
000 Oe. Above this field, the curve starts to saturate without reaching complete saturation. Such a feature is indicative of the presence of low-lying excited states that can be easily populated even at 1.9 K and at 70![[thin space (1/6-em)]](https://www.rsc.org/images/entities/char_2009.gif) 000 Oe. Therefore, up to 70
000 Oe. Therefore, up to 70![[thin space (1/6-em)]](https://www.rsc.org/images/entities/char_2009.gif) 000 Oe, the core@multi-shell NPs have not yet fully reached magnetic saturation.
000 Oe, the core@multi-shell NPs have not yet fully reached magnetic saturation.
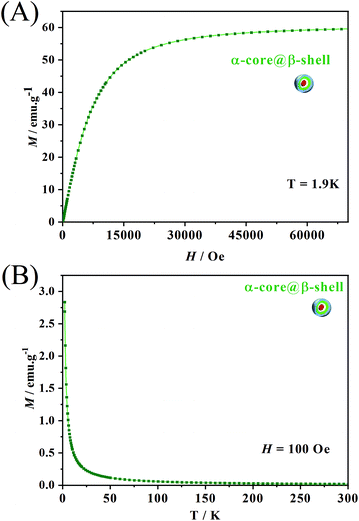 | ||
| Fig. 7 (A) Magnetization vs. field measurement at 1.9 K; (B) magnetization (M) as a function of temperature with an applied field of 100 Oe. | ||
To further probe the intrinsic magnetic behaviour of the central core, hysteresis measurements were performed on the α-NaY0.85Dy0.15F4 particles (Fig. S9†). These measurements indicate that no coercivity nor remanence was observed. This was further confirmed by the Zero-Field Cooled/Field Cooled (ZFC/FC) measurements (Fig. S9b†) where no bifurcation of the curves indicative of magnetic blocking was observed. Such an absence of magnet-like behaviour precludes the use of the superparamagnetic particle definition. Such behaviour was not surprising, as previously demonstrated for similar NaLnF4 paricles.30,54
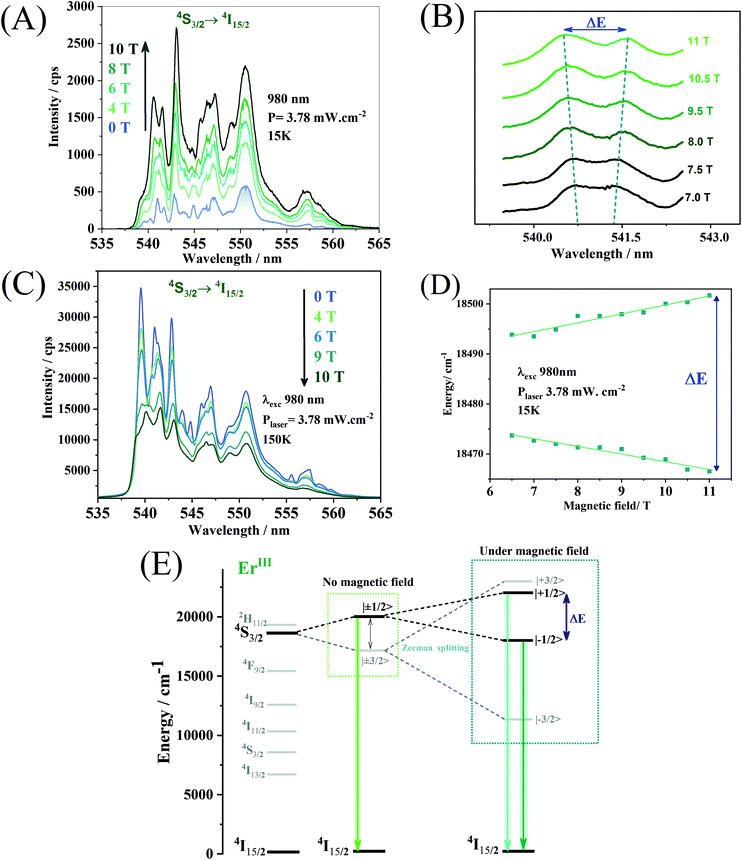
The application of an external magnetic field can influence both the shape and the intensity of the emission spectrum. The ErIII ion, chosen as an optical activator in this work, is a Kramer ion, and, consequently, the crystal field is only capable of unfolding the states of semi-complete J, such as 4S3/2, in J + ½ sub-levels. The total breakdown of the 4S3/2 level's degeneracy in 2J + 1 sub-levels (mj) can only be achieved by applying an external magnetic field through the Zeeman effect. The Zeeman effect can be seen in the upconversion spectra attributed to the 4S3/2 → 4I15/2 transition of ErIII obtained for different values of an external magnetic field. The upconversion emission spectra (Fig. 8A) were obtained at 15 K under excitation at 980 nm. One may observe a broadening of the emission lines with the increase of the magnetic field. As of an applied magnetic field of 7.0 T, it is possible to notice the separation of the emission lines, in the region between 540 and 542 nm (Fig. 8B). The magnitude of the Zeeman division is given by the variation in the energy of the splitting of the emission lines and its magnitude is calculated by the equation below:
| ΔE = −μBgLmjB |
Paramagnetic ions may feel the magnetic field and be physically displaced from their original position distorting the symmetry around them, and increasing the probability of electronic transitions by relaxing the Laport rule.61 Another factor that can affect the emission intensities is the confinement of evanescent fields suggested by Liu et al.62 in the first shell composed of NaYF4. The difference between the refractive index of the NaYF4 shell and the shell containing the emitting ions at low temperature under an applied magnetic field can give rise to a quantum optical well capable of confining evanescent fields that are released with the increase of the magnetic field. Therefore, the emission intensities increase as a function of the external field.
The upconversion spectra obtained at 150 K, however, show a decrease in the emission intensities with the increase of the external magnetic field (Fig. 8C). For the 4S3/2 level of ErIII ions, the magnetic field divides the two Kramer doublets of |±1/2〉 and |±3/2〉 into four Zeeman levels, |+1/2〉, |−1/2〉, |+3/2〉 and |−3/2〉 (Fig. 8E). This energy separation may reduce the energy gap between the ground state and the emitting states of ErIII ions and may favour cross-relaxation or multiphonon-assisted relaxation processes, promoting the observed emission quenching. An inversion of the emission bands’ maximum intensities at 539, 541, and 543 nm is evident due to the increase of the applied magnetic field. This indicates that the thermal fluctuations associated with the increase in the energy gap, promoted by the external field, selectively populate different Zeeman levels. The hierarchical material obtained may find applications such as a remote luminescent magnetic field sensor, based on the changes in the emission bands and the separation of Zeeman levels. The emission intensities respond to the magnetic field in different ways for different temperatures. The nanoparticles may configure a simultaneous and self-calibrated magnetic field and temperature probe, where the first parameter can be used to calibrate the second one. However, more detailed measurements at different temperatures must be made to prove this hypothesis.
4. Conclusions
The synthesis strategy was efficient in obtaining spheroidal nanoparticles with an average size of approximately 13 nm of heterogeneous crystalline phases, formed from a cubic phase core and hexagonal phase shells, confirmed by XRD, TEM, and luminescence measurements. The hierarchy was obtained satisfactorily and can be confirmed by EDS mapping and HAADF images, optimizing and arranging the optical or magnetic properties of interest in different regions of the nanoparticle. Optically active shells, in the hexagonal phase, can emit in the visible region and the NIR range after excitation at 980, 808, and 1550 nm, covering two different biological windows. The nanoparticle emissions are affected by temperature, where the ErIII emissions at 528 and 540 nm can be taken to propose a temperature probe based on upconversion emissions in the temperature range of 77 to 427 K. Emissions in the NIR cover higher temperatures ranging from 427 to 633 K. The luminescence of the core@multi-shell nanoparticles can also be modulated by the application of an external magnetic field, where at 15 K, the increase in the intensity of the magnetic field improves the emission intensities and promotes the unfolding of Zeeman's doublets, for the 4S3/2 transition of the ErIII ion. However, at 150 K, the increase of the magnetic field decreases the intensities of the upconversion emission. The magneto-optical properties of the nanoparticles reveal their versatile nature and their applicability as magnetic field and optical temperature probes in which the parameters, temperature and field, can be measured simultaneously.Conflicts of interest
The authors declare no competing interests.Acknowledgements
The authors gratefully acknowledge the financial support provided by the FAPESP: 2013/22127–2, INCT/INOMAT-National Institute of Science Technology in Complex Functional Materials (CNPq: 465452/2014-0 and FAPESP: 50906-9/20214), FAPESP: 2012/11382-9 and CNPq 306107/2019-8. Contributions from the Brazilian Nanotechnology National Laboratory LNNano/CNPEM, Brazil and the Multiuser Laboratory of Advanced Optical Spectroscopy (LMEOA/IQ-UNICAMP) analysis are also gratefully acknowledged. All authors would like to thank Dr Douglas Soares for the TEM measurements and Jefferson Bettini and Vishnu Mogili for the EDS mapping. FSF thanks the Coordenação de Pessoal de Nível Superior (CAPES) – Brazil for the PhD scholarship.References
- F. Vetrone, R. Naccache, V. Mahalingam, C. G. Morgan and J. A. Capobianco, Adv. Funct. Mater., 2009, 19, 2924 CrossRef CAS.
- X. Lin, X. Chen, W. Zhang, T. Sun, P. Fang, Q. Liao, X. Chen, J. He, M. Liu, F. Wang and P. Shi, Nano Lett., 2018, 18, 948 CrossRef CAS PubMed.
- M. Tan, F. Li, N. Cao, H. Li, X. Wang, C. Zhang, D. Jaque and G. Chen, Small, 2020, 16, 2004118 CrossRef CAS PubMed.
- J. Huang, L. Yan, S. Liu, N. Song, Q. Zhang and B. Zhou, Adv. Funct. Mater., 2021, 31, 2009796 CrossRef CAS.
- D. Errulat, R. Marin, D. A. Gálico, K. L. M. Harriman, A. Pialat, B. Gabidullin, F. Iikawa, O. D. D. Couto, J. O. Moilanen, E. Hemmer, F. A. Sigoli and M. Murugesu, ASC Cent. Sci., 2019, 5, 1187 CrossRef CAS PubMed.
- P. Chen, J. Zhang, B. Xu, X. Sang, W. Chen, X. Liu, J. Han and J. Qiu, Nanoscale, 2014, 6, 11002 RSC.
- Y. Liu, D. Wang, J. Shi, Q. Peng and Y. Li, Angew. Chem., Int. Ed., 2013, 52, 4366 CrossRef CAS PubMed.
- A. Borodziuk, M. Borodziuk, T. Wojciechowski, R. Minikayev, B. Sikora, D. K. Maude, P. Plochocka and Ł. Kłopotowski, Nanoscale, 2020, 12, 20300 RSC.
- P. Chen, H. Jia, J. Zhang, J. Han, X. Liu and J. Qiu, J. Phys. Chem. C, 2015, 119, 5583 CrossRef CAS.
- P. Chen, Z. Zhong, H. Jia, J. Zhou, J. Han, X. Liu and J. Qiu, RSC Adv., 2016, 6, 7391 RSC.
- J.-P. Zhang, Z.-Q. Zhong, X. Wang, S.-L. Wang, G. Du and J.-B. Han, J. Lumin., 2019, 213, 433 CrossRef CAS.
- P. Xiao, S. Ye, H. Liao and D. Wang, J. Alloys Compd., 2018, 767, 775 CrossRef CAS.
- D. Liu, X. Xu, Y. Du, X. Qin, Y. Zhang, C. Ma, S. Wen, W. Ren, E. M. Goldys, J. A. Piper, S. Dou, X. Liu and D. Jin, Nat. Commun., 2015, 7, 10254 CrossRef PubMed.
- F. Wang, Y. Han, C. S. Lim, Y. Lu, J. Wang, J. Xu, H. Chen, C. Zhang, M. Hong and X. Liu, Nature, 2010, 463, 1061 CrossRef CAS PubMed.
- H.-X. Mai, Y.-W. Zhang, R. Si, Z.-G. Yan, L.-D. Sun, L.-P. You and C.-H. Yan, J. Am. Chem. Soc., 2006, 128, 6426 CrossRef CAS PubMed.
- Y. fan, L. Liu and F. Zhang, Nano Today, 2019, 25, 68 CrossRef CAS.
- I. Halimi, E. M. Rodrigues, S. L. Maurizio, H.-Q. T. Sun, M. Grewal, E. M. Boase, N. Liu, R. Marin and E. Hemmer, J. Mater. Chem. C, 2019, 7, 15364 RSC.
- S. Liu, L. Yan, Q. Li, J. Huang, L. Tao and B. Zhou, Chem. Eng. J., 2020, 397, 125451 CrossRef CAS.
- M. Wu, L. Yan, T. Wang, B. Zhou and Q. Zhang, Adv. Funct. Mater., 2019, 29, 1804160 CrossRef.
- J. Nie, H. Gao, X. Li and S. Liu, J. Lumin., 2018, 204, 333 CrossRef CAS.
- B. Zhou, L. Yan, J. Huang, X. Liu, L. Tao and Q. Zhang, Nat. Photonics, 2020, 14, 760 CrossRef CAS.
- F. Auzel, Chem. Rev., 2004, 104, 139 CrossRef CAS PubMed.
- J.-C. G. Bünzli, Trends Chem., 2019, 1, 751 CrossRef.
- J. Liao, D. Jin, C. Chen, Y. Li and J. Zhou, J. Phys. Chem. Lett., 2020, 11, 2883 CrossRef CAS PubMed.
- C. Mi, J. Zhou, F. Wang, G. Lin and D. Jin, Chem. Mater., 2019, 31, 9480 CrossRef CAS.
- E. M. Rodrigues, D. A. Gálico, I. O. Mazali and F. A. Sigoli, Sens. Actuators, A, 2019, 291, 1 CrossRef CAS.
- X. Qiu, Q. Zhou, X. Zhu, Z. Wu, W. Feng and F. Li, Nat. Commun., 2020, 11, 4 CrossRef CAS PubMed.
- E. C. Ximendes, U. Rocha, C. Jacinto, K. U. Kumar, F. J. López, E. M. Rodrígues, J. García-Solé and D. Jaque, Nanoscale, 2016, 8, 3057 RSC.
- D. A. Gálico, A. A. Kitos, J. S. Ovens, F. A. Sigoli and M. Murugesu, Angew. Chem., Int. Ed., 2021, 60, 6130 CrossRef PubMed.
- E. M. Rodrigues, D. A. Gálico, M. A. Lemes, J. Bettini, E. T. Neto, I. O. Mazali, M. Murugesu and F. A. Sigoli, New J. Chem., 2018, 42, 13393 RSC.
- N. Liu, N. Gobeil, P. Evers, I. Gessner, E. M. Rodrigues and E. Hemmer, Dalton Trans., 2020, 49, 16204 RSC.
- K. Prorok, M. Pawlyta, W. Stręk and A. Bednarkiewicz, Chem. Mater., 2016, 28, 2295 CrossRef CAS.
- H. Dong, L.-D. Sun, W. Feng, Y. Li and C.-H. Yan, ACS Nano, 2017, 11, 3289 CrossRef CAS PubMed.
- L. Yan, B. Zhou, N. Song, X. Liu, J. Huang, T. Wang, L. Tao and Q. Zhang, Nanoscale, 2018, 10, 17949 RSC.
- H. Dong, L.-D. Sun, Y.-F. Wang, J.-W. Xiao, D. Tu, X. Chen and C.-H. Yan, J. Mater. Chem. C, 2016, 4, 4186 RSC.
- M. A. Antoniak, S. J. Zelewski, R. Oliva, A. Żak, R. Kudrawiec and M. Nyk, ACS Appl. Nano Mater., 2020, 3, 4209 CrossRef CAS.
- M. T. Berry and P. S. May, J. Phys. Chem. A, 2015, 119, 9805 CrossRef CAS PubMed.
- X. Chen, J. Vanacken, Y. Liu, J. Ge, J. Hu, S. Wu, Z. Zhong and V. Moschalkov, IEEE J. Sel. Top. Quantum Electron., 2018, 1 Search PubMed.
- Y. Su, L.-N. Hao, K. Liu, J. Zhang, L. Dong, Y. Xu, Y. Lu and H.-S. Qian, RSC Adv., 2018, 8, 12944 RSC.
- Y. Li, B. Chen, L. Tong, X. Zhang, S. Xu, X. Li, J. Zhang, J. Sun, X. Wang, Y. Zhang, X. Zhang and H. Xia, Results Phys., 2019, 15, 102704 CrossRef.
- X. Zhang, B. Blasiak, A. J. Marenco, S. Trudel, B. Tomanek and F. C. J. M. van Veggel, Chem. Mater., 2016, 28, 3060 CrossRef CAS.
- R. D. A. Alvares, A. Gautam, R. S. Prosser and F. C. J. M. van Veggel, J. Phys. Chem. C, 2017, 121, 17552 CrossRef CAS.
- Y. Liu, H. Fan, Q. Guo, A. Jiang, X. Du and J. Zhou, Theranostics, 2017, 17, 4217 CrossRef PubMed.
- P.-Z. Zhang, R. Liu, L.-D. Sun, H. Dong, L.-D. Li, X.-Y. Zheng, K. Wu and C.-H. Yan, Inorg. Chem. Front., 2018, 5, 1800 RSC.
- H. Zhang, C. Huang, N. Li and J. Wei, J. Colloid Interface Sci., 2021, 592, 249 CrossRef CAS PubMed.
- K. Li, P. Li, Z. Jia, B. Qi, J. Xu, D. Kang, M. Liu and Y. Fan, Sci. Rep., 2018, 8, 17117 CrossRef PubMed.
- X. Xi, Q. Ma, X. Dong, J. Wang, W. Yu and G. Liu, IEEE Trans. Nanotechnol., 2015, 14, 243 CAS.
- W. B. Dai, H. Li, Y. Chen, Y. M. Fan and F. Shen, J. Lumin., 2021, 234, 117960 CrossRef CAS.
- S. Liu, J. Huang, L. Yan, N. Song, P. Zhang, J. He and B. Zhou, J. Mater. Chem. A, 2021, 9, 4007 RSC.
- M. Wu, L. Yan, T. Wang, B. Zhou and Q. Zhang, Adv. Funct. Mater., 2019, 29, 1804160 CrossRef.
- Q. Shao, C. Yang, X. Chen, H. Zhang, G. Feng and S. Zhou, CrystEngComm, 2020, 22, 1359 RSC.
- H. Chen, P. Zhang, H. Cui, W. Qin and D. Zhao, Nanoscale Res. Lett., 2017, 12, 548 CrossRef PubMed.
- D. Zhao, H. Chen, K. Zheng, X. Chuai, F. Yu, H. Li, C. Wu, G. Qin, W. DI and W. Qin, RSC Adv., 2014, 4, 13490 RSC.
- R. J. Holmberg, T. Aharen and M. Murugesu, J. Phys. Chem. Lett., 2012, 3, 3721 CrossRef CAS PubMed.
- O. Laporte and W. F. Meggers, J. Opt. Soc. Am., 1925, 11, 459 CrossRef CAS.
- Y. Sui, K. Tao, Q. Tian and K. Sun, J. Phys. Chem. C, 2012, 116, 1732 CrossRef CAS.
- E. Hemmer, A. Benayas, F. Légaré and F. Vetrone, Nanoscale Horiz., 2016, 1, 168 RSC.
- J.-C. G. Bünzli and S. V. Eliseeva, J. Rare Earths, 2010, 28, 824 CrossRef.
- E. Saglamyurek, J. Jin, V. B. Verma, M. D. Shaw, F. Marsili, S. W. Nam, D. Oblak and W. Tittel, Nat. Photonics, 2015, 9, 83 CrossRef CAS.
- S. A. Wade, S. F. Collins and G. W. Baxter, J. Appl. Phys., 2003, 94, 4743 CrossRef CAS.
- L. F. Chibotaru, V. K. Tikhomirov, D. Saurel and V. V. Moshchalkov, J. Appl. Phys., 2009, 106, 053502 CrossRef.
- Y. Liu, J. Vanacken, X. Chen, J. Han, Z. Zhong, Z. Xia, B. Chen, H. Wu, Z. Wu, Z. Jin, J.-Y. Ge, J. Huang, L. Meng, X. Duan, Y. Huang, Q. Peng, V. V. Moshchalkov and Y. Li, Adv. Mater., 2019, 31, 1806341 CrossRef PubMed.
Footnotes |
| † Electronic supplementary information (ESI) available. See DOI: 10.1039/d1nr03796j |
| ‡ This work is dedicated to Professor Oswaldo Luiz Alves from the Institute of Chemistry – UNICAMP, a recognized and enthusiastic Professor/Researcher of the nanoscience field who suddenly and prematurely passed away on July 10th, 2021. |
| This journal is © The Royal Society of Chemistry 2021 |

