
 Open Access Article
 This Open Access Article is licensed under a
 Creative Commons Attribution 3.0 Unported Licence
Addressing energy storage needs at lower cost via on-site thermal energy storage in buildings†
Adewale
Odukomaiya
 a,
Jason
Woods
a,
Nelson
James
a,
Sumanjeet
Kaur
b,
Kyle R.
Gluesenkamp
c,
Navin
Kumar
d,
Sven
Mumme
e,
Roderick
Jackson
a and
Ravi
Prasher
*bf
a,
Jason
Woods
a,
Nelson
James
a,
Sumanjeet
Kaur
b,
Kyle R.
Gluesenkamp
c,
Navin
Kumar
d,
Sven
Mumme
e,
Roderick
Jackson
a and
Ravi
Prasher
*bf
aNational Renewable Energy Laboratory, Golden, Colorado, USA. E-mail: wale.odukomaiya@nrel.gov
bLawrence Berkeley National Laboratory, Berkeley, California, USA. E-mail: rsprasher@lbl.gov
cOak Ridge National Laboratory, Oak Ridge, Tennessee, USA
dGas Technology Institute, Des Plaines, Illinois, USA
eU.S. Department of Energy, Washington D.C., USA
fUniversity of California, Berkeley, Berkeley, California, USA
First published on 14th September 2021
Abstract
Cost-effective energy storage is a critical enabler for the large-scale deployment of renewable electricity. Significant resources have been directed toward developing cost-effective energy storage, with research and development efforts dominated by work on lithium ion (Li-ion) battery technology. Though Li-ion batteries have many attractive qualities, it is not clear whether they can provide an affordable levelized cost of storage (LCOS) for certain applications, such as buildings. Buildings consume most of the world's electricity, and as much as 50% of their consumption goes toward meeting thermal loads. Thermal energy storage (TES) can provide a cost-effective alternative to Li-ion batteries for buildings; however, two questions remain to be answered. First, how much of total building energy storage requirements can be met via thermal storage for building loads? Second, can the LCOS for TES be favorable compared with Li-ion batteries? In this perspective, using the United States as a case study, we show that the total requirement for TES in buildings is in the range of ∼1200–4500 electrical GW h, depending on the fraction of solar versus wind in the generation mix. Furthermore, we show that with at least 25% wind generation, all of the storage needed by buildings to support the grid can be met by TES. We also introduce a framework to calculate LCOS for on-site TES in buildings to enable a direct comparison with electrical storage technologies such as Li-ion batteries. This is not trivial, because the input energy type for TES (electricity) differs from the output energy type (thermal energy), and the efficiency can depend on ambient conditions. Our LCOS analysis shows that in many situations, TES can be more cost-effective for buildings than Li-ion batteries. We conclude our perspective by discussing future research and development opportunities that can significantly advance the deployment of TES for buildings to help enable a renewable electricity-dependent grid.
Broader contextLarge amounts of energy storage are needed to enable a high renewables energy system. Technology development has focused on electricity storage technologies such as Li-ion batteries; however, due to issues such as cost-effectiveness and material supply chain limitations, it is unclear if these technologies alone can fulfill on-site energy storage needs for buildings. Thermal energy storage (TES) technologies are an attractive alternative for buildings due to their low-cost, long lifetimes, ability to improve the efficiency of heating and cooling, and more. Through this critical perspective, we make the case for on-site TES in buildings by quantifying the related challenges and opportunities and systematically outlining future research and development needs to realize this enormous potential. For the first time, we present a framework to calculate the levelized cost of storage (LCOS) for TES to meet thermal loads in buildings, enabling a holistic approach to tackling technical barriers influencing TES cost, and enabling an apples-to-apples comparison with electricity storage technologies. Transitioning towards a high efficiency, low-emissions, and equitable energy system will require heating and cooling our buildings using heat pumps powered by renewable energy. TES can play a significant role in enhancing the performance of heat pumps and accelerating their wider adoption. |
1 Introduction
It is abundantly clear that deeper penetration of renewable electricity (RE) will only be possible with scalable, affordable, and sustainable energy storage.1,2 In the past few years, many analyses have been performed on the total electrical storage needed for both short and long durations to support the RE-based grid of the future. Many energy storage technologies have been explored,3,4 and these studies have included detailed analyses comparing each technology's levelized cost of storage (LCOS). However, on-site thermal energy storage (TES) in buildings has largely been overlooked, despite the fact that buildings’ heating and cooling is responsible for more than 10% of global energy consumption5 and anthropogenic CO2 emissions, and despite the fact that heating and cooling loads are projected to increase to more than 50% of energy demand in buildings.6 Buildings are already responsible for more than two-thirds (74%)7 of electricity consumption in the United States. Furthermore, heating loads are shifting from fuel combustion to electricity due to falling prices of RE and the desire to decarbonize the world's energy use.Electrochemical batteries based on Li-ion technology—either in the form of distributed on-site energy storage in buildings or as centralized larger-scale installations—are one of the main options being considered for short-duration energy storage (less than 10 hours) to support the grid.3 Commercial products such as Tesla's Powerwall are one such example. At present, the majority of the technology deployment, policy framework, and scientific literature, including high impact journals, are focused on electrochemical storage using some form of Li chemistry, such as solid state.8 However, it is important to understand how much storage will be needed to support building energy needs, and to examine how sustainable Li-ion batteries will be if they are scaled to meet the enormous challenge of supporting both buildings and transportation sectors, given that they use significant amounts of scarce materials such as cobalt, nickel, lithium, and natural graphite.9,10
A recent study highlighted the challenges related to material supply of supporting the grid and the transportation sector using Li-ion batteries.11 To meet the future large-scale need for Li-ion batteries, a well-established recycling system and batteries with lower Li intensity will be needed. Although significant research and development (R&D) is taking place on both topics, no viable and scalable technology has yet emerged. There are also ethical questions related to the mining practices for some of these materials, which are energy-intensive processes that generate significant waste, resulting in an overall negative environmental impact. Other important questions include: How affordable are Li-ion and other electrochemical batteries for buildings applications, given that the battery lifetime is only around eight years? How safe are Li-ion based batteries for buildings?
Because heating and cooling are projected to account for more than 50% of the energy demand in buildings, we argue in this perspective that on-site TES for buildings is a sustainable and scalable complement to electrochemical storage. It can provide similar functionality by consuming electricity to charge the thermal storage, then discharging thermal energy to displace later electricity use. By using TES in buildings, material sustainability and supply issues for Li-ion can be alleviated significantly. In addition, unlike batteries, TES can harness the effect of diurnal swings in ambient temperature, which can significantly improve its efficiency (discussed in Section 3). However, to understand the scope of the benefits that TES can provide, it is important to answer two questions:
(1) For an RE-based grid, how much energy storage is needed to balance electricity supply and demand for buildings? How much of this energy storage can be met via thermal storage for building loads?
(2) What is the LCOS of on-site TES in buildings, and how does it compare with Li-ion batteries?
In this perspective, we provide a framework for answering both questions. First, we provide an estimate of the total energy storage potential for supporting thermal loads in buildings under various RE scenarios, based on an assumed mix of wind and solar electricity. We then introduce a framework to calculate the LCOS of on-site TES for buildings. Although on-site TES has been proposed in the literature for many years, the LCOS of on-site TES for buildings has not been evaluated. The LCOS of TES is critical to understanding economic viability, and to defining R&D targets for making TES scalable and competitive. LCOS of Li-ion batteries has been extensively studied; however, comparing Li-ion LCOS with TES LCOS is nontrivial because of differing types of discharge: in Li-ion, the inputs and outputs are electricity, whereas in TES, the input energy is electricity, and the output energy is thermal.
Finally, we use the results obtained from these analyses to outline possible R&D strategies and pathways for both TES materials and systems. Continued R&D in these areas will make TES a viable energy storage technology while also offering a solution to future challenges related to the sustainability of material supply.
Fig. 1 shows the different ways that storage can be deployed at the individual building scale. We assume that in the future, both cooling and heating will be provided by heat pumps, as heat pumps are one of the main options under consideration to decarbonize heating in buildings.12 Electrical storage can be deployed to drive a heat pump, which can operate in both heating and cooling modes. Thermal storage can be deployed either actively, when integrated into equipment like heat pumps, or passively when embedded in a building's walls or ceiling (envelope). Envelope-embedded approaches increase the thermal inertia of building envelopes, which can reduce temperature fluctuations, leading to energy savings and improved thermal comfort of occupants.13,14 Electrical storage is placed before the heat pump, whereas thermal storage is placed after the heat pump, as shown in Fig. 1. In other words, electrical storage must be discharged to drive a compressor in a heat pump, whereas with thermal storage, the compressor is only operational during charging, and the storage is discharged directly to meet the thermal load. This placement has significant impact on LCOS, depending on the climate conditions and the mix of RE (i.e., how much wind versus solar RE is available). This is discussed in detail in Section 3 of this perspective.
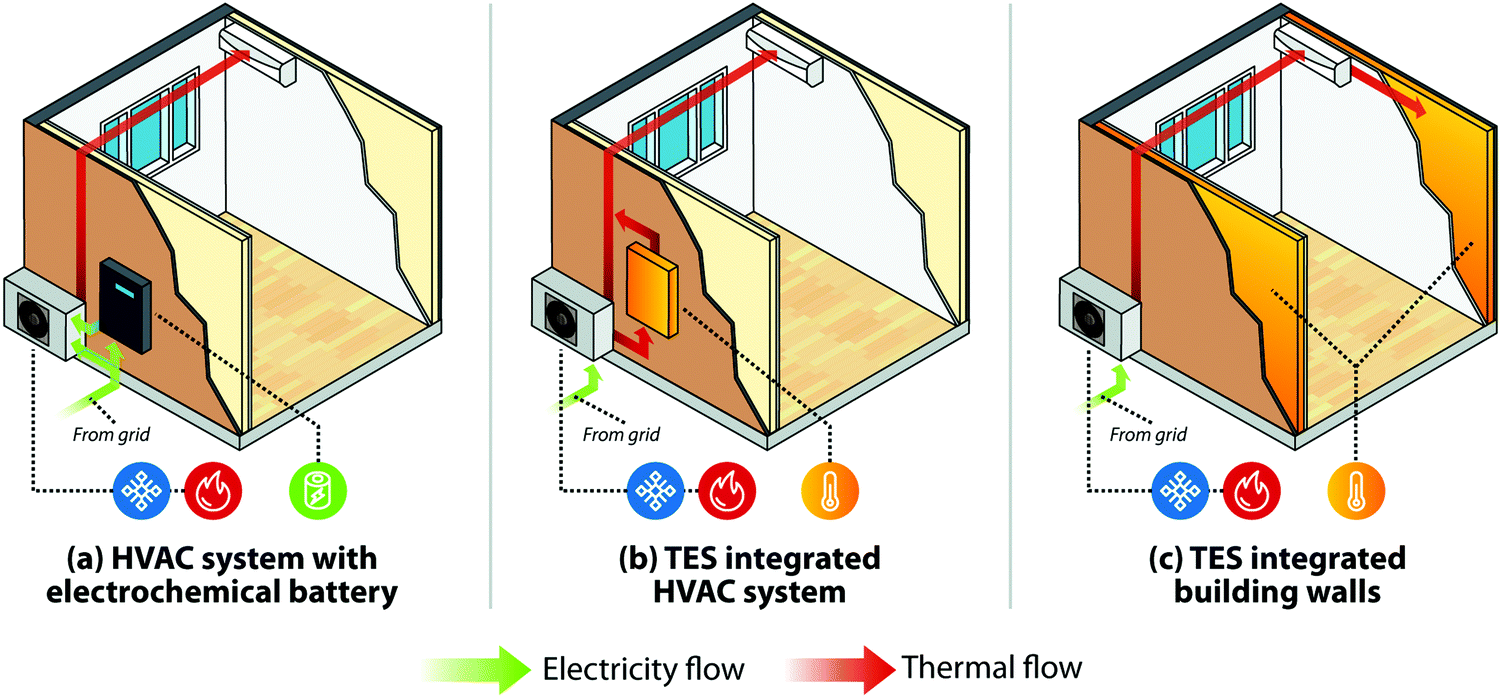 | ||
| Fig. 1 System architectures of storage + heat pump considered in this study: (a) electrical energy storage (EES) with heat pump heating and cooling, (b) heat pump heating and cooling with TES integrated into heat pump, or (c) heat pump heating and cooling with TES integrated into building walls. | ||
2 Energy storage needed to support building thermal loads in the United States
2.1 Methodology for calculating energy storage requirements and potential from TES
Energy storage is just one of many tools to balance supply and demand on a high-RE grid; other tools include energy efficiency, load shedding, demand response, and overbuilding renewables. However, in this study, we focus exclusively on energy storage. Therefore, it is critical to know how much energy storage will be needed to support a grid running on 100% RE. Various analyses on this subject have started to appear in the literature.1,2 These analyses typically divide storage into two duration categories.1 Hourly storage is known as short-duration storage (SDS), and storage spanning days, weeks, or seasons is known as long-duration storage.15 Recently, Dowling et al. estimated that to support the total electric load in the United States in 2020 for a 100% RE scenario, there is a need for 768–896 GW h of SDS.2 Because ∼74% of U.S. electricity today is used in buildings, this translates to an estimate of 570–660 GW h of SDS needed to address just electricity use in buildings. This is a large number, considering that total Li-ion production capacity in the United States is ∼3.8 GW h per year![[thin space (1/6-em)]](https://www.rsc.org/images/entities/char_2009.gif) 16 and global production is less than 500 GW h per year.17 A similar global-scale analysis for SDS needs will be significantly higher.
16 and global production is less than 500 GW h per year.17 A similar global-scale analysis for SDS needs will be significantly higher.
A limitation of previous analyses is that they did not disaggregate thermal and non-thermal loads in buildings. This is important since many loads (such as computers and lighting) cannot be met directly by thermal storage. In this perspective, we create our own estimate of the SDS needs for buildings with a 100% RE grid, and we differentiate between thermal and non-thermal loads. We focus on the storage needs expected for the year 2050 for two reasons. First, we are interested in the storage needs to facilitate electricity from RE, and studies have shown it is possible to have a nearly net zero CO2 electricity grid in the United States by 2050.18,19 Second, significant electrification of heating equipment in buildings is expected worldwide by 2050, using either heat pumps or resistive heating, which will significantly increase the electricity needs of buildings.12,20 Our analysis focuses on the United States; however, our conclusions have broad applicability worldwide based on trends elsewhere in building thermal loads and RE generation.21,22
To estimate the thermal and non-thermal loads in residential and commercial buildings in the year 2050, we used Scout, a U.S. Department of Energy (DOE) tool that quantifies the impact of building energy efficiency measures across all buildings in the contiguous United States.23,24 Projections in Scout are informed by the results of the Energy Information Administration's modeling projections for future energy usage within the United States,18 which account for changes in building stock characteristics, including component performance.
In this analysis, thermal loads consist of space heating, space cooling, water heating, and refrigeration loads. The load profile projections used in Scout for the year 2050 were divided into thermal and non-thermal loads for summer months (June–August) and winter months (December–February). Average daily values were calculated for each season. Load growth due to the electrification of space heating was also incorporated into the 2050 projections. This was done for air-source heat pumps, which will form the basis of the electrified heating future.
Solar and wind profiles were obtained for each Energy Information Administration Electric Market Module25 grid region using NREL's System Advisor Model software, and were averaged over the contiguous United States. The total energy supplied by renewable sources was scaled to be equal to 100% of the average daily electrical consumption of the combined commercial and residential sectors for a particular season. Storage needs were calculated using the average daily profiles in Fig. 2, by determining the sum of the net demand where the combined thermal and non-thermal loads exceeded renewable generation. When only the net demand of non-thermal loads exceeded renewable generation, it was assumed that non-thermal storage resources would be needed to provide that demand. For example, Fig. 2a (discussed in Section 2.2) shows that for a 100% solar scenario, there are times of the day where even non-thermal loads exceed energy generation. Therefore, energy storage will be needed even for non-thermal loads. Storage results calculated for both thermal and non-thermal loads are in electrical energy units. If thermal energy storage is used to support thermal loads, then the coefficient of performance (COP) is used as the scaling parameter between electric and thermal energy (see Section 3 on LCOS). The calculation was done for both summer and winter average daily profiles, and the larger of the two was taken as the storage required. A more detailed description of the methodology used in this analysis is provided in the ESI.†
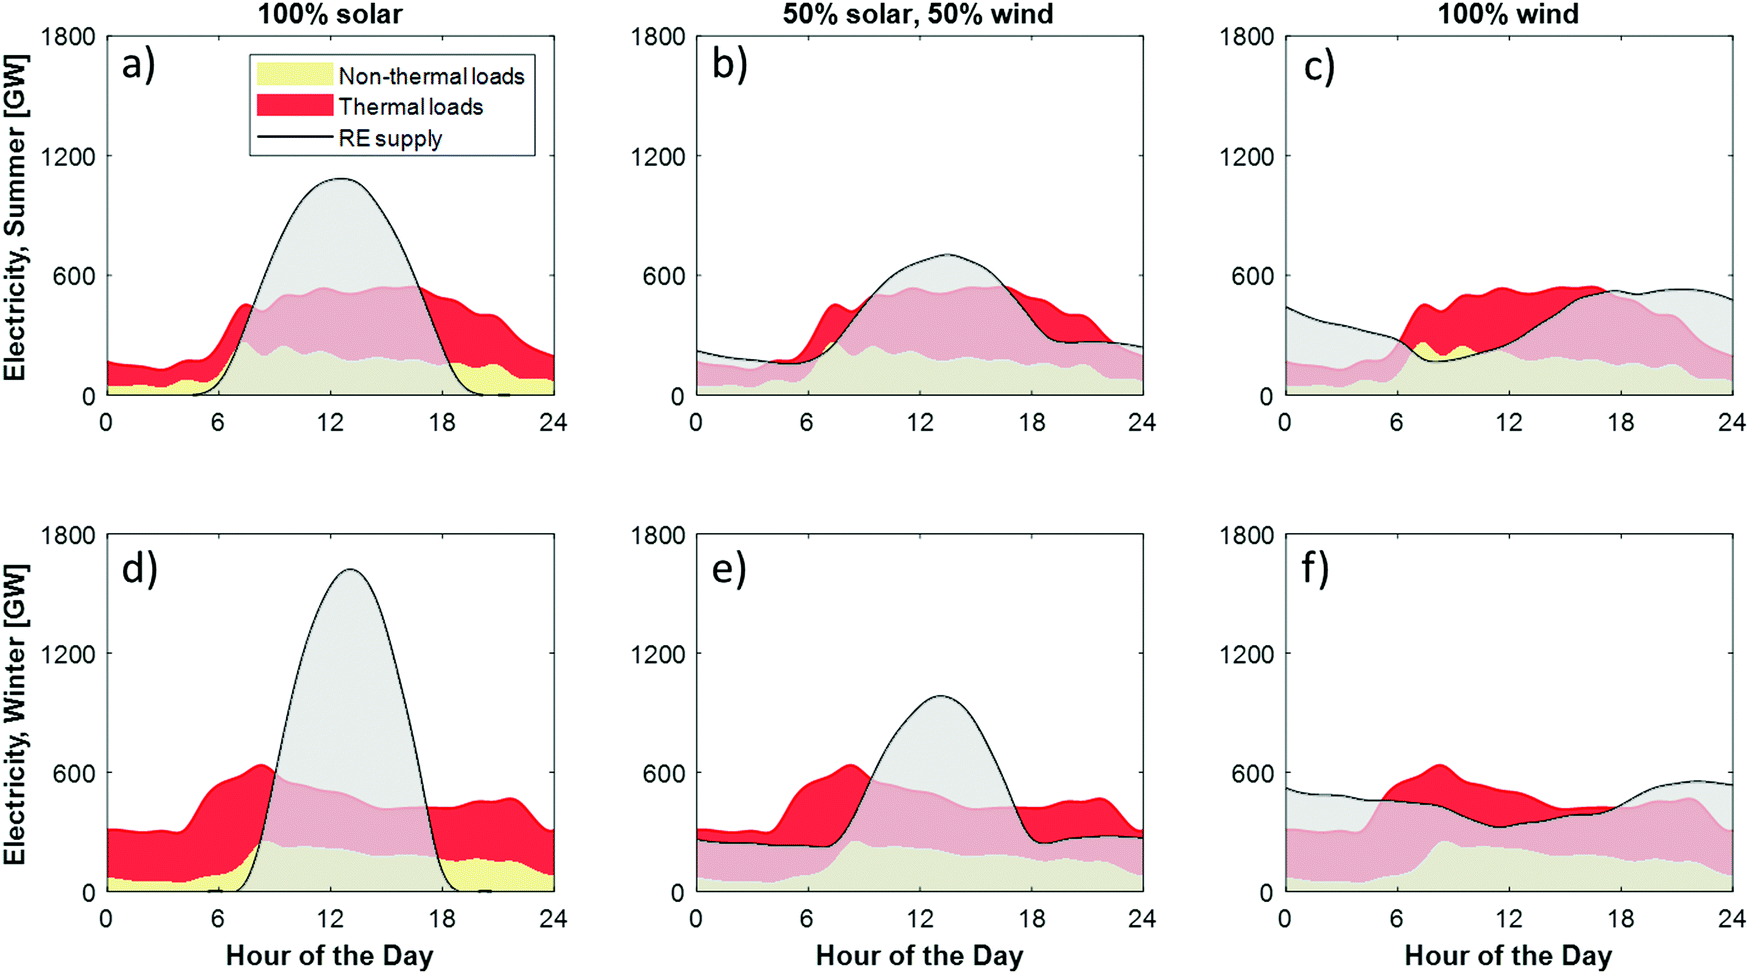 | ||
| Fig. 2 Average summer (a–c) and winter (d–f) U.S. commercial and residential building electricity demand, overlaid with 100% RE supply profiles. The results assume that air-source heat pumps are used for heating. Similar graphs for a 75% RE supply scenario are shown in the ESI.† | ||
2.2 Results for thermal and non-thermal energy storage requirements for buildings
Fig. 2 shows modeling results for various scenarios in which heat pumps are used for both cooling and heating. Results are shown for various renewable mixes of solar and wind, as this has a significant impact on the storage requirements for supporting building loads. Fig. 2 assumes 100% RE supply. Similar graphs for a 75% RE supply scenario are shown in Fig. S2 in the ESI.†Fig. 2 shows that excess generation is available during the daytime for 100% solar, whereas excess energy is available during the evening and nighttime for 100% wind. At all times of the day, thermal loads account for a larger share of total load than non-thermal loads. Furthermore, in most cases, the entirety of the non-thermal load can be covered at all times by the RE supply (i.e., between 61% and 100% of the non-thermal load is below the grey shaded regions), meaning that non-thermal loads can be met directly from RE supply, without needing storage. This is especially true for any of the chosen RE mixes that include wind. In the wintertime, significant peaks in electric power needed for thermal loads emerge in the early morning (7–10 a.m.) and in the late evening (7–10 p.m.), driven by electrified space heating. Because these peaks are thermal in nature, and do not line up temporally with RE supply, they are particularly well-suited to be met using TES. Considering that the electric power needs of buildings are dominated by thermal loads, and that non-thermal loads can mostly be met directly from RE supply, there is a huge potential for TES in buildings.
Fig. 3 shows the total storage requirement in electrical equivalent to balance the 100% RE supply and demand profiles from Fig. 2, for both thermal and non-thermal loads for various RE scenarios. A similar graph for 75% RE supply is shown in Fig. S3 in the ESI.† These results indicate that the mix of RE generation will have a strong impact on the amount of storage needed to support buildings. Fig. 3 shows that, depending on the RE scenario, the total SDS requirement for buildings’ thermal loads ranges from ∼1200–4500 GW h. The amount of SDS potential to support thermal loads is equivalent to adding ∼24–90 million electric vehicles (a typical 200-mile range electric vehicle has a battery capacity of ∼50 kW h26). This large number would put further stress on material supply chains11 if Li-ion were to be considered as the main storage option to supply thermal loads for buildings.
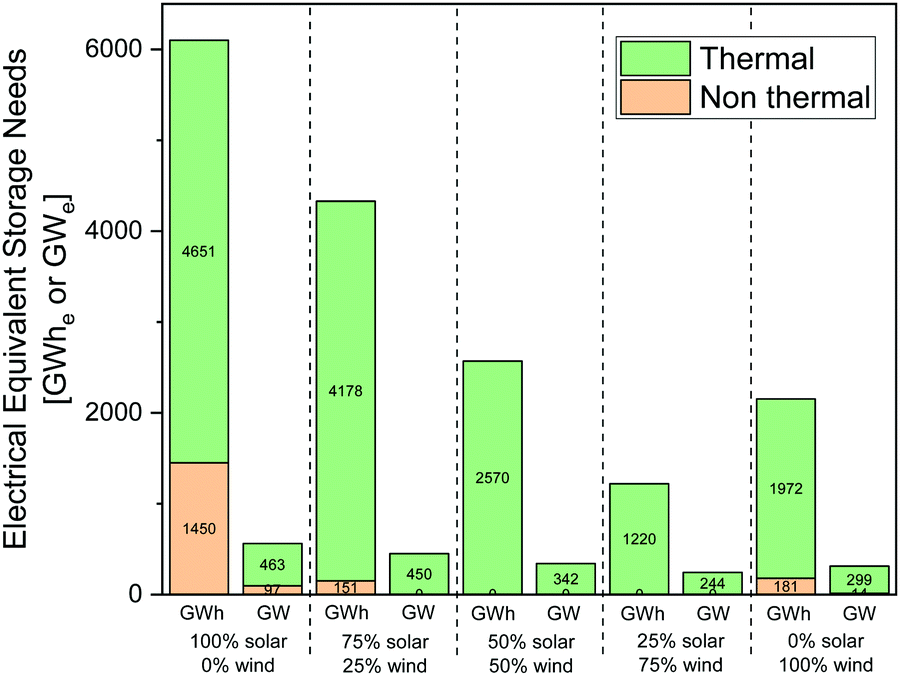 | ||
| Fig. 3 Energy storage required to support commercial and residential buildings in the United States for a 2050 grid with 100% RE, broken out into thermal and non-thermal contributions and assuming heating electrification using air-source heat pumps. A similar graph for a 2050 grid with 75% RE is shown in the ESI.† | ||
In general, storage capacity requirements decrease as the fraction of wind increases. This is because wind generation is more evenly distributed throughout the day and requires less shifting compared to solar, which is concentrated between the hours of 6 a.m. and 6 p.m. The scenario resulting in the lowest storage capacity needed is 25% solar and 75% wind, due to a good balance of wind generation at night and solar generation during the day. For the RE scenarios that have between 50% and 75% wind, storage needs can be met entirely by TES. This is because in those scenarios, RE supply is always greater than (or at least equal to) the electric power required for supporting non-thermal loads. Although we performed our analysis at the national level, it can easily be extended for spatial variation in the RE mix. For example, different U.S. regions are expected to have a different RE mix. In their low cost renewables scenario, the Energy Information Administration projects ∼193 GW of solar and only ∼6 GW of wind for the Southeast United States, compared with ∼120 GW of solar and ∼137 GW of wind for the mid-continent region.18 However, irrespective of the various permutations and combinations of RE mix, the key takeaway from this analysis is that the overall energy storage requirement to support thermal loads in buildings is very high. Furthermore, there are indications that in the future, due to significantly cheaper RE,18 it may be possible to use resistive heating as opposed to heat pumps in some situations due to lower technology cost. The energy storage needs for resistive heating will be significantly higher than for heat pumps because the COP of resistive heating is 1.
3 Levelized cost of energy storage on-site in buildings
3.1 LCOS derivation
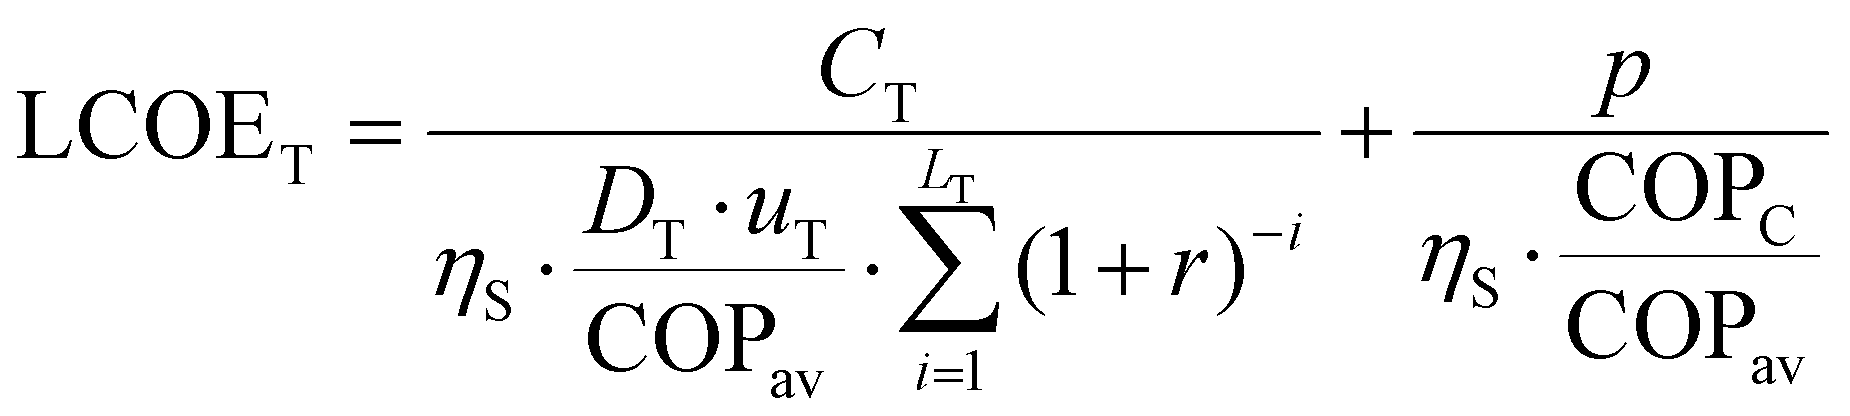
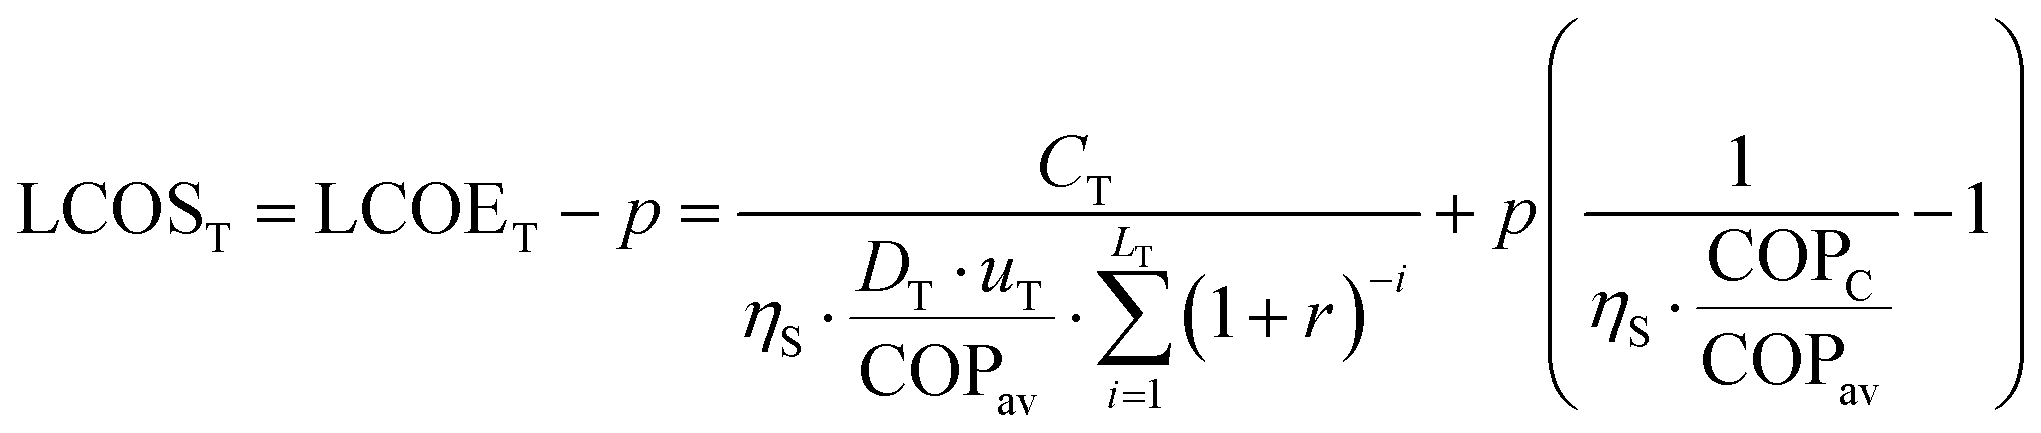
While there are a few studies in the literature1,27–29 that have presented expressions for LCOS, none have explicitly addressed LCOS for thermal energy storage to support buildings’ end uses. LCOS studies in the literature pertain to cases where both the input and output energy from storage is electricity. In LCOS calculations for thermal storage in buildings, the input energy is electricity, whereas the output energy is thermal. The LCOS is similar to the levelized cost of energy (LCOE), often used for the costs of power plants.30 There are two ways LCOS has been reported in the literature. The first includes the price of electricity to charge the storage in the LCOS metric. This treats the storage plant similarly to a generation plant and is mathematically the same as LCOE. By this definition, LCOS and LCOE are interchangeable. The price of electricity (p) to charge the storage depends on the LCOE of the electricity generation asset, such as a solar plant or fossil fuel plant. The second way that LCOS is reported in the literature is as the marginal cost of storage only (i.e., the cost of procuring electricity to charge the storage system is subtracted out). In this case, LCOS is given by LCOS = LCOE − p. In this paper, we have calculated LCOS according to the second definition, as it provides a basis for exclusively comparing the cost of various storage technologies. This is particularly important in the case of TES, as the output from the storage is thermal rather than electrical in nature. A detailed definition of LCOS and LCOE for the purposes of this perspective are included in Supplementary Note 3 of the ESI.†In calculating LCOS for thermal storage, the input energy is electricity and the output energy is thermal; thus, applying the second law of thermodynamics is essential to calculate the COP of the heat pump, which relates electricity to thermal energy. Furthermore, because COP depends on the ambient temperature, it can be leveraged to charge the TES more economically. For example, 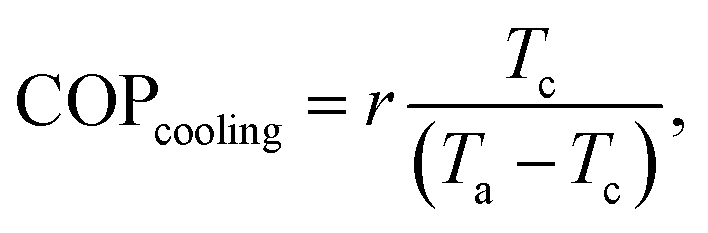 where Tc is the cold side temperature, Ta is the ambient temperature, and r is the non-ideality factor (<1) of deviation from the Carnot efficiency. Therefore, depending on the scenario, it is possible to charge the TES when Ta is low (i.e., during the night) to achieve a higher COP. Similarly, for heating, it is possible to charge the TES during the day to take advantage of higher Ta.
In this section, we derive a new LCOS framework that incorporates performance parameters specific to TES and building systems. We also derive an equivalent LCOS expression for an EES system driving a building heat pump, enabling direct comparison of EES + heat pump and TES + heat pump.
We start by deriving the LCOE, which is the ratio of the cost of building and operating the energy storage to the value of the storage (the value of the storage is defined as the lifetime value of the grid electricity that is avoided during peak periods). The costs can be broken down into the sum of the capital cost and the charging cost:
 | (1) |
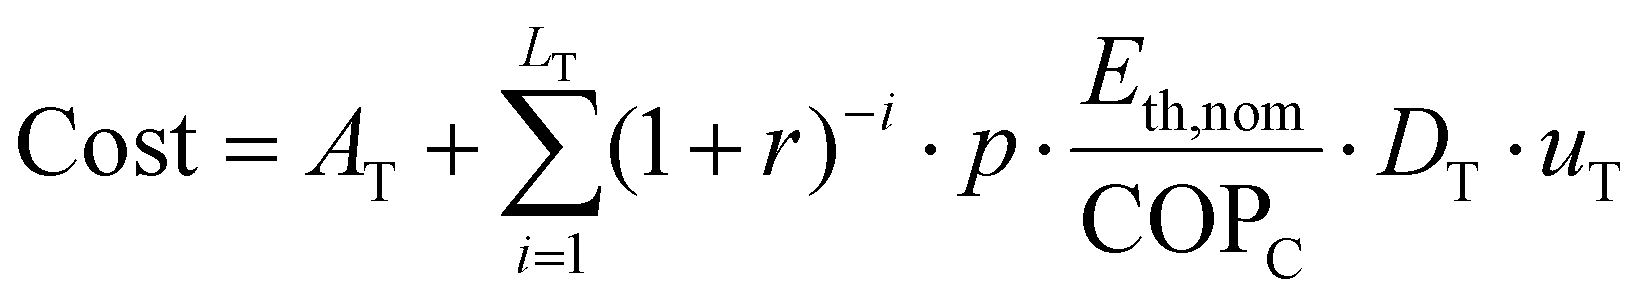 | (2) |
As discussed in Section 1, TES charged by a heat pump can take advantage of ambient temperature variation due to time shifting capability. In the absence of TES, time shifting capability is lost, and the cooling or heating load is met directly by a heat pump that operates at a certain COP without taking advantage of ambient temperature variation. This results in a lower COP than at the time of charging the TES. Therefore, the value of the TES (lifetime energy stored) must be adjusted to reflect the benefit of this avoided COP. The electric equivalent of the lifetime thermal energy delivered from TES can be written as:
| Value = lifetime grid electricity avoided | (3) |
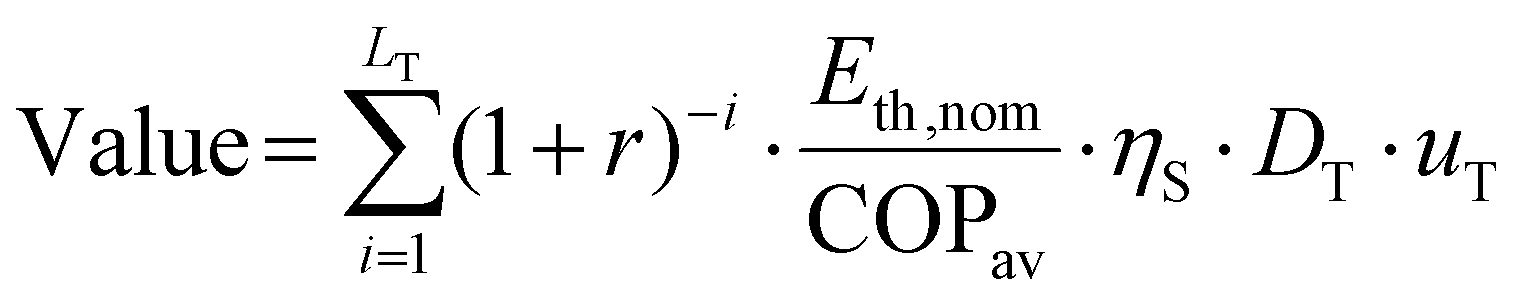 | (4) |
 | (5) |
 | (6) |
Each of the main parameters in LCOST (CT, ηS, DT·uT, LT, and COPC/COPav) are influenced by material-, device-, and system-level properties. For example, the capital cost, CT ($/kW h), is dependent on the specific capacity (kW h/kg) of the TES material being used and the material cost ($/kg). The storage efficiency (ηS) depends on how well insulated the TES material is from ambient temperature to minimize sensible heat losses/gains. The utilization (DT·uT) can be increased by developing TES materials with tunable transition temperatures or developing system configurations that can use a single transition temperature PCM for heating and cooling. Lifetime (LT) depends on the cycle life of the TES material/system. For systems utilizing PCMs, maximizing the charging efficiency (i.e., COPC) will require PCMs with transition temperature optimized for the charging/discharging process (e.g., minimizing temperature lift for PCM-integrated air-conditioning). Various factors that influence these parameters, and associated R&D pathways, are discussed in detail in Section 4.
A similar derivation yields the LCOS for an EES + heat pump system:
 | (7) |
With RE, the question of which RE source takes most advantage of ambient temperature becomes an interesting one. For example, for wind, more energy is available at night (Fig. 2(c) and (f)) whereas for solar, more energy is available during the day (Fig. 2(a) and (d)). Therefore, for wind-dominated RE, Ta variation helps for cooling, with the heat pump operational at night and cooling delivered using TES when needed. For solar dominated RE, Ta variation helps for heating, with the heat pump operational during the day and heating delivered using TES when needed. EES such as Li-ion batteries cannot directly meet thermal loads, but must be used to run the heat pump compressor to meet thermal loads. Therefore, the heat pump is operational when cooling or heating are needed and EES cannot take advantage of Ta variation. As a result, in LCOS calculations, when the heat pump is operational needs to be taken into consideration. The LCOS calculations are based on electrical energy rather than thermal energy, as it is assumed that the TES is charged using electrical energy. This also allows for comparison with EES on the same basis.
3.2 LCOS comparison of EES and TES
Using the LCOS expressions for EES + heat pump (eqn (6)) and TES + heat pump (eqn (5)) derived in the previous section, we can compare the LCOS of the two technologies for a range of input parameters. Fig. 4 shows a comparison of LCOST and LCOSEversus utilization (D·u), with different assumptions applied to the TES system and for a range of capital costs. The basis for the assumed values is discussed in depth in the ESI.† Our calculated values of LCOSE are consistent with other studies in the literature. Schmidt et al.28 projected that the LCOE of Li-ion for energy arbitrage services will drop from a range of $0.22/kW h–$0.62/kW h to $0.1/kW h–$0.22/kW h between the years 2020 and 2050. The authors conducted their study by considering a range of parameters. As discussed in Section 3.1, LCOE = LCOS + p. In our case, we assumed p = $0.13/kW h. Based on the results shown in Fig. 4, our LCOE (LCOS + p) is ∼$0.33/kW h for state-of-the-art Li-ion and ∼$0.21/kW h for next generation Li-ion. These results are consistent with the results of Schmidt et al.28 | ||
| Fig. 4 LCOS comparison of TES + heat pump to EES + heat pump for four sets of TES baseline assumptions. (a) high COPC/COPav, high storage efficiency; (b) low COPC/COPav, high storage efficiency; (c) high COPC/COPav, low storage efficiency; (d) low COPC/COPav, low storage efficiency. | ||
In Fig. 4, the darker shaded regions represent LCOS for current state-of-the-art TES and EES technology, as well as achievable LCOS based on next-generation technology. The advancements required to develop next-generation technology are discussed in Section 4 (Research Directions) of this paper. The four graphs shown in Fig. 4 represent different assumptions for COPC/COPav and TES storage efficiency (ηS), namely, high COPC/COPav and high storage efficiency (a), low COPC/COPav and high storage efficiency (b), high COPC/COPav and low storage efficiency (c) and low COPC/COPav and low storage efficiency (d). The values of high and low COPC/COPav are 1.4 and 1, respectively, and the high and low storage efficiencies are 95% and 70%, respectively. These are summarized in Table 1. Other parameters assumed are a TES lifetime (LT) of 20 years, EES lifetime (LE) of 10 years, avoided heat pump COP (COPav) of 3, discount rate (r) of 7.5%, and price of electricity (p) of $0.13/kW he. The fairly high discount rate was chosen to reflect a higher risk/uncertainty of TES in buildings due to its status as a relatively new technology with limited deployment. The rationale behind the assumed values above is presented in the ESI;† however, different assumptions can be used with the equations laid out here to evaluate LCOS under different scenarios.
| Fig. 4 Panel | COPC/COPav | η S | Example scenario |
|---|---|---|---|
| (a) | 1.4 | 0.95 | Well-insulated TES system in a location with large diurnal temperature swings (e.g., Denver, CO) |
| (b) | 1 | 0.95 | Well-insulated TES system in a location with little-to-no diurnal temperature swings (e.g., San Diego, CA) |
| (c) | 1.4 | 0.7 | Poorly insulated TES system in a location with large diurnal temperature swings (e.g., Denver, CO) |
| (d) | 1 | 0.7 | Poorly insulated TES system in a location with little-to-no diurnal temperature swings (e.g., San Diego, CA) |
One of the challenges in comparing TES with EES is that reliable capital cost numbers and future projections for Li-ion batteries are well documented, whereas capital cost numbers for TES are sparse. Limited data available in the literature suggest that the cost of TES should be below $50/kW hth for both cold and hot storage. Significant research has been done on hot storage in the concentrating solar power (CSP) community. Currently, the U.S. DOE target is $15/kW hth33 for hot storage for CSP; however, data from existing CSP plants shows current costs in the range of ∼$38/kW hth (∼$90/kW he assuming standard Rankine steam cycle efficiency of 42%).34 For cold storage, data on ice and chilled water storage shows costs in the range of ∼$30/kW hth–$50/kW hth.35,36 The U.S. DOE has also set a materials cost target of $15/kW hth for buildings TES.37 Considering the variability and uncertainty in costs for state-of-the-art TES, we have assumed a conservative estimate of $25/kW hth–$75/kW hth, with a more optimistic range of $15/kW hth–$25/kW hth for next-generation TES. Developing a robust cost database for on-site TES in buildings should be undertaken as an exercise by TES researchers and practitioners.
Each graph represents different potential TES use cases within a building. For example, Fig. 4(a) (high COPC/COPav and high storage efficiency) represents a use case of well-insulated TES in a location with large diurnal swings in ambient temperature (e.g., Denver, Colorado). The large diurnal swing in ambient temperature results in a high COPC/COPav, while the tight insulation TES system results in high storage efficiency. Fig. 4(b), on the other hand, represents a use case of well-insulated TES integrated in a location with little-to-no diurnal swing in ambient temperature, resulting in low COPC/COPav. Fig. 4(c) is a use case with poorly insulated TES (resulting in low storage efficiency) in a location with large diurnal ambient temperature swings. Fig. 4(d) is the same, but in a location with little-to-no ambient temperature diurnal swing (e.g., San Diego, California).
As depicted in Fig. 4(a), state-of-the-art TES technology does not allow high utilization (i.e., year-round use) because current TES materials can only be activated for a limited range of temperatures.38 HVAC-integrated TES must be designed for heating or cooling, and envelope-integrated TES utilizing PCMs is most effective at certain times of the year,38 leading to low utilization. For this reason, we have assumed a conservative utilization for state-of-the-art TES of 90–180 cycles per year (i.e., one complete cycle per day for 3–6 months). A location with balanced seasons such as Charlotte, North Carolina or the Midwestern United States might have utilization closer to 90 cycles per year, whereas a cooling-dominated or heating-dominated location such as Phoenix, Arizona or Duluth, Minnesota might have utilization closer to 180 cycles per year for cooling TES and heating TES, respectively. In contrast, EES can be used year-round at high utilization due to the year-round presence of electrical loads in buildings. Despite this, as shown in Fig. 4(a), state-of-the-art TES is still competitive with state-of-the-art EES today due to lower capital cost, longer lifetime, and the efficiency benefit of large diurnal ambient temperature swings on COPC/COPav. Fig. 4(b) shows that even without the efficiency benefit of high COPC/COPav, state-of-the-art TES is still competitive with Li-ion EES storage. However, in the scenario where TES has low efficiency (ηS) and no benefit from high COPC/COPav (Fig. 4(d)), state-of-the-art Li-ion achieves lower LCOS compared to TES. In summary, even today, TES can be competitive with Li-ion in applications where TES can be deployed with high storage efficiency (ηS) and/or high COPC/COPav. With targeted R&D, there is greater room for further lowering the LCOS of TES beyond that of Li-ion, particularly due to currently low utilization. At high enough utilization, TES can achieve negative LCOS, providing a return on investment that is not possible with EES systems, as shown in Fig. 4(a).
Fig. 4 shows the effect of some parameters on the LCOS, but the LCOS also depends on the equipment the storage is connected to, and the price of the electricity required for charging. Fig. 5 shows some non-intuitive effects from these parameters that arise because of how thermal storage works. First, consider Fig. 5(a–c), which shows the LCOST for a range of utilizations, and for three values each of the capital cost and the COP of the baseline system (COPav). As an example, the COP of an electric resistance heater would be 1 (all the electrical energy is turned into heat). The COP of a heat pump depends on the application's temperatures—both the climate and the delivery temperature. As an example, an air conditioner in a mild climate might have a COP of nearly 6, while in a hot climate, the COP might be closer to 3.
 | ||
| Fig. 5 The LCOS for thermal storage depends on many factors. | ||
As shown in Fig. 5, the LCOS increases as the avoided COP increases, meaning that thermal storage would be more cost-effective in an extreme climate compared to a mild climate, all else being equal. This is because each Joule of energy stored thermally is offsetting less electrical energy for the higher COP applications (milder climate). For a case where the capital cost is $75/kW hth, and the utilization is 125 cycles per year, the LCOS is −$0.03/kW he, $0.15/kW he and $0.34/kW he, for COPav values of 1, 3, and 6, respectively, showing how important the application can be to the cost-effectiveness of TES. By contrast, the LCOS for batteries would be the same for all these cases, meaning that some applications are better suited for TES than others.
The LCOS is not as sensitive to the avoided COP when the capital cost of the storage is low. In such cases, the charging cost dominates in eqn (5), and therefore the avoided COP becomes unimportant (only the ratio of the COPs matters, which for Fig. 5(a–c) is fixed at 1.4. Fig. 5(d–f) shows the effect of this ratio for a fixed COPav and three values for COPC/COPav: 1, 1.5, and 2. As noted above, the most common way to get to a COPC/COPav greater than 1 is to leverage diurnal temperature swings. COPC/COPav is in the charging term in eqn (5), which means its importance will depend on the price of electricity for charging, p. For low p, the charging term is small and COPC/COPav changes the LCOS by only ∼$0.02/kW he (Fig. 5(d)). For high p, the LCOS changes by more than $0.12/kW he as COPC/COPav changes from 1 to 2 (Fig. 5(f)). Thus, it is advantageous to design TES systems, or select TES applications, that can take advantage of diurnal temperature swings and increase COPC/COPav. This means targeting areas with more extreme climate conditions, like Chicago, Illinois in winter or Miami, Florida in summer, rather than areas with a mild climate, like San Diego, California.
These results show that TES can have an equal or greater cost-effectiveness than Li-ion in many cases, even today. The energy community is realizing that large scale use of Li-ion batteries poses serious challenges in terms of material supply, sustainability, and environmental impact.39 The equal or greater cost-effectiveness of TES compared with Li-ion, combined with the scarcity9,10 of Li-ion materials and safety hazards40 they present in certain scenarios, makes a very compelling case for greater emphasis on research, development, demonstration, and deployment of TES technologies for buildings. However, an important remaining question is how significant of a role TES can play in a future with significant penetration of RE when large amounts of storage will be needed. Fig. 4 shows that even for next-generation Li-ion, the LCOS will be $0.05/kW h at best in buildings applications. Recently, the U.S. DOE set a goal of reaching less than $0.05/kW h for widespread deployment of energy storage.41 Current (state-of-the-art) TES (assuming a conservative capital cost, as mentioned previously) has an LCOS of $0.05/kW h–$0.22/kW h (Fig. 4(a)) which is already fairly close to the LCOS of advanced (next-generation) Li-ion ($0.05/kW h–$0.12/kW h). As a real world example, a case study was conducted on Stanford University's campus district energy system, which included thermal storage via hot and chilled water tanks.42 TES led to 3.5% ($0.77 million) in direct savings via peak load reduction and contributed to a 65% reduction in the overall campus carbon footprint and a 15% reduction in annual peak power demand. The authors found that an equivalent system utilizing electrochemical batteries for storage instead of TES would have had to cost less than $45/kW h to be as financially attractive—a cost target that batteries are still a long way away from meeting.
Further advancement in TES can significantly further reduce the LCOS of TES and enable an LCOS lower than the U.S. DOE target of $0.05/kW h. Our calculations show that for the various scenarios considered in Fig. 4 and 5, a LCOS of less than $0.05/kW h can be achieved with the right combination of low capital cost ($15/kW hth–$25/kW hth), high utilization, and high efficiency (ηS and COPC/COPav). LCOS less than $0/kW h is even possible with high enough COPC/COPav. The CSP community is already developing high temperature TES with a capital cost target of $15/kW hth. Thermal storage materials developed for CSP are not directly applicable to building applications; however, as discussed in the next section, a targeted R&D approach can help further reduce the LCOS of TES for building applications.
4 Research directions
We identified six R&D opportunity areas that can increase the competitiveness of TES technologies. These include five that align with the subtopics in Section 4: reductions in capital cost and improvements in round-trip efficiency, utilization, lifetime, and charging efficiency. The sixth area is the development of TES standards and protocols, to help with comparing technologies across different companies or researchers.Because thermal energy can be stored in sensible, latent, or chemical form, there is a wide range of TES systems, which are currently at different technology readiness levels. We recognize this and acknowledge that the research needs to further development for each TES system will be quite different depending on use case and state-of-the-art.
4.1 Capital cost (CT)
The capital cost for thermal storage comes from the material cost, the components that move heat into and out of the material, and the cost to integrate the TES into the building (this includes additional components and installation costs). Because part of the cost of the thermal storage is directly related to the cost of the storage material, to reduce the capital cost, it is essential to maximize the available storage capacity for a given mass of material. This available energy depends upon the maximum energy density (the available storage capacity) and the power density (the speed at which it can be accessed).43 These key attributes of TES systems need to be optimized both at the material and system levels, as there is a strong correlation between material properties, the design of the heat exchanger, and operating conditions. A recently published work by Woods et al.43 stressed these correlations and demonstrated how rate capability and Ragone plots provide a framework for defining material property targets. This framework can be a critical design and optimization tool for researchers and practitioners developing thermal storage materials and heat exchangers. The study leveraged analogies between electrical transport in batteries and thermal transport in TES (the paper focused on PCMs, but the framework could be extended to other TES materials) to clearly describe the trade-off between energy and power using thermal Ragone plots. For material optimization, the goal should be to push the Ragone curve up (higher power) and to the right (higher energy). For example, although PCMs have decent energy densities, they typically have low thermal conductivities, which result in poor power densities. So far, materials research has been focused on increasing thermal conductivity by adding thermally conductive fillers to the PCMs or using thermally conductive matrices to contain it. This does increase the power densities, but at the expense of energy density, as the filler or matrix displaces some of the PCM. The energy density also impacts the footprint, which is largely dependent on volumetric energy density. Volumetric energy density is especially important when the cost of the material is low.Besides the materials, the cost of the other system components also drives the capital cost. Some TES systems use materials with low costs, like water and salts, while others are more expensive. This perspective focuses on short duration storage, however, the need for low capital cost TES is even more critical for seasonal storage which is cycled only a handful of times per year. As shown in our LCOS framework (eqn (5)), LCOS is inversely proportional to utilization, so seasonal storage must be extremely cheap to achieve LCOS comparable to short duration storage. As an example, if the utilization for short duration storage is 120 cycles/year but only 4 cycles/yr for seasonal storage, all else equal, the capital cost for seasonal storage would need to be 30 times lower than short duration storage to maintain the same LCOS. Research efforts are needed for both new, high-performing, low-cost materials and novel system designs that utilize currently available low-cost materials. These two aspects are discussed in the next two subsections.
4.2 Material discovery
Research in TES is far behind relative to research in electrochemical energy storage, where new advances in innovative experimental tools with higher spatial and temporal resolution, in situ and operando characterization, first-principles simulation, high-throughput computation, machine learning, and artificial intelligence work collectively to reveal the origins of electrochemical phenomena and enable new battery chemistries.44 The battery community has also progressed significantly because of the Materials Project,45 which exploited the power of supercomputing and state-of-the-art electronic structure methods to provide open web-based access to computed information on known and predicted materials. It also provided users with powerful analysis tools to inspire and design novel materials. Similar efforts for material development are required for TES. Computationally guided discovery of new materials could aid in the identification of new molecules, materials, and chemistries with high energy density. For example, in the case of thermochemical materials where energy is stored in the chemical reaction, researchers carried out computational screening of 265 hydration reactions using density functional theory calculations,46 and more than half of these reactions appeared to be new to the TES literature. Similar efforts need to be extended for other classes of TES materials.We also need to investigate how to design new PCMs. For example, for monoatomic elements, Lilley et al.47 developed a model to predict the entropy of melting, rather than determining it from experimental data and/or empirical rules. This model could be useful in predicting the performance of new materials in the absence of extensive experimental thermodynamic data, especially in applications requiring multi-phase thermodynamic cycles, such as refrigeration, heat exchange and thermal storage. A model that can explain the entropy change at melting can be directly used to design PCMs, because the heat absorbed or released on melting—the enthalpy change—is directly proportional to the entropy change. Combining these efforts with combinatorial synthesis and high-throughput characterization for TES materials could then help expedite realization of these new materials.
4.3 Novel TES system designs
As described previously, TES systems can be integrated into building envelopes or building equipment and appliances. The new materials described above could replace the TES in existing system architectures, but there is a need for new system designs as well. In some cases, the cost of the TES material is low (e.g., water/ice as a PCM), but the cost of the heat exchanger that transfers heat to or from the TES, as well as other components like valves and additional pumps, are nontrivial; these are shown as ‘other costs’ in Fig. 6. While a cost-effective solution exists for some applications—for example, using ice or chilled water tanks in large central chiller plants48,49—integrating TES into smaller systems is more challenging. In the United States, nearly all residential floor space, and 75% of commercial floor space, are conditioned by smaller rooftop units and split-system air conditioners and heat pumps, rather than by large central plants.50 This points to the need for new R&D to determine cost-effective methods for integrating TES into building systems, particularly packaged systems51 and hybrid systems.52 This could include sensible TES, solid/liquid PCMs, solid/solid PCMs, and solid/gas reactions in thermochemical materials. It could also include some nontraditional approaches to storage, such as storing the “air drying potential” of a concentrated salt solution. These salt solutions, called liquid desiccants, can be concentrated with thermal or electrical energy, and then the low activity of the salt solution can be used to absorb water vapor from the air.53,54 | ||
| Fig. 6 (a) Comparison of state-of-the-art Li-ion technology with targets set by the USABC for all electric vehicles with a 200-mile range, adapted from Auston et al.62 (b) There is a similar need for technology targets and benchmarking for TES applications in buildings. | ||
4.4 Utilization (DT·uT)
At present, most TES systems have a low utilization factor, as shown in Fig. 4. Utilization can be greatly enhanced if the TES systems can stay active (undergo charge/discharge cycles) in all seasons throughout the year, and if there is an increased ability to control when thermal energy is charged/discharged. This observation applies to TES systems using PCMs and thermochemical materials. PCMs can store appreciable amounts of thermal energy as latent heat, but typically, the phase transition of these materials occurs in a narrow band of temperatures. This limits their usage to either the heating or cooling season, both of which are present in much of the United States and the rest of the world. This means that at certain times of the year, when the temperature does not cross over the transition temperature range, the PCM is only storing energy in sensible form or in a partially melted state. This translates to the storage medium not being fully utilized. Dynamically tunable thermal storage materials that can modify their switching temperature or characteristics to operate optimally in both summer and winter can significantly increase the utilization of TES systems, lowering the LCOS. Mumme et al.55,56 simulated the effect of tunability on utilization and showed that the utilization factor of a PCM with a transition temperature (Tm) that changes with the ambient temperature can increase by a factor of 19 when compared to that of non-tunable (static) PCM.For HVAC-integrated TES, utilization of PCMs can also be improved by designing a system architecture that can work with a fixed transition temperature. For example, a PCM with a transition near room temperature could be used as a heat sink for a heat pump in the summer and as a heat source for a heat pump in the winter. Many configurations and transition temperatures are possible, and more research is needed to explore them and understand their tradeoffs.
Another challenge to TES utilization is the ability to control charging and discharging. For state-of-the-art envelope TES, heat flows tend to occur through passive components. Current approaches are passive, utilizing PCMs with fixed transition temperatures and transport properties. Thermal circuit elements (analogous to electrical circuits), including diodes, switches, and transistors,57 which could control directional heat and mass transfer and thus provide control over the timing of charging or discharging, could lead to a paradigm shift in thermal energy utilization.58
Utilization can be limited by fundamental materials issues, such as supercooling in PCMs. As an example, consider a PCM with a transition temperature of 20 °C that is used in building applications. If the lowest temperature the building can reach is 15 °C, then a PCM with supercooling greater than 5 °C will never crystallize, and the material will be rendered inert. In this case, the only thermal energy stored is from sensible—as opposed to latent—heat. Because supercooling depends upon many material and system parameters (e.g., geometry, volume, material, microstructure, purity, and heating/cooling rate), it is difficult to use lab-scale data to predict supercooling behavior for larger systems. Hence, there is a need to develop a robust theoretical framework which can predict supercooling performance in large-scale thermal energy storage applications. A recently published paper by Lilley et al.59 developed a theoretical framework for using lab-scale experimental characterization to predict supercooling in a generalized system, which may be much larger than lab scale and may include substantial temperature gradients. Such models can be further developed and used in conjunction with existing numerical methods to accurately incorporate supercooling into phase change models, thus combining material modeling with system modeling.
Another possible option to increase TES utilization is to create electricity by pairing the TES with a heat engine such as an Organic Rankine Cycle (ORC) to convert stored thermal energy back to electricity. This electricity can be used to meet non-thermal loads also, increasing utilization. However, we expect the LCOS of that electricity to be very high due to the increased capital cost, the very low efficiency of such small/modular ORCs operating with moderate temperature (100–150 °C) heat input, and a lower COP ratio because of the high temperature lift required to charge the storage.
4.5 Charging efficiency (COPC)
Charging efficiency (COPC) can have a large impact on LCOS (see Fig. 4). When coupled with a heat pump, charging efficiency depends on the temperature lift. This points to a need for improved system designs to minimize temperature lift during charging. For example, for cold storage, making ice at 0 °C requires a larger temperature lift, and therefore more energy, than freezing a PCM at 10 °C. We can also improve charging efficiency by using systems that can modulate compressors to lower speeds. At low compressor speed, refrigerant temperatures approach source and sink temperatures, minimizing temperature lift and improving efficiency. This approach requires applications where the charging period is long enough that charging rates are slow.The time that the COPC is highest (e.g., low ambient temperatures for cooling, high ambient temperatures for heating) may not always align with the time that electricity prices are low or when RE is available. Thus, there is also a need for novel system designs that have high charging efficiency during unfavorable ambient temperatures. One example is thermochemical materials or liquid desiccants, which are charged by dehydrating with heat. This dehydration could occur during hot ambient temperatures to align with peak solar PV generation, and then the material could be used in a hydration reaction for a thermochemical cooling cycle or for dehumidifying humid air.
Charging efficiency can also be improved by using ambient heat to charge the TES. If a TES system is designed with a transition temperature that is between the daytime and nighttime temperatures, it could automatically charge when the temperature direction is favorable (e.g., at night, a PCM could be frozen with free ambient-air cooling or nighttime radiative sky cooling). This could be an active system, which would require moving a heat-transfer fluid from ambient to a TES system, or a passive system, which would automatically charge the TES. A passive system could leverage the tunable PCMs described above, making it easier to absorb or reject heat to ambient. Thermal switches could also be used to control when heat is released or stored, depending on ambient temperatures.
Charging efficiency will also depend on the level of supercooling in a PCM. Significant supercooling means that the charging COP will be much lower because heat needs to be pumped from a much lower temperature whereas the energy from TES will be delivered at higher temperature. Because supercooling depends on the size and boundary conditions of a system,59 relating supercooling obtained at lab scale to system scale is critical to understanding the impact on charging efficiency.
4.6 Storage efficiency (ηS)
The storage efficiency is the ratio of the thermal energy discharged from a TES to the thermal energy stored in a TES at the end of charging. During the storage period, it is critical that the stored energy does not lose or gain energy from the ambient. This can be achieved with cost-effective insulation but is more challenging for envelope-integrated TES systems, which interact directly with the indoor or outdoor environment during charging and discharging. Dynamic insulation or the use of thermal switches can help improve storage efficiency.4.7 Lifetime (LT)
Any investment in building technologies must last for multiple years (ideally the lifetime of the building or equipment that the TES is integrated with). The longer the storage systems last, the more useful charge and discharge cycles the owner will get out of the investment. Though they still have their own degradation mechanisms, TES materials are believed to be able to outlast electrochemically based battery technologies. Although many traditional TES systems (water tanks and ice storage) have minimal to no capacity degradation over their lifetime, as we move to install new TES systems with high utilization, understanding the evolution of material properties over the lifetime becomes critical. Factors such as supercooling, metastable phases, phase separation, mechanical pulverization, and other structural changes can significantly affect performance over the TES lifetime. There is a need to develop standardized testing protocols to test for lifetime performance. The use of standard protocols for accelerated testing, along with new characterization tools and techniques to understand and solve these fundamental issues, can significantly improve the economics of these technologies.4.8 Development of TES standards, characterization protocols, and technology roadmap
In addition to lifetime testing, it is important to establish testing protocols and TES standards to increase adoption of TES technologies. Protocols and standards will allow for cross-comparison of products and materials, ensure product quality, establish lifetime performance, and give confidence to manufacturers and end users. The battery community has benefited significantly from the development of such standards, as they provided a basic framework for battery manufacturers, system integrators, and vehicle assemblers to refer to when comparing products, checking for compatibility or interchangeability of products, or accelerating the development of improved products. Although some work has been done in the past to develop testing protocols for TES, especially for sensible TES and PCMs,60 it is not comprehensive, and these standards need to be reviewed or revised to make sure they stay relevant amid technology developments and new applications. The absence of TES standards and testing protocols has been recognized by the research community, and some efforts are currently underway61 to develop design, construction, testing, maintenance, and operation requirements for TES systems for the life cycle of the equipment.Finally, like with Li-ion research, there is a need to develop technology targets for various TES applications in buildings, with continuous benchmarking of state-of-the-art status. Fig. 6(a) shows a spider chart in which state-of-the-art Li-ion battery technology for vehicle applications is compared to targets set by the U.S. Advanced Battery Consortium (USABC).62 Similarly, there is a need for the TES community to develop a set of targets (Fig. 6(b)) for TES applications in buildings, enabling researchers to benchmark state-of-the-art technology performance. This will help to significantly accelerate TES research, development, and deployment.
5 Summary
In this perspective, we make the case for on-site TES in buildings to shift thermal loads in buildings. We show that both summer and winter peak electricity loads in U.S. buildings in 2050 will be driven by thermal loads, which comprise space heating, space cooling, water heating, and refrigeration. We also showed that these peaks are temporally mismatched with RE supply. The fact that these peaks are thermally driven and do not line up with RE supply makes them particularly well-suited to be shifted using TES, at potentially lower cost. We introduced a framework to calculate the LCOS for on-site TES in buildings, enabling comparison with EES on the same baseline. While EES has the advantage of high utilization year-round due to the year-round presence of electric loads in buildings, state-of-the-art TES is still competitive with EES in terms of LCOS, due to lower capital cost and longer lifetime. Furthermore, because of the effect of diurnal ambient temperature swings on heat pump efficiency, TES can provide an energy efficiency benefit, resulting in negative LCOS at higher utilization. This provides a return on investment that is not possible with EES systems.With targeted R&D, there is significant room for improvement in TES, particularly due to currently low utilization, which further reduces the LCOS. With targeted R&D in 6 key areas—namely, reductions in capital cost, improvements in round-trip efficiency, utilization, lifetime, charging efficiency, and development of TES standards and protocols, the competitiveness of TES technologies can be greatly enhanced, moving toward widespread deployment in buildings at low cost.
In addition to targeted R&D in these 6 key areas, additional efforts in areas such as technoeconomic analysis and policy could go a long way to drive deployment of TES in buildings. Technoeconomic analysis will help define and quantify the value streams that TES deployed in buildings will create. This will enable calculation of payback periods which are dependent on many highly variable factors such as utility rate structure and the cost of alternative technology solutions. New policy options and the associated analysis of their effects will play a critical role also. Cheap natural gas may delay the transition to fully electrified buildings that utilize heat pumps and TES. However, to really make a dent in greenhouse gas emissions, we will need to electrify building heating using renewable energy. Some states/municipalities are already requiring a shift to electricity from natural gas. Some cities will also start to penalize large commercial buildings for their carbon emissions, a significant fraction of which come from fuel-fired heating.63 As we push toward a carbon-free grid, how utilities design their rate structures will likely change. There are already indications that rate structures may start to account for the carbon price of fossil fuel generation through novel approaches such as locational marginal emissions (LMEs),64 which quantify the carbon footprint of power injected into the grid at a given location and time. LMEs can be adopted to measure and incentivize clean energy sources. At the local level, building codes will also play a role, and have already emerged as powerful tools against climate change. They can be used by state and local governments to mandate and enforce technologies that support electrification and decarbonization such as heat pumps and TES.
Conflicts of interest
There are no conflicts to declare.Acknowledgements
This work was co-authored by the National Renewable Energy Laboratory, operated by Alliance for Sustainable Energy, LLC, for the U.S. Department of Energy (DOE) under Contract No. DE-AC36-08GO28308, Lawrence Berkeley National Laboratory, operated by the University of California, for the U.S. DOE under Contract No. DE-AC02-05CH11231, and Oak Ridge National Laboratory, operated by UT-Battelle, LLC, for the U.S. DOE under Contract No. DE-AC05-00OR22725. Funding provided by the U.S. Department of Energy Office of Energy Efficiency and Renewable Energy Building Technologies Office. The views expressed in the article do not necessarily represent the views of the DOE or the U.S. Government. The U.S. Government retains and the publisher, by accepting the article for publication, acknowledges that the U.S. Government retains a nonexclusive, paid-up, irrevocable, worldwide license to publish or reproduce the published form of this work, or allow others to do so, for U.S. Government purposes.References
- P. Albertus, J. S. Manser and S. Litzelman, Long-Duration Electricity Storage Applications, Economics, and Technologies, Joule, 2020, 4, 21–32, DOI:10.1016/j.joule.2019.11.009.
- J. A. Dowling, et al., Role of Long-Duration Energy Storage in Variable Renewable Electricity Systems, Joule, 2020, 4, 1907–1928, DOI:10.1016/j.joule.2020.07.007.
- T. M. Gür, Review of electrical energy storage technologies, materials and systems: challenges and prospects for large-scale grid storage, Energy Environ. Sci., 2018, 11, 2696–2767, 10.1039/C8EE01419A.
- M. A. Pellow, C. J. M. Emmott, C. J. Barnhart and S. M. Benson, Hydrogen or batteries for grid storage? A net energy analysis, Energy Environ. Sci., 2015, 8, 1938–1952, 10.1039/C4EE04041D.
- D. Ürge-Vorsatz, L. F. Cabeza, S. Serrano, C. Barreneche and K. Petrichenko, Heating and cooling energy trends and drivers in buildings, Renewable Sustainable Energy Rev., 2015, 41, 85–98, DOI:10.1016/j.rser.2014.08.039.
- The heat is on, Nat. Energy, 2016, 1, 16193 DOI:10.1038/nenergy.2016.193.
- Electric Power Monthly with Data for May 2020. (United States Energy Information Administration, Washington, D.C.).
- Y. Chen, et al., Li metal deposition and stripping in a solid-state battery via Coble creep, Nature, 2020, 578, 251–255, DOI:10.1038/s41586-020-1972-y.
- K. Turcheniuk, D. Bondarev, V. Singhal and G. Yushin, Ten years left to redesign lithium-ion batteries, Nature, 2018, 559, 467–470, DOI:10.1038/d41586-018-05752-3.
- I. Y. L. Hsieh, M. S. Pan, Y.-M. Chiang and W. H. Green, Learning only buys you so much: Practical limits on battery price reduction, Appl. Energy, 2019, 239, 218–224, DOI:10.1016/j.apenergy.2019.01.138.
- P. Greim, A. A. Solomon and C. Breyer, Assessment of lithium criticality in the global energy transition and addressing policy gaps in transportation, Nat. Commun., 2020, 11, 4570, DOI:10.1038/s41467-020-18402-y.
- M. Waite and V. Modi, Electricity Load Implications of Space Heating Decarbonization Pathways, Joule, 2020, 4, 376–394, DOI:10.1016/j.joule.2019.11.011.
- H. Akeiber, et al., A review on phase change material (PCM) for sustainable passive cooling in building envelopes, Renewable Sustainable Energy Rev., 2016, 60, 1470–1497, DOI:10.1016/j.rser.2016.03.036.
- S. A. Memon, Phase change materials integrated in building walls: A state of the art review, Renewable Sustainable Energy Rev., 2014, 31, 870–906, DOI:10.1016/j.rser.2013.12.042.
- N. A. Sepulveda, J. D. Jenkins, F. J. de Sisternes and R. K. Lester, The Role of Firm Low-Carbon Electricity Resources in Deep Decarbonization of Power Generation, Joule, 2018, 2, 2403–2420, DOI:10.1016/j.joule.2018.08.006.
- M. Ferrara, Y.-M. Chiang and J. M. Deutch, Demonstrating Near-Carbon-Free Electricity Generation from Renewables and Storage, Joule, 2019, 3, 2585–2588, DOI:10.1016/j.joule.2019.08.007.
- S. Moores, The Global Battery Arms Race: Lithium-Ion Battery Gigafactories and their Supply Chain, The Oxford Institute for Energy Studies, 2021 Search PubMed.
- U.S. Energy Information Administration, Annual Energy Outlook 2021. (Washington, DC, 2021).
- R. H. Wiser, et al., Halfway to Zero: Progress towards a Carbon-Free Power Sector, 2021 Search PubMed.
- M. Waite, et al., Global trends in urban electricity demands for cooling and heating, Energy, 2017, 127, 786–802, DOI:10.1016/j.energy.2017.03.095.
- IEA, 2019 Global status report for buildings and construction, United Nations Environment Programme, 2019.
- L. Pérez-Lombard, J. Ortiz and C. Pout, A review on buildings energy consumption information, Energy Build., 2008, 40, 394–398, DOI:10.1016/j.enbuild.2007.03.007.
- C. Harris, et al. Scout: An Impact Analysis Tool for Building Energy-Efficiency Technologies. 2016 ACEEE Summer Study on Energy Efficiency in Buildings, 2016, 4-1.
- J. Langevin, C. B. Harris and J. L. Reyna, Assessing the Potential to Reduce U.S. Building CO2 Emissions 80% by 2050, Joule, 2019, 3, 2403–2424, DOI:10.1016/j.joule.2019.07.013.
- U.S. Energy Information Administration, The Electricity Market Module of the National Energy Modeling System: Model Documentation 2020, (U.S. Department of Energy, Washington, D.C., 2020).
- F. Lambert, Electrek, 2017.
- O. J. Guerra, et al., The value of seasonal energy storage technologies for the integration of wind and solar power, Energy Environ. Sci., 2020, 13, 1909–1922, 10.1039/D0EE00771D.
- O. Schmidt, S. Melchior, A. Hawkes and I. Staffell, Projecting the Future Levelized Cost of Electricity Storage Technologies, Joule, 2019, 3, 81–100, DOI:10.1016/j.joule.2018.12.008.
- M. S. Ziegler, et al., Storage Requirements and Costs of Shaping Renewable Energy Toward Grid Decarbonization, Joule, 2019, 3, 2134–2153, DOI:10.1016/j.joule.2019.06.012.
- J. Aldersey-Williams and T. Rubert, Levelised cost of energy – A theoretical justification and critical assessment, Energy Policy, 2019, 124, 169–179, DOI:10.1016/j.enpol.2018.10.004.
- I. Dincer and M. A. Rosen, in Exergy Analysis of Heating, Refrigerating and Air Conditioning, ed. I. Dincer and M. A. Rosen, Elsevier, 2015, pp. 131–168 Search PubMed.
- A. Hepbasli in Comprehensive Energy Systems, ed. I. Dincer, Elsevier, 2018, pp. 98–124 Search PubMed.
- P. Gauche, et al., US DOE Gen3 and SunShot 2030 Concentrating Solar Power R&D: In search of $0.05 per kW per h autonomy and seasonal storage, Sandia National Lab.(SNL-NM), Albuquerque, NM (United States), 2019 Search PubMed.
- L. J. Vimmerstedt, et al., Annual Technology Baseline, National Renewable Energy Lab.(NREL), Golden, CO United States, 2019.
- C. E. Dorgan and J. S. Elleson, ASHRAE Design Guide for Cool Thermal Storage (RP-592), ASHRAE Trans., 1994, 100, 33–38 Search PubMed.
- N. DeForest, et al., Optimal deployment of thermal energy storage under diverse economic and climate conditions, Appl. Energy, 2014, 119, 488–496, DOI:10.1016/j.apenergy.2014.01.047.
- U.S. Department of Energy Building Technologies Office R&D Targets for Next-Generation Thermal Storage Materials, https://www.energy.gov/eere/buildings/thermal-energy-storage.
- W. Miller, S. Shrestha, K. Childs and E. Stannard, Field Study and Energy-Plus Benchmarks for Energy Saver Homes having Different Envelope Designs.
- D. Castelvecchi, Electric cars and batteries: how will the world produce enough? https://www.nature.com/articles/d41586-021-02222-1?error=cookies_not_supported&code=f2a4b2c0-75ae-49ea-a95e-bf892774768e, 2021.
- Y. Chen, et al., A review of lithium-ion battery safety concerns: The issues, strategies, and testing standards, J. Energy Chem., 2021, 59, 83–99, DOI:10.1016/j.jechem.2020.10.017.
- U.S. Department of Energy, Energy Storage Grand Challenge Roadmap, 2020.
- J. A. de Chalendar, P. W. Glynn and S. M. Benson, City-scale decarbonization experiments with integrated energy systems, Energy Environ. Sci., 2019, 12, 1695–1707, 10.1039/C8EE03706J.
- J. Woods, et al., Rate capability and Ragone plots for phase change thermal energy storage, Nat. Energy, 2021, 6, 295–302, DOI:10.1038/s41560-021-00778-w.
- L. Trahey, et al., Energy storage emerging: A perspective from the Joint Center for Energy Storage Research, Proc. Natl. Acad. Sci. U. S. A., 2020, 117, 12550–12557, DOI:10.1073/pnas.1821672117.
- A. Jain, et al., Commentary: The Materials Project: A materials genome approach to accelerating materials innovation, APL Mater., 2013, 1, 011002, DOI:10.1063/1.4812323.
- S. Kiyabu, J. S. Lowe, A. Ahmed and D. J. Siegel, Computational Screening of Hydration Reactions for Thermal Energy Storage: New Materials and Design Rules, Chem. Mater., 2018, 30, 2006–2017, DOI:10.1021/acs.chemmater.7b05230.
- D. Lilley, A. Jain and R. Prasher, A simple model for the entropy of melting of monatomic liquids, Appl. Phys. Lett., 2021, 118, 083902, DOI:10.1063/5.0041604.
- B. P. Koirala, E. van Oost and H. van der Windt, Community energy storage: A responsible innovation towards a sustainable energy system?, Appl. Energy, 2018, 231, 570–585, DOI:10.1016/j.apenergy.2018.09.163.
- D. Parra, et al., An interdisciplinary review of energy storage for communities: Challenges and perspectives, Renewable Sustainable Energy Rev., 2017, 79, 730–749, DOI:10.1016/j.rser.2017.05.003.
- Commercial buildings energy consumption survey (CBECS). US Department of Energy: Washington, DC, USA, 2015.
- A. Goyal, E. Kozubal, J. Woods, M. Nofal and S. Al-Hallaj, Design and performance evaluation of a dual-circuit thermal energy storage module for air conditioners, Appl. Energy, 2021, 292, 116843, DOI:10.1016/j.apenergy.2021.116843.
- Z. Ding, W. Wu and M. Leung, Advanced/hybrid thermal energy storage technology: material, cycle, system and perspective, Renewable Sustainable Energy Rev., 2021, 145, 111088, DOI:10.1016/j.rser.2021.111088.
- J. Burch, J. Woods, E. Kozubal and A. Boranian, Zero Energy Communities with Central Solar Plants using Liquid Desiccants and Local Storage, Energy Procedia, 2012, 30, 55–64, DOI:10.1016/j.egypro.2012.11.008.
- W. Kessling, E. Laevemann and M. Peltzer, Energy storage in open cycle liquid desiccant cooling systems, Int. J. Refrig., 1998, 21, 150–156, DOI:10.1016/S0140-7007(97)00045-5.
- S. Mumme, S. Shrestha, N. James, D. Hun and M. Salonvaara, Smart and Efficient Building Envelopes: Thermal Switches and Thermal Storage for Energy Savings and Load Flexibility, ASHRAE Trans., 2020, 126(2), 140–148 Search PubMed.
- S. Mumme and N. James, 14th Advanced Building Skins Conference and Expo.
- G. Wehmeyer, T. Yabuki, C. Monachon, J. Wu and C. Dames, Thermal diodes, regulators, and switches: Physical mechanisms and potential applications, Appl. Phys. Rev., 2017, 4, 041304, DOI:10.1063/1.5001072.
- R. A. Kishore, M. V. A. Bianchi, C. Booten, J. Vidal and R. Jackson, Enhancing building energy performance by effectively using phase change material and dynamic insulation in walls, Appl. Energy, 2021, 283, 116306, DOI:10.1016/j.apenergy.2020.116306.
- D. Lilley, J. Lau, C. Dames, S. Kaur and R. Prasher, Impact of size and thermal gradient on supercooling of phase change materials for thermal energy storage, Appl. Energy, 2021, 290, 116635, DOI:10.1016/j.apenergy.2021.116635.
- G. E. Kelly and J. E. Hill, Method of testing for rating thermal storage devices based on thermal performance, NASA STI/Recon Technical Report N, 1975, 75, 33359 Search PubMed.
- American Society of Mechanical Engineers (ASME) Codes and Standards, Thermal Energy Storage, https://www.asme.org/codes-standards/about-standards/the-future-of-asme-standards/energy-storage.
- D. Auston, et al., Assessing the Need for High Impact Technology Research, Development & Deployment for Mitigating Climate Change, Collabra, 2016, 2(1) DOI:10.1525/collabra.64.
- C. Domonoske, To Fight Climate Change, New York City Will Push Skyscrapers To Slash Emissions, https://www.npr.org/2019/04/23/716284808/new-york-city-lawmakers-pass-landmark-climate-measure, 2019.
- K. Spees and D. L. Oates, Locational Marginal Emissions: A Force Multiplier for the Carbon Impact of Clean Energy Programs, The Brattle Group, 2019.
Footnote |
| † Electronic supplementary information (ESI) available. See DOI: 10.1039/d1ee01992a |
| This journal is © The Royal Society of Chemistry 2021 |