Electrochemical detection of heavy metal ions in water
Qi
Ding
ab,
Chen
Li
a,
Haijun
Wang
*a,
Chuanlai
Xu
 ab and
Hua
Kuang
 *ab
*ab
aThe Key Laboratory of Food Colloids and Biotechnology, Ministry of Education, School of Chemical and Material Engineering, Jiangnan University, Wuxi 214122, China. E-mail: wanghj329@outlook.com; kuangh@jiangnan.edu.cn
bInternational Joint Research Laboratory for Biointerface and Biodetection, State Key Lab of Food Science & Technology, and School of Food Science and Technology, Jiangnan University, Wuxi 214122, China
First published on 9th June 2021
Abstract
Heavy metal ions are one of the main sources of water pollution. Most heavy metal ions are carcinogens that pose a threat to both ecological balance and human health. With the increasing demand for heavy metal detection, electrochemical detection is favorable due to its high sensitivity and efficiency. Here, after discussing the pollution sources and toxicities of Hg(II), Cd(II), As(III), Pb(II), UO2(II), Tl(I), Cr(VI), Ag(I), and Cu(II), we review a variety of recent electrochemical methods for detecting heavy metal ions. Compared with traditional methods, electrochemical methods are portable, fast, and cost-effective, and they can be adapted to various on-site inspection sites. Our review shows that the electrochemical detection of heavy metal ions is a very promising strategy that has attracted widespread attention and can be applied in agriculture, life science, clinical diagnosis, and analysis.
1. Introduction
With the advancement of industry, global environmental pollution has become more severe.1–3 Heavy metal ions are one type of the most significant contaminants in water pollution and they have affected various parts of the environment, such as terrestrial and aquatic communities.4 The main source of these heavy metal ions is cosmetics and their by-products. In addition, the widespread use of chemical fertilizers has caused serious heavy metal ion pollution. Another source is the chemical substances produced by industrial or household waste. Heavy metal ions are distributed ubiquitously and cannot be degraded. As such, they threaten both human health and the environment.5 These ions are emitted from factories, accumulate in the biosphere, and enter organisms by the alimentary chain. Heavy metal ions like mercury, cadmium, arsenic, and lead are a risk to human health even in low concentrations because the metal ions react with the thiol group of proteins and then enter the cells to change the biochemical lifecycle. Moreover, high concentrations of silver and copper have toxic effects as well.6–8These heavy metal ions are extremely dangerous pollutants, ranking in the top ten on the “Priority List of Hazardous Substances of Toxic Substances and Disease Registry”.9–11 Major international organizations such as the World Health Organization, US Environmental Protection Agency, Centers for Disease Control, and the European Union have listed heavy metals as priority substances and established a series of allowable concentration limits.12 The Joint Food and Agricultural Organization/World Health Organization Expert Committee on Food Additives and the International Agency for Research on Cancer continue to evaluate the toxicity of heavy metal ions.13–15
In view of the hazards of heavy metal ions towards the environment and the human body, accurate and efficient detection technology is particularly important. Many methods have been developed for the detection of heavy metal ions, such as atomic absorption spectroscopy,16,17 inductively coupled plasma mass spectroscopy,18–22 neutron activation analysis,23,24 X-ray fluorescence spectrometry,25–30 and inductively coupled plasma–optical emission spectrometry.21,31–34 These technologies offer excellent detection limits and can simultaneously measure multiple metal ions. However, spectroscopic techniques are expensive. Only trained personnel can operate the instruments needed for these techniques, which entail complex sample pretreatment and analysis procedures. Although optical techniques can accurately detect heavy metal ions, costly equipment and complicated operations are indispensable. Moreover, these techniques are unsuitable for on-site detection.35,36 Therefore, efficient, low cost, simple, and accurate detection technology is a critical direction for the in situ detection of metal ions.37
Electrochemical detection can be employed to overcome the limitations of other methods. Electrochemical techniques are user-friendly, inexpensive, and reliable. Furthermore, electrochemical detection can be deployed in the field offering portability and rapid responses for the in situ analysis of polluted samples. Modifying electrochemical sensors with specific substances can significantly improve their performance. For example, loading precious metal nanoparticles can accelerate the electron transfer rate between the analyte and the electrode. Semiconductor nanomaterials are able to promote the efficiency of photochemical reactions and improve the detection performance of heavy metal ions.38–40 The sensitivity and detection limit of electrochemical methods can be enhanced by using different electrochemical sensors coupled with various electrochemical techniques.41–43 Here, we review the latest developments in electrochemical techniques for the detection of heavy metal ions such as Hg(II), Cd(II), As(III), Pb(II), Ag(I), and Cu(II) in water samples, as well as current developments in various interface materials that modify the electrodes used by these techniques.44–46
2. The basic mechanism of electrochemical sensors to detect heavy metal ions
The basic mechanism of electrochemical sensors is output transducer signals and identification of the potential difference by using a potentiostat. A conducting wire is used to collect the sensing signal of the electrochemical sensor, which allows the building up these sensors into a compact system.47 Besides, the defined redox potential of heavy metal ions allows bare electrode sensing, thereby eliminating the requirement for the molecular recognition probes used in optical sensors. The main techniques applied in electrochemical detection include voltammetry, impedimentary, potentiometry, conductometry and amperometry, in which voltammetry includes cyclic voltammetry, differential pulse voltammetry (DPV), anodic stripping voltammetry (ASV) and linear sweep voltammetry (LSV).48,49 The time waveform generated by the respective functional applications is the significant difference between these technologies. There are two main steps in ASV detection: the first one is the pre-concentration, which involves the electro-reduction (deposition) of the metal ion species in the solution to the corresponding zero-valent metal on the surface of the working electrode under a constant potential. In the second step, the zero-valent metal is re-oxidized to the corresponding cations by applying a voltage sweep in the anode direction, so that the analyte deposited on the electrode surface is stripped (dissolved) at a specific potential.50 This method can realize the specific detection of different metal ions, based on the specific oxidation potential of each metal.83. Toxicity and electrochemical detection of different heavy metal ions
3.1 Mercury (Hg)
Electrochemical detection has excellent potential in detecting mercury ions due to its high sensitivity and convenience. Mariyappan et al. integrated Sr-doped FeNi-S nanoparticles with single-walled carbon nanotubes (Sr@FeNi-S/SWCNTs) using a common ultrasonication method.76 Sr-Doped FeNi-S nanoparticles were synthesized by a single step pyrolysis process (Fig. 1). The bimetallic FeNi-based sulfide with unique structure and morphology is a potential electrode catalyst due to its excellent active site distribution and sensitivity. In addition, doping Sr as an alkaline earth element into the bimetallic FeNi-S can further improve its conductivity and greatly enhance its electrochemical performance. However, Sr@FeNi-S nanoparticles have the disadvantages of fewer active sites and poor cycle life. Therefore, they doped the nanoparticles with SWCNT. On the one hand, it provides a large number of active sites, which accelerate the redox reaction of FeNi-S; on the other hand, it provides excellent stability to improve the cycle life. The data on the Sr@FeNi S/SWCNT electrode electrochemical impedance demonstrate favorable kinetic charges for the transport and are better than the data from single Sr@FeNi-S and SWCNT electrodes for detecting trace amounts of Hg(II). Using Sr@FeNi-S/SWCNTs to modify a glassy carbon electrode, Mariyappan et al. investigated the mechanism and electrochemical behavior using cyclic voltammetry. Based on differential pulse voltammetry in a wide linear range (WLR: 0.05–279 μM), ultralow levels of Hg can be measured sensitively and accurately. The detection limit was as low as 0.52 nM. There are many advantages to their method, and it showed excellent repeatability, reproducibility, and stability. The authors tested the method in lake and river water to demonstrate its ability to detect added Hg(II).
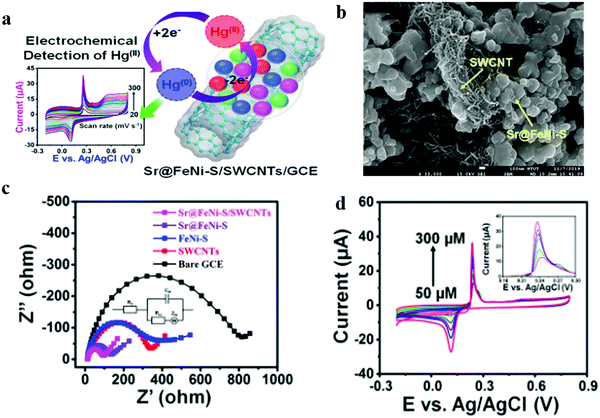 | ||
| Fig. 1 (a) The electrochemical behavior of Sr@FeNi-S/SWCNTs. (b) FE-SEM images of Sr@FeNi-S/SWCNTs. (c) Nyquist plots of the bare GCE and different catalyst modified GCEs (inset: equivalent circuit). (d) CV profiles of Sr@FeNi-S/SWCNTs/GCE at various concentrations of Hg(II). Adapted with permission from ref. 76. Copyright©2020 American Chemical Society. | ||
Unlike common electrochemical detection methods, the specific binding of DNA and heavy metal ions achieves sensitive detection of trace Hg(II). As shown in Fig. 2, Wen et al. designed a T–Hg(II)–T pairing mercury Hg(II) sensing platform using a single-channel recording technique.77 They chose appropriate ssDNA to generate a stable hairpin structure in the duplex formation mediated by Hg(II), which significantly changed the ssDNA translocation profile through an αHL nanopore. The quantitative analysis of Hg(II) can be achieved by analyzing the current blocking and residence time. Events with a blocking rate greater than 70% are selected as the “Hg(II) signal area”. At lower concentrations, the asymmetric electrolyte gradient can greatly increase the rate of trapping ions without decreasing the translocation time, thereby effectively improving the sensitivity. The sensor can detect Hg(II) higher than 7 nM within 30 minutes. The sensor can accurately detect Hg(II) without interference from other metal ions and can be easily made from existing materials without the need for synthesis, probe production, purification and other processes. Therefore, their method illustrates the potential for identifying various types of analytes that have specific interactions with DNA molecules.
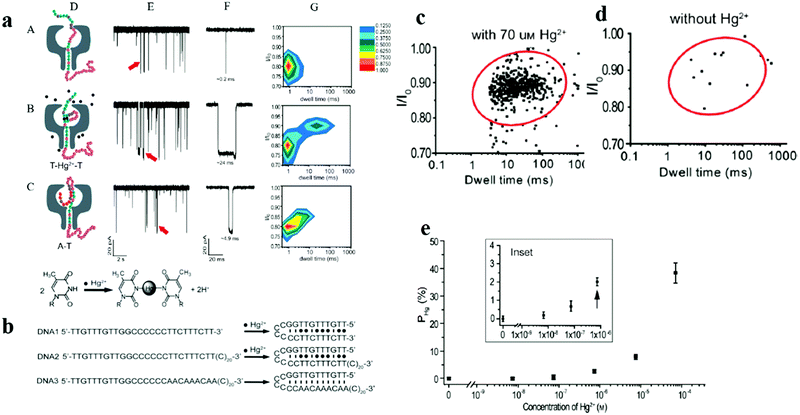 | ||
| Fig. 2 (a) Representation of the translocation of ssDNA (DNA2), T–Hg(II)–T containing DNA2–Hg(II), and natural DNA hairpin (DNA3) using a single αHL nanopore. (D) Schematic illustration of DNA2, Hg(II)–DNA2, and DNA3 passing through αHL.18 (E) Representative single-channel current traces of the translocation of DNA2, Hg(II)–DNA2, and DNA3. (F) An expanded view of the events indicated in the current trace by a red arrows. (G) The corresponding 2D event distribution plots associated with DNA2, Hg(II)–DNA2, and DNA3 translocation through the pore. (b) Illustration of the “Hg(II) signal region” specified by an oval with 95% confidence level. Note that data with a current blockage smaller than 70% and a duration shorter than 3 ms were truncated. (c) The generation of the Hg(II) signal oval in the control group. (d) A plot of PHgversus Hg(II) concentration (number of individual experiments n = 6). The control group value has been offset to zero. The existence of Hg(II) can be confirmed at ∼0.7 μM or higher. (e) A histogram representation of DNA2 translocation in the presence of 7 μM Hg(II) or interfering metal ions Pb(II), Cd(II), and Cr(III). Adapted with permission from ref. 77. Copyright©2011 American Chemical Society. | ||
3.2 Cadmium (Cd)
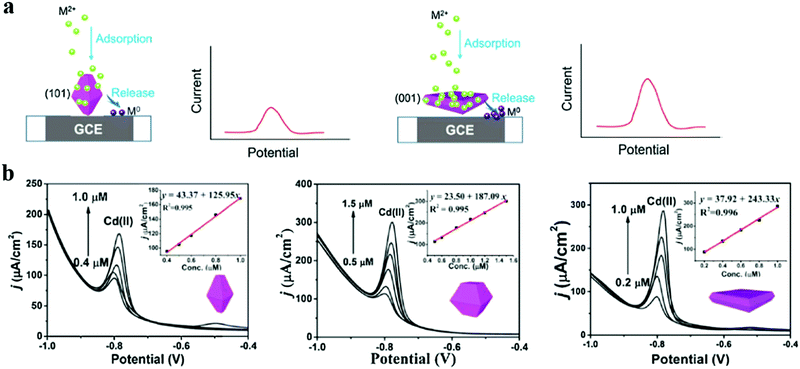 | ||
| Fig. 3 (a) Schematic diagrams illuminate how the adsorption–release process affects the heavy metal ion sensing at TiO2(001) and (101) facets. (b) Square Wave Stripping Voltammetry (SWASV) responses of HF0, HF1.5, and HF3 (different volumes of hydrofluoric acid treated TiO2 correspond to 0 mL, 1.5 mL, and 3 mL) modified GCE in the presence of Pb(II) and Cd(II) ions. The insets show the corresponding calibration curves. Adapted with permission from ref. 84. Copyright©2018 Elsevier. | ||
Paper-based potentiometric and voltametric devices are highly portable and can be used to determine heavy metal ions with high-cost performance.89 Ding's group discussed the interaction between paper-based sensors and heavy metals, as well as the impact on the sensor response, and modification methods to improve the performance of paper-based electrochemical sensors.87 They demonstrated the possibility of using paper-based sensors in liquid samples containing solid impurities, and successfully improved the accuracy and sensitivity of the device by modifying the paper substrate. Paper is suitable for real sample testing. Samples containing solids are adsorbed and passed through a pore filtration system to effectively separate liquids from solids.88 Using different models, the method can detect trace amounts of various heavy metal ions. Bi et al. developed a time and cost-effective method for the rapid determination of cadmium(II) in rice using electrochemical detection in paper-based analytical devices (PADs). Double-sided conductive carbon tape coated with a thin layer of gold is used as a disposable electrochemical sensor for the exfoliation analysis of Cd(II) combined with the in situ electrodeposition of bismuth. With just 10 seconds of gold sputtering time, the maximum electrochemical response of Cd(II) can be obtained, indicating that the retained nanostructure of the carbon tape can facilitate the peeling analysis based on differential pulse voltammetry. Its detection limit can reach 0.1 μg L−1, and it has been successfully applied in the detection of Cd(II) in rice samples.90 Paper-based sensors have extremely broad application prospects in the field of heavy metal ion detection.
The synthesized functional organic modified electrode can detect a variety of heavy metal ions sensitively. Sultan's group constructed a multifunctional calixarene-modified glassy carbon electrode, which simultaneously achieved the sensitive detection of Cd(II), Pb(II) and Hg(II) by anodic stripping voltammetry (Fig. 4).91 The bis-imidazole phenanthroline appended bis-triazolo calixarene (8), abbreviated as compound (8). The imidazole and bis-triazolo calix in compound (8) have a strong specific binding ability to Cd(II), Pb(II), and Hg(II), can effectively capture target ions to form complexes and provide abundant activity sites, thus enhancing the sensitivity of the electrode. Therefore, the detection limits of Cd(II), Pb(II) and Hg(II) can reach 0.037, 0.015 and 0.025 nM, respectively. In addition, in the presence of common competitive metal ions, the modified electrode showed excellent repeatability, reproducibility, and selectivity for Cd(II), Pb(II), and Hg(II). Their research was extended to actual water samples, and the results illustrated that compound (8)/GCE is an extremely sensitive, cheap, and portable electrochemical platform for detecting multiple heavy metal ions in drinking water reservoirs and seawater.
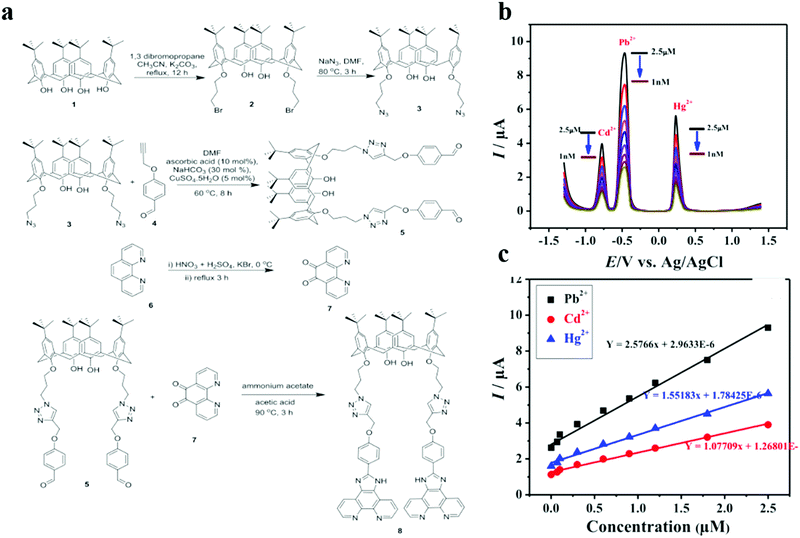 | ||
| Fig. 4 (a) Synthesis of fluorescent bis(imidazole phenanthroline) based molecular tweezers. (b) SWASV responses at compound 8/GCE for the simultaneous determination of Hg(II), Cd(II) and Pb(II) with different concentrations. (c) Calibration curves obtained for the simultaneous analysis of Hg(II), Cd(II) and Pb(II) under optimized conditions. Adapted with permission from ref. 91. Copyright©2019 The Electrochemical Society. | ||
Cui et al. used a metal-organogel (MOG) template to synthesize a nitrogen-doped porous carbon material with a uniform interconnecting structure. Benefiting from its porous structure and the ability of rapid electron transmission, the N@MOG-C sensor can detect Cd(II) efficiently and sensitively (LOD = 2.2 nM).88 Furthermore, they also designed a bismuth-nanoparticle nanoporous carbon on graphene nanocomposite to achieve an excellent LOD of 4.1 nM for Cd(II).86
3.3 Arsenic (As)
Arsenic can cause great damage to the human body. It directly damages the walls of small arteries and capillaries in the human body and interferes with the vasomotor center. In addition, excessive amounts of arsenic can interfere with the normal metabolism of cells, affect respiration and oxidation processes, and cause cell damage. Arsenic can enter the human body through skin contact or wounds. Long-term exposure to arsenic can induce cancer, including skin cancer, lung cancer, urinary tract cancer, and liver cancer.95 Similarly, excessive amounts of arsenic in drinking water will greatly increase the incidence of cancer. Due to the threat of arsenic, both the World Health Organization and United States Environmental Protection Agency have set the maximum pollution level of arsenic in water to 10 ppb.96 However, there are still many areas where the concentration of arsenic exceeds this standard, so it is vital to monitor the arsenic content in drinking water and food. Here, we introduce several emerging electrochemical detection methods.
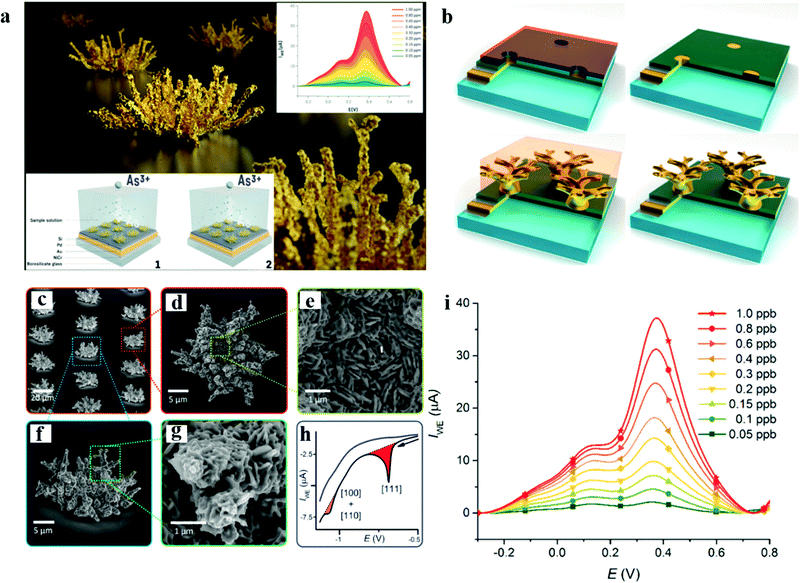 | ||
| Fig. 5 (a) Schematic diagram of the morphology of the nanostructured gold microelectrode array and the detection of As(III). (b) The synthetic schematic diagram of the NiCr/Au/Pd/Si sandwich structure on a glass wafer. (c) An overview of the nanostructured clusters array showing shape variability. (d) A detailed top view of a single nanostructured Au cluster showing a flat central part and branching outer region. (e) The detail of the cluster central part with the tabular crystals structure. (f) A side overview of the nanostructured Au cluster showing that the peripheral structure part is not in contact with the substrate and growing upward. (g) The detail of the branch with individual Au leaf-like structures resembling an Araucaria araucana leaves arrangement. (h) Reductive desorption of cysteine. The desorption of cysteine (black curve). The peak area (red) corresponding to Au with a domain is larger than one of the peak areas (orange) and corresponds to Au with the domain (blue). The color curve represents the third cycle. The blue curve represents the third cycle. (i) Determination of LOD for the nanostructured gold microelectrode array by a standard addition and calibration curve for the same. Adapted with permission from ref. 97. Copyright©2017 American Chemical Society. | ||
The combination of microorganisms and sensors can greatly improve the sensitivity of electrochemical detection and has recently become one of the most popular methods for detecting heavy metal ions. Sciuto et al. developed a novel, portable electrochemical biosensing platform to specifically analyze the metal ions in water samples with high sensitivity (Fig. 6).92 The sensor system utilizes the synergy between two interface sensing modules: one is a module based on the entire unit, using engineered E. coli as a full-cell sensing element; the other one is an electrochemical module based on a silicon chip, which integrates an electrochemical cell (EC-CELL) composed of three flat microelectrodes and a portable EC reader performs cyclic voltammetry (CV) analysis. The genetically modified full-legacy sensor element produces redox active 4-aminophenol, which acts as a mediator and interacts with the metal target in a highly proportional manner each time. Due to the electrochemical detection of the mediator, metals are detected and quantified indirectly. The sensor can specifically recognize As(III) and Hg(II) by cyclic voltammetry due to the selective binding of engineered E. coli to specific metals. The miniature biosensor is capable of portable and highly sensitive detection with a sensitivity of 0.122 μA ppb−1 to As(III). The LOD and LOQ are 1.5 and 5 ppb, respectively. The electrochemical biosensing platform fully meets the requirements of the World Trade Organization for arsenic detection.
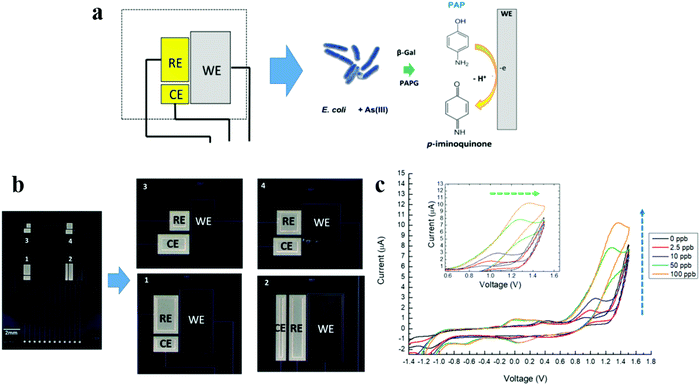 | ||
| Fig. 6 (a) Details of the EC cell used for the sensing and principle of the biochemical method based on whole-cell sensing using the engineered E. coli as the sensing element. CE, counter electrode; EC, electrochemical; RE, reference electrode; and WE, working electrode. (b) Miniaturized electrochemical silicon chip integrating four layouts of EC cells with three planar microelectrodes made in Pt (WE) and Au (CE and RE). (c) CV curves of an arsenic-sensitive E. coli strain in the presence of As(III) at 0 (black line), 2.5 ppb (red line), 10 ppb (blue line), 50 ppb (green line), and 100 ppb (orange line) and the relative current increase (blue dashed arrow). Inset: Details of the PAP peak voltage shift (green dashed arrow). Adapted with permission from ref. 92. Copyright©2020 Wiley Periodicals LLC. | ||
Cui et al. produced an aptasensor for highly sensitive and selective electrochemical detection, which has label-free As(III) binding that can be self-assembled on a screen-printed carbon electrode (SPCE) through Au–S bonds. DNA aptamer (Ars-3) can adsorb cationic polymer dimethyl ammonium (PDDA) through electrostatic interaction to repel other cationic species. In the presence of As(III), there is less adsorption of PDDA due to the formation of the Ars/arsenate complex, and more positive charges can be absorbed by the complex. The electrochemical active indicator on the surface of the aptasensor produces a sensitive “turn-on” response. The target-induced structure switching can be used for the sensitive detection of As(III), and the detection limit is down to 0.15 nM.93
3.4 Lead (Pb)
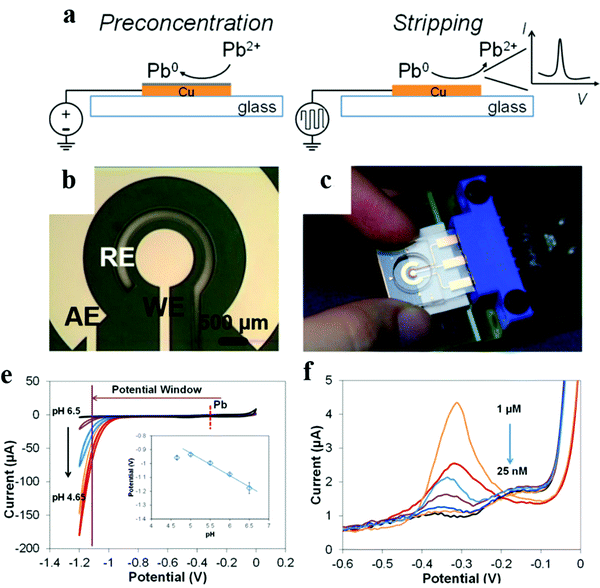 | ||
| Fig. 7 Schematics of the experiment theory and electrode configuration. (a) Illustration of ASV of Pb on a Cu working electrode. (b) Close-up of the electrochemical cell, working electrode (WE), auxiliary electrode (AE), and reference electrode (RE). (c) A photograph of the sensor with an interface connected to a potentiostat. Characterization of the Cu electrode for Pb determination using CV. (d) Voltammograms in acetate buffer (0.2 M) with different pH values to demonstrate potential windows; the inset demonstrates the relationship between the Pb stripping peak potential and variation in the buffer pH. (e) Calibration of Pb using Anodic Stripping Voltammetry in the range of 25 nM to 1 μM. Adapted with permission from ref. 106. Copyright©2017 American Chemical Society. | ||
Biosensors remain suitable for the electrochemical detection of Pb(II). In 2017, Li et al. designed a Fe/Mg/Ni-ternary lactate dehydrogenase composite sensor for the selective and sensitive detection of Pb(II) (Fig. 8).63 Lactate dehydrogenase is a potential heavy metal adsorbent. The modified sensor contains large amounts of Fe(II) and Mg(II), which have a strong affinity with Pb(II) and can effectively capture Pb(II) to form Fe–O–Pb and Mg–O–Pb. In addition, the presence of Ni as a catalyst can effectively enhance the ability to capture Pb(II). Based on this mechanism, the Fe/Mg/Ni-ternary lactate dehydrogenase sensor can enrich Pb(II), thereby significantly improving the selectivity and sensitivity to Pb(II). The sensitivity can reach 68.1 μA μM−1. It is worth mentioning that the formation of molybdenum lead oxide contributes to the high adsorption capacity of iron/magnesium/nickel-lactate dehydrogenase for Pb(II) based on the XPS data of the material. Their discovery successfully combines the adsorption of nanomaterials with the electrochemical detection of heavy metal ions. This is of great significance for the detection of heavy metal ions with high sensitivity and selectivity through stratification.
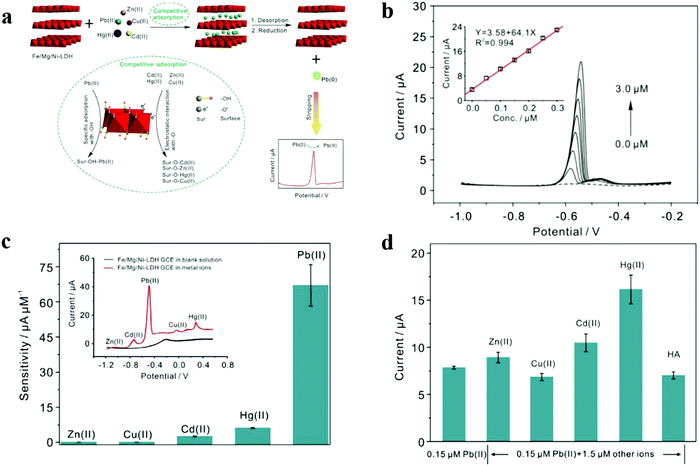 | ||
| Fig. 8 (a) Schematic of the competitive adsorption and selective detection of Pb(II). (b) The SWASV responses of Pb(II) in real samples. The inset is the corresponding linear calibration plot. (c) Selectivity studies of the Fe/Mg/Ni-LDH modified electrode toward five heavy metal ions (Zn(II), Cu(II), Cd(II), Hg(II), and Pb(II)). Inset is the selectivity study of electrochemical signals of Fe/Mg/Ni-LDH GCE in blank solution and in 0.5 M five blended heavy metal ions, respectively. (d) Interference measurement of the Fe/Mg/Ni-LDH GCE is operated in a solution containing 0.15 M Pb(II) by the addition of 1.5 M Zn(II), Cu(II), Cd(II), Hg(II) and HA, respectively. Adapted with permission from ref. 63. Copyright© 2017 Elsevier. | ||
Li et al. synthesized a NOx organic hybrid WOX–ethylenediamine (WOX–EDA) nanowire with a high area-to-volume ratio and abundant amino groups for the selective and sensitive electrochemical determination of Pb(II).107 Due to the chelation between the amino group and Pb(II), the modified electrode shows a selective response to Pb(II) and can directly detect Pb(II) at 0.01–10 μM, with a limit of detection down to 3.2 nM by the ASV method.
Zang et al. designed a reduced graphene oxide (RGO)/Cds/aptamer platform for Pb(II) trace detection by using electrochemical impedance spectroscopy.108 Based on the Pb(II)-induced conformational transition, the amplification effect of RGO and resonance energy transfer between Cds quantum dots (QDs) and gold nanoparticles (AuNPs), they designed a “signal-on” photoelectrochemical sensor that selectively measures Pb(II). In the absence of Pb(II), AuNP-labeled DNA serves as the signal quenching element, which can be introduced by hybridizing with an aptamer on the surface of the sensing platform to quench the photocurrent of quantum dots using an energy transfer process. In the presence of Pb(II), the aptamer is induced into a G-quadruplex structure. Due to competition to occupy the binding site and space effects, the hybridization between the aptamer and AuNP-labeled DNA can be greatly hindered, resulting in the recovery of the photocurrent. This clever structure can accurately reach a detection range of 0.1–50 nM, with a detection limit of 0.05 nM. In addition, using the DNA functionalized iron porphyrin metal organic framework (GR-5/(Fe–P)n-MOF) as the probe, Cui's team developed a high-efficiency electrochemical lead ion detection sensor.109 GR-5 can specifically recognize Pb(II), and then using the simulated peroxidase properties of (Fe–P)n-MOF, it amplifies the electrochemical signal and achieves a satisfactory LOD of 0.0034 nM.
3.5 Uranium (U)
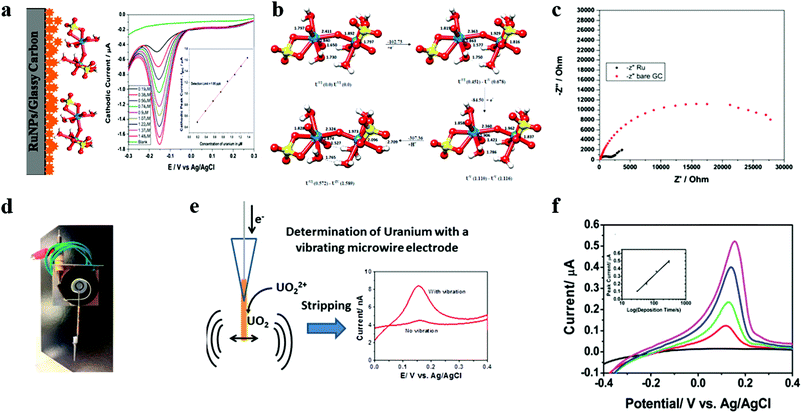 | ||
| Fig. 9 (a) Schematic diagram of the ruthenium nanoparticle modified glassy carbon electrode for detecting UO2(II) and differential pulse voltammetry curve as a function of the U(VI) concentration. (b) The disproportionation mechanism of uranyl sulfate proposed using electronic structure calculations. Values in brackets are the spin populations on uranium centers in different species. Adapted with permission from ref. 113. Copyright©2017 American Chemical Society. (c) Nyquist plots obtained from the impedance measurement for the Ru NPs/glassy carbon electrode and bare glassy carbon electrode. (d) A photograph of the vibrating microwire electrode. (e) A schematic diagram of the electrochemical determination of the uranium ion with a vibrating gold microelectrode. (f) ASV using a fixed deposition potential of −1.2 V and the different deposition times of 0 s (black), 30 s (red), 60 s (green), 120 s (blue), and 300 s (magenta). Adapted with permission from ref. 115. Copyright©2014 American Chemical Society. | ||
In addition, Peled et al. used vibrating gold microelectrodes to achieve a lower detection limit (1 ppb) using an ASV method (Fig. 9d–f).115 Their work is divided into two parts. First, they use a bare disk gold large electrode to exchange two electrons through the ASV method to reduce to insoluble UO2 deposition. However, the detection limit is not satisfactory, only reaching 10 ppm. Subsequently, they improved this method by vibrating the microwire working electrode (vibrating frequency of 250 Hz and amplitude of 6 V). Vibration effectively avoids the precipitation of hydrogen deposited by uranyl, reduces the diffusion layer, and increases the amount of UO2 deposited, which greatly improves the detection limit level to 1 ppb. They also deeply studied the operation of frequency, amplitude and waveform and their influence on the analysis performance. There is no doubt that their work has an important reference value for the improvement of later detection methods.
3.6 Thallium (Tl)
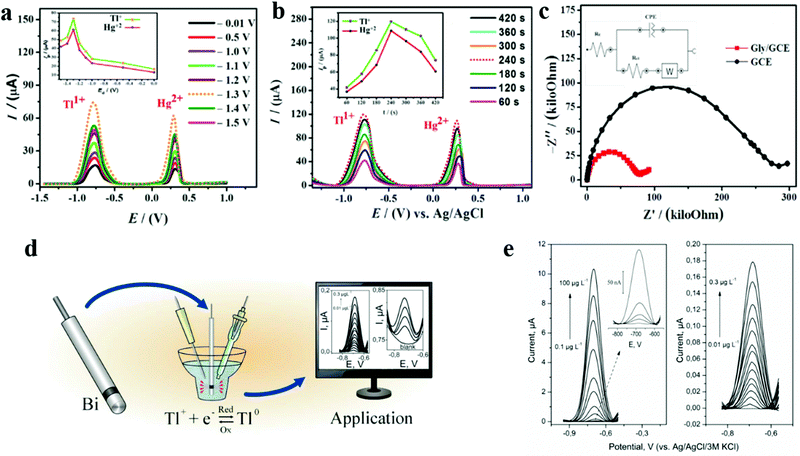 | ||
| Fig. 10 (a) SWASVs at a scan rate of 100 mV s−1 showing the influence of accumulation potential on the stripping currents of Tl(I) and Hg(II) electrodeposited over the GCE surface from a 0.1 mM solution of these analytes at various deposition potentials maintained for 120 s; (inset) plot between Ipvs. Ed. (b) SWASVs showing the influence of the accumulation time on the peak current response of the analytes keeping an accumulation potential of −1.3 V; (inset) plot between Ipvs. td. (c) Nyquist plots using electrochemical impedance spectroscopic data with an applied frequency range varying from 100 kHz to 0.01 kHz; (inset) equivalent circuit model for the system under study. Adapted with permission from ref. 118. Copyright©2019 Elsevier. (d) A schematic diagram of the detection mechanism of the bismuth ring belt electrode in the determination of trace thallium using stripping voltammetry. (e) Differential pulse anodic stripping voltammetry voltammograms obtained at the bismuth bulk annular band working electrode after background correction in a nondeuterated supporting electrolyte containing increasing amounts of Tl(I) for the following accumulation times: t = 60 s (left) and 300 s (right). Adapted with permission from ref. 121. Copyright©2016 Elsevier. | ||
As shown in Fig. 10e and f, Węgiel et al. reported the study of a new type of mercury-free bismuth bulk annular band working electrode (BiABE), which is used to detect Tl(I) by differential pulse anodic stripping voltammetry (DP ASV).121 BiABE is easy to prepare and stable, and has a strong chemical response to Tl(I). The ring-shaped ribbon electrode has an internal battery, which simplifies the cleaning and electrochemical activation of the electrode surface. BiABE has excellent sensitivity and stability. The detection limit can reach an astonishing 0.005 nM within a cumulative time of 300 s, and it has successfully achieved the determination of Tl(I) in tap water and river water samples. They optimized a series of conditions, including the influence of pH on the formation of hydroxyl compounds, the influence of differential pressure parameters, the influence of accumulation potential and time, and successfully reduced the influence of interfering ions on detection using EDTA, and finally reached the ideal detection limit.
3.7 Chromium (Cr)
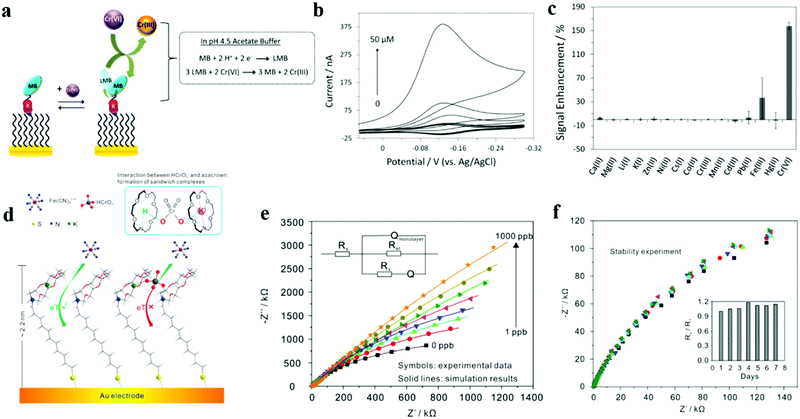 | ||
| Fig. 11 (a) Design and signaling mechanism of the electrochemical ion sensor for the detection of Cr(VI). (b) Dose–response curves for Cr(VI) obtained by analyzing both the MB reduction peak current and the integrated charge in the CV scans. CV scans in the absence and presence of 0.05, 0.1, 0.5, 1, 5, 10, and 50 μM Cr(VI). (c) The signal enhancement recorded in the presence of 50 μM of Ca(II), Mg(II), Li(I), K(I), Zn(II), Ni(II), Cs(I), Co(II), Cr(III), Mn(II), Cd(II), Pb(II), Fe(III), 5 μM Hg(II) and Cr(VI). Adapted with permission from ref. 125. Copyright©2015 Elsevier. (d) The schematic of Cr(VI) detection via an azacrown monolayer self-assembled on an Au electrode. (e) Electrochemical impedance spectra of the azacrown/Au electrode for the determination of Cr(VI) in different concentrations (0, 1, 5, 10, 50, 100, 500, and 1000 ppb). (f) Stability of the azacrown monolayer/Au electrode. EIS diagrams were collected within 1 week in 5 mM Fe(CN)63−/4− and 0.1 M KCl in the absence of Cr(VI) (pH 5.0). The inset shows Rs/R1vs. measurement days. R1 is the first measured impedance and Rs the following impedance measurement. Adapted with permission from ref. 126. Copyright©2015 Elsevier. | ||
Wei et al. developed a new organic matter to detect chromium(VI) as hexachlorocyclohexane using electrochemical impedance spectroscopy in drinking water at pH 5.0 (Fig. 11d–f).126 This strategy is based on the high affinity and specific binding of a crown ether (i.e. aza crown ether) to hydrogen chloride through hydrogen bonding and partial interaction with the potassium ions captured by the aza crown ether on the surface of its self-assembled gold electrode. A sandwich compound is formed between the two hydrogen chlorides (Fig. 11d). This prevents the redox probe (Fe(CN)63−/4−) from entering the self-assembled gold electrode, which further leads to an increase in the electron transfer resistance. The detection limit of this method has reached a surprising 0.0014 ppb. This is the first example of applying electrochemical impedance sensing to Cr(VI), which can achieve ultra-sensitive and ultra-selective detection of Cr(VI), has good stability, and can maintain stable performance during eight consecutive days of measurement. Their work demonstrates the great potential of electrochemical impedance spectroscopy, which can undoubtedly provide important reference for other electrochemical detection work.
3.8 Silver (Ag) and copper (Cu)
In 2018, Lu et al. proposed an electrochemical sensing platform based on graphene quantum dots with restricted nanochannels.9 Due to spatial repulsion and electrostatic repulsion, the vertically arranged mesoporous silica-nanochannel film (VMSF) can detect Cu(II), Hg(II), and Cd(II) with high sensitivity. They found that electrophoresis confines modified graphene quantum dots (GQDs) with different functions to the nanochannels of VMSF. GQDs confined in nanochannels have multiple functions to enhance signals, including selective enhancers through electrostatic repulsion and enrichment, recognition elements through specific interactions with analytes, and charge transfer and transport mediators. As such, it can be used to identify elements and signal amplifiers. The operation of the sensing platform is sensitive, quick, and simple. The detection limit of Cu(II) can reach 8.3 pM, and the detection limit of Hg(II) and Cd(II) can reach 9.8 pM and 4.3 nM, respectively. It can be used with complex foods (seafood contaminated by heavy metal ions), environmental samples (soil extract), and biological serum. In addition, the diameter of the nanochannel can be expanded to 12 nanometers using the two-phase layered growth method to accept larger quantum dots or macromolecules (such as proteins) or macromolecule functionalized quantum dots for the detection of other substances.
Cui et al. used dithiobis[succinimide propionate] coated gold nanoparticles to assemble silver nanoparticles (AgNPs) and developed a high-sensitivity electrochemical sensor regulated by using cysteine (Cys) to detect Cu(II).128 The electrochemical sensor is assembled by carbon nanotubes, polyamide–amine dendrimers and glassy carbon electrodes modified using a digital signal processor. Without Cu(II), Cys can be bonded to the surface of citrate-stabilized silver nanoparticles through silver–sulfur bonds, and silver nanoparticles can be assembled to the sensor surface through the reaction with Cys. In contrast, in the presence of Cu(II), the copper-catalyzed dissolved oxygen oxidation of Cys inhibits the aggregation of silver nanoparticles induced by Cys, resulting in a decrease in the electrochemical peeling signal of silver nanoparticles. The detectable range of the DPV method can reach 1.0–1000 nM, and the detection limit is 0.48 nM. Wang et al. used the formation of analyte-induced exciton trapping to cause a reduction in the photocurrent of the sulfhydryl-terminated cadmium telluride quantum dot cathode, which resulted in a sensitive cathodic photoelectrochemical method for selectively sensing trace amounts of Cu(II) (LOD = 5.9 nM).129
Hao's team develop a high-efficiency photocathode for photoelectrochemical (PEC) biosensing based on graphite-like carbon nitride nanosheet (CNN) sensitized cadmium telluride quantum dots (QDs).130 With dissolved oxygen as the electron acceptor at −0.2 V bias, the composite photocathode exhibits a sensitive photocurrent response under 405 nm light. The introduction of Cu(II) on the surface of hybrid photocathode could decrease photocurrent by the exciton trapping quenching effect. With the support of the modified mechanism, the PEC sensor can reach a detection limit of 3.3 nM. In a previous work, Hao's team used PEC to further develop a wavelength-resolved ratio photoelectrochemical (WR-PEC) technology (Fig. 12).131 The WR-PEC hybrid photoelectrode is assembled step by step from semiconductor quantum dots and photosensitive dyes. Under continuous light irradiation, the photocurrent–wavelength curve reveals the dependence of the photocurrent on the wavelength. In this part of the work, they used CdS quantum dots and methylene blue as the photosensitive model to establish a double anode WR-pulsed electrochemical sensor, which reached a lower detection limit of 0.37 nM (based on Cu(II). The exciton trapping on the surface of CdTe QD and the photoinduced electron transfer process between CNNS and Cu(II) produce a quenching effect, which provides the feasibility for the sensitive determination of Cu(II). The outstanding performance and development potential of WR-pulse electrochemical technology will undoubtedly become a new concept of electrochemical sensors.
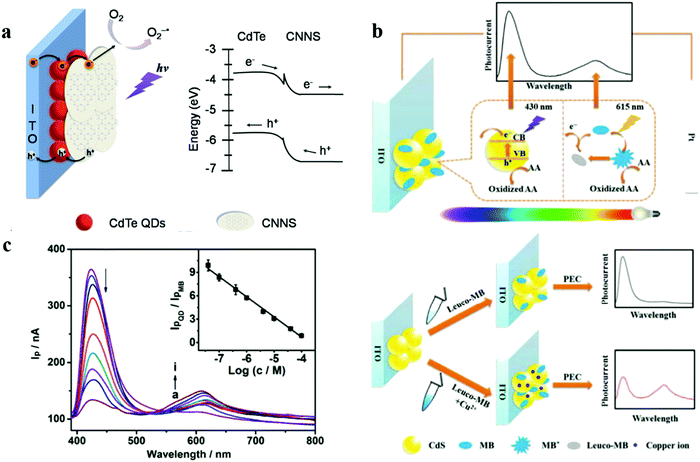 | ||
| Fig. 12 (a) Schematic illustration of carbon nitride nanosheets sensitized quantum dots as photocathode for photoelectrochemical biosensing. Adapted with permission from ref. 130. Copyright©2015 Elsevier. (b) The schematic illustration of wavelength-resolved radiometric photoelectrochemical photocurrent generation process of CdS and MB in a visible light range, and the sensing principle of Cu(II). (c) The optimization curve of the wavelength-resolved radiometric photoelectrochemical sensor in response to different concentrations of Cu(II). Adapted with permission from ref. 131. Copyright©2015 The Royal Society of Chemistry. | ||
4. Conclusion
In this review, we discussed various electrochemical methods for monitoring heavy metal ions in water. Compared with the traditional detection methods, electrochemical detection has its own significant advantages. Specifically, electrochemical detection is cost-effective, sensitive and fast, and is quite portable, and can be applied for on-site detection in various locations. As discussed above, a nanostructured sensor, bioactive molecule composite–nanocomposite matrix (biosensing device), and nanopore sensor are excellent tools for detecting Hg(II), Cd(II), As(III), Pb(II), UO2(II), Tl(I), Cr(VI), Ag(I), and Cu(II) in water. In addition, a variety of electrochemical techniques such as cyclic voltammetry, square wave voltammetry, differential pulse voltammetry, and the current method provide a variety of options for the detection of heavy metal ions. Among them, anodic stripping voltammetry is the most sensitive and effective man–machine interface detection technology. Electrochemical technology has shown great potential in the detection of heavy metal ions. Modified nanocomposites have received extensive attention due to their excellent performance, but many development challenges still need to be addressed. For example, the modified electrode to detect heavy metal ions needs to be detected in aqueous media, which is difficult to achieve in solid media and suspended substances. In addition, the toxicity of the interface material needs to be considered before being applied to actual water samples. After this, more preset electrodes for disposable test strips can be developed, which can be used for more effective and hygienic testing of residential water and drinking water.Conflicts of interest
There are no conflicts to declare.Acknowledgements
This work was financially supported by the National Key R&D Program (2017YFC1600306).References
- M. Lu, Y. Deng, Y. Luo, J. Lv, T. Li, J. Xu, S. W. Chen and J. Wang, Anal. Chem., 2019, 91, 888–895 CrossRef CAS.
- J. Yang, Y. Zhang, L. Zhang, H. Wang, J. Nie, Z. Qin, J. Li and W. Xiao, Chem. Commun., 2017, 53, 7477–7480 RSC.
- B. Bansod, T. Kumar, R. Thakur, S. Rana and I. Singh, Biosens. Bioelectron., 2017, 94, 443–455 CrossRef CAS PubMed.
- Y. N. Zhang, Q. Niu, X. Gu, N. Yang and G. Zhao, Nanoscale, 2019, 11, 11992–12014 RSC.
- M. R. Saidur, A. R. Aziz and W. J. Basirun, Biosens. Bioelectron., 2017, 90, 125–139 CrossRef CAS PubMed.
- P. Veerakumar, V. Veeramani, S. M. Chen, R. Madhu and S. B. Liu, ACS Appl. Mater. Interfaces, 2016, 8, 1319–1326 CrossRef CAS PubMed.
- M. Yang, P. H. Li, S. H. Chen, X. Y. Xiao, X. H. Tang, C. H. Lin, X. J. Huang and W. Q. Liu, Small, 2020, 16, e2001035 CrossRef.
- A. Waheed, M. Mansha and N. Ullah, TrAC, Trends Anal. Chem., 2018, 105, 37–51 CrossRef CAS.
- L. Lu, L. Zhou, J. Chen, F. Yan, J. Liu, X. Dong, F. Xi and P. Chen, ACS Nano, 2018, 12, 12673–12681 CrossRef CAS.
- S. Sawan, R. Maalouf, A. Errachid and N. Jaffrezic-Renault, TrAC, Trends Anal. Chem., 2020, 131, 116014 CrossRef CAS.
- M. Abdulla, A. Ali, R. Jamal, T. Bakri, W. Wu and T. Abdiryim, Polymers, 2019, 11, 815 CrossRef CAS PubMed.
- F. Xie, M. Yang, M. Jiang, X.-J. Huang, W.-Q. Liu and P.-H. Xie, TrAC, Trends Anal. Chem., 2019, 119, 115624 CrossRef CAS.
- M. A. Deshmukh, R. Celiesiute, A. Ramanaviciene, M. D. Shirsat and A. Ramanavicius, Electrochim. Acta, 2018, 259, 930–938 CrossRef CAS.
- P. Miao, Y. Tang and L. Wang, ACS Appl. Mater. Interfaces, 2017, 9, 3940–3947 CrossRef CAS PubMed.
- L. Ma, X. Zhang, M. Ikram, M. Ullah, H. Wu and K. Shi, Chem. Eng. J., 2020, 395, 125216 CrossRef CAS.
- L. Wang, X. Peng, H. Fu, C. Huang, Y. Li and Z. Liu, Biosens. Bioelectron., 2020, 147, 111777 CrossRef CAS PubMed.
- M. Shirani, S. Habibollahi and A. Akbari, Food Chem., 2019, 281, 304–311 CrossRef CAS PubMed.
- B. Jackson, V. Taylor, R. A. Baker and E. Millee, Environ. Sci. Technol., 2009, 43, 2463 CrossRef CAS.
- Q. Wu, J. Shi, X. Ji, T. Xia, L. Zeng, G. Li, Y. Wang, J. Gao, L. Yao, J. Ma, X. Liu, N. Liu, L. Hu, B. He, Y. Liang, G. Qu and G. Jiang, ACS Nano, 2020, 14, 12828–12839 CrossRef CAS PubMed.
- L. Kong, X. Hu, X. Peng and X. Wang, Environ. Sci. Technol., 2020, 54, 14076–14084 CrossRef PubMed.
- E. Hanhauser, M. S. Bono Jr, C. Vaishnav, A. J. Hart and R. Karnik, Environ. Sci. Technol., 2020, 54, 2646–2657 CrossRef CAS.
- G. M. Lo Dico, F. Galvano, G. Dugo, C. D'Ascenzi, A. Macaluso, A. Vella, G. Giangrosso, G. Cammilleri and V. Ferrantelli, Food Chem., 2018, 245, 1163–1168 CrossRef CAS PubMed.
- A. Weller, D. Zok, S. Reinhard, S. K. Woche, G. Guggenberger and G. Steinhauser, Anal. Chem., 2020, 92, 5249–5257 CrossRef CAS PubMed.
- J. Qian, X. Gao and B. Pan, Environ. Sci. Technol., 2020, 54, 8509–8526 CrossRef CAS.
- I. Umegaki, Y. Higuchi, Y. Kondo, K. Ninomiya, S. Takeshita, M. Tampo, H. Nakano, H. Oka, J. Sugiyama, M. K. Kubo and Y. Miyake, Anal. Chem., 2020, 92, 8194–8200 CrossRef CAS PubMed.
- N. Ma, X. Ren, H. Wang, X. Kuang, D. Fan, D. Wu and Q. Wei, Anal. Chem., 2020, 92, 14069–14075 CrossRef CAS PubMed.
- J. Lin, N. Chen, R. Feng, M. J. Nilges, Y. Jia, S. Wang and Y. Pan, Environ. Sci. Technol., 2020, 54, 3169–3180 CrossRef CAS.
- A. Turner, Environ. Sci. Technol., 2019, 53, 8398–8404 CrossRef CAS.
- Y. Hou, Z. Zhang, S. Lu, J. Yuan, Q. Zhu, W. P. Chen, S. Ling, X. Li, Y. Z. Zheng, K. Zhu and M. Zhang, J. Am. Chem. Soc., 2020, 142, 18763–18768 CrossRef CAS PubMed.
- M. Tighe, M. Bielski, M. Wilson, G. Ruscio-Atkinson, G. F. Peaslee and M. Lieberman, Anal. Chem., 2020, 92, 4949–4953 CrossRef CAS PubMed.
- A. Hong, Q. Tang, A. U. Khan, M. Miao, Z. Xu, F. Dang, Q. Liu, Y. Wang, D. Lin, J. Filser and L. Li, Anal. Chem., 2021, 93, 1962–1968 CrossRef CAS PubMed.
- M. Dong, L. Wei, J. J. Gonzalez, D. Oropeza, J. Chirinos, X. Mao, J. Lu and R. E. Russo, Anal. Chem., 2020, 92, 7003–7010 CrossRef CAS PubMed.
- L. Yang, X. Sun, D. Wei, H. Ju, Y. Du, H. Ma and Q. Wei, Anal. Chem., 2021, 93, 1553–1560 CrossRef CAS PubMed.
- M. Yan, J. Ye, Q. Zhu, L. Zhu, T. Xiao, J. Huang and X. Yang, Anal. Chem., 2020, 92, 7265–7272 CrossRef CAS PubMed.
- D. Zhao, D. Siebold, N. T. Alvarez, V. N. Shanov and W. R. Heineman, Anal. Chem., 2017, 89, 9654–9663 CrossRef CAS.
- Q. Ding, Z. Kang, L. Cao, M. Lin, H. Lin and D.-P. Yang, Appl. Surf. Sci., 2020, 510, 145526 CrossRef CAS.
- R. Ramachandran, T.-W. Chen, S.-M. Chen, T. Baskar, R. Kannan, P. Elumalai, P. Raja, T. Jeyapragasam, K. Dinakaran and G. P. Gnana Kumar, Inorg. Chem. Front., 2019, 6, 3418–3439 RSC.
- Y. Zhang, H. Ma, D. Wu, R. Li, X. Wang, Y. Wang, W. Zhu, Q. Wei and B. Du, Biosens. Bioelectron., 2016, 77, 936–941 CrossRef CAS PubMed.
- Y. Wang, L. Wang, W. Huang, T. Zhang, X. Hu, J. A. Perman and S. Ma, J. Mater. Chem. A, 2017, 5, 8385–8393 RSC.
- T. Priya, N. Dhanalakshmi, S. Thennarasu and N. Thinakaran, Carbohydr. Polym., 2018, 182, 199–206 CrossRef CAS PubMed.
- T.-J. Jiang, Z. Guo, M.-J. Ma, L. Fang, M. Yang, S.-S. Li, J.-H. Liu, N.-J. Zhao, X.-J. Huang and W.-Q. Liu, Electrochim. Acta, 2016, 216, 188–195 CrossRef CAS.
- K. Chen, J. Li, L. Zhang, R. Xing, T. Jiao, F. Gao and Q. Peng, Nanotechnology, 2018, 29, 445603 CrossRef PubMed.
- Z. Guo, M.-L. Seol, C. Gao, M.-S. Kim, J.-H. Ahn, Y.-K. Choi and X.-J. Huang, Electrochim. Acta, 2016, 211, 998–1005 CrossRef CAS.
- H. Dai, N. Wang, D. Wang, H. Ma and M. Lin, Chem. Eng. J., 2016, 299, 150–155 CrossRef CAS.
- R. M. El-Shishtawy, H. A. Al-Ghamdi, M. M. Alam, Z. M. Al-amshany, A. M. Asiri and M. M. Rahman, Chem. Eng. J., 2018, 352, 225–231 CrossRef CAS.
- A. Scandurra, F. Ruffino, M. Urso, M. G. Grimaldi and S. Mirabella, Nanomaterials, 2020, 10, 1620 CrossRef CAS PubMed.
- G. M. S. Alves, L. S. Rocha and H. Soares, Talanta, 2017, 175, 53–68 CrossRef CAS PubMed.
- Y. Lu, X. Liang, C. Niyungeko, J. Zhou, J. Xu and G. Tian, Talanta, 2018, 178, 324–338 CrossRef CAS PubMed.
- L. Cui, J. Wu and H. Ju, Biosens. Bioelectron., 2015, 63, 276–286 CrossRef CAS PubMed.
- A. J. Borrill, N. E. Reily and J. V. Macpherson, Analyst, 2019, 144, 6834–6849 RSC.
- Y. Zhang, J. Xu, S. Zhou, L. Zhu, X. Lv, J. Zhang, L. Zhang, P. Zhu and J. Yu, Anal. Chem., 2020, 92, 3874–3881 CrossRef CAS PubMed.
- Y. Jiang, L. Shen, J. Ma, H. Ma, Y. Su and N. Zhu, Anal. Chem., 2021, 93, 2603–2609 CrossRef CAS PubMed.
- Y. Jiang, S. Cui, T. Xia, T. Sun, H. Tan, F. Yu, Y. Su, S. Wu, D. Wang and N. Zhu, Anal. Chem., 2020, 92, 14536–14541 CrossRef.
- J. Zou, D. Mao, Arramel, N. Li and J. Jiang, Appl. Surf. Sci., 2020, 506, 144672 CrossRef CAS.
- D. Wang, C. Ge, K. Lv, Q. Zou, Q. Liu, L. Liu, Q. Yang and S. Bao, Chem. Commun., 2018, 54, 13718–13721 RSC.
- Z. B. Wen, W. B. Liang, Y. Zhuo, C. Y. Xiong, Y. N. Zheng, R. Yuan and Y. Q. Chai, Chem. Commun., 2017, 53, 7525–7528 RSC.
- S. Mao, J. Chang, G. Zhou and J. Chen, Small, 2015, 11, 5336–5359 CrossRef CAS PubMed.
- M. Yang, Y. X. Li, M. Jiang, P. H. Li, S. H. Chen, J. H. Liu, C. H. Lin, X. J. Huang and W. Q. Liu, Small, 2020, 16, e1906830 CrossRef PubMed.
- A. C. Lazanas, K. Tsirka, A. S. Paipetis and M. I. Prodromidis, Electrochim. Acta, 2020, 336, 135726 CrossRef CAS.
- W. C. Lin, Z. Li and M. A. Burns, Anal. Chem., 2017, 89, 8748–8756 CrossRef CAS PubMed.
- N. Qiu, Y. Liu and R. Guo, Electrochim. Acta, 2016, 212, 147–154 CrossRef CAS.
- Q. Sun, J. Wang, M. Tang, L. Huang, Z. Zhang, C. Liu, X. Lu, K. W. Hunter and G. Chen, Anal. Chem., 2017, 89, 5024–5029 CrossRef CAS.
- S. S. Li, M. Jiang, T. J. Jiang, J. H. Liu, Z. Guo and X. J. Huang, J. Hazard. Mater., 2017, 338, 1–10 CrossRef CAS PubMed.
- Z. Zhang, H. Ji, Y. Song, S. Zhang, M. Wang, C. Jia, J. Y. Tian, L. He, X. Zhang and C. S. Liu, Biosens. Bioelectron., 2017, 94, 358–364 CrossRef CAS.
- S. Xue, P. Jing and W. Xu, Biosens. Bioelectron., 2016, 86, 958–965 CrossRef CAS PubMed.
- S. H. Yu, C. S. Lee and T. H. Kim, Nanomaterials, 2019, 9, 817 CrossRef CAS PubMed.
- S.-S. Li, X.-L. Cheng, Q.-Q. Xu, W.-Y. Zhou, Y. Zhang and M. Yang, Electrochim. Acta, 2020, 360, 136991 CrossRef CAS.
- Z. Lu, W. Dai, X. Lin, B. Liu, J. Zhang, J. Ye and J. Ye, Electrochim. Acta, 2018, 266, 94–102 CrossRef CAS.
- J. P. Souza, C. Cerveira, T. M. Miceli, D. P. Moraes, M. F. Mesko and J. S. F. Pereira, Food Chem., 2020, 321, 126715 CrossRef CAS.
- E. Bernalte, S. Arévalo, J. Pérez-Taborda, J. Wenk, P. Estrela, A. Avila and M. Di Lorenzo, Sens. Actuators, B, 2020, 307, 127620 CrossRef.
- E. M. Hamilton, S. D. Young, E. H. Bailey, O. S. Humphrey and M. J. Watts, Environ. Sci. Technol., 2021, 55, 2422–2429 CrossRef CAS PubMed.
- J. Chi, B. Gao, M. Sun, F. Zhang, E. Su, H. Liu and Z. Gu, Anal. Chem., 2017, 89, 7727–7733 CrossRef CAS.
- T. Struve, K. Pahnke, F. Lamy, M. Wengler, P. Boning and G. Winckler, Nat. Commun., 2020, 11, 5655 CrossRef CAS PubMed.
- W. Cai, S. Xie, J. Zhang, D. Tang and Y. Tang, Biosens. Bioelectron., 2018, 117, 312–318 CrossRef CAS PubMed.
- L. Cui, J. Wu, M. Li and H. Ju, Electrochem. Commun., 2015, 59, 77–80 CrossRef CAS.
- V. Mariyappan, S. Manavalan, S.-M. Chen, G. Jaysiva, P. Veerakumar and M. Keerthi, ACS Appl. Electron. Mater., 2020, 2, 1943–1952 CrossRef CAS.
- S. Wen, T. Zeng, L. Liu, K. Zhao, Y. Zhao, X. Liu and H. C. Wu, J. Am. Chem. Soc., 2011, 133, 18312–18317 CrossRef CAS.
- M. Ghanei-Motlagh and M. A. Taher, Chem. Eng. J., 2017, 327, 135–141 CrossRef CAS.
- G. Zhao, Y. Yin, H. Wang, G. Liu and Z. Wang, Electrochim. Acta, 2016, 220, 267–275 CrossRef CAS.
- Y. Yao, H. Wu and J. Ping, Food Chem., 2019, 274, 8–15 CrossRef CAS PubMed.
- W. Y. Zhou, S. S. Li, J. Y. Song, M. Jiang, T. J. Jiang, J. Y. Liu, J. H. Liu and X. J. Huang, Anal. Chem., 2018, 90, 4328–4337 CrossRef CAS PubMed.
- W. Zhou, C. Li, C. Sun and X. Yang, Food Chem., 2016, 192, 351–357 CrossRef CAS PubMed.
- L. Fu, B. Zhang, K. Fu, X. Gao and G. Zou, Anal. Chem., 2020, 92, 6144–6149 CrossRef CAS PubMed.
- J. Liao, F. Yang, C.-Z. Wang and S. Lin, Sens. Actuators, B, 2018, 271, 195–202 CrossRef CAS.
- S. Li, C. Zhang, S. Wang, Q. Liu, H. Feng, X. Ma and J. Guo, Analyst, 2018, 143, 4230–4246 RSC.
- L. Cui, J. Wu and H. Ju, Chemistry, 2015, 21, 11525–11530 CrossRef CAS PubMed.
- R. Ding, Y. H. Cheong, A. Ahamed and G. Lisak, Anal. Chem., 2021, 93, 1880–1888 CrossRef CAS PubMed.
- L. Cui, J. Wu and H. Ju, ACS Appl. Mater. Interfaces, 2014, 6, 16210–16216 CrossRef CAS PubMed.
- A. Sánchez-Calvo, M. T. Fernández-Abedul, M. C. Blanco-López and A. Costa-García, Sens. Actuators, B, 2019, 290, 87–92 CrossRef.
- X.-M. Bi, H.-R. Wang, L.-Q. Ge, D.-M. Zhou, J.-Z. Xu, H.-Y. Gu and N. Bao, Sens. Actuators, B, 2018, 260, 475–479 CrossRef CAS.
- S. Sultan, A. Shah, B. Khan, R. Qureshi, J. I. Al-Mutawah, M. R. Shah and A. H. Shah, J. Electrochem. Soc., 2019, 166, B1719–B1726 CrossRef CAS.
- E. L. Sciuto, S. Petralia, J. R. van der Meer and S. Conoci, Biotechnol. Bioeng., 2020, 1–10 Search PubMed.
- L. Cui, J. Wu and H. Ju, Biosens. Bioelectron., 2016, 79, 861–865 CrossRef CAS PubMed.
- S. S. Li, W. Y. Zhou, Y. X. Li, M. Jiang, Z. Guo, J. H. Liu and X. J. Huang, Anal. Chem., 2018, 90, 1263–1272 CrossRef CAS PubMed.
- M. Stiboller, G. Raber, E. L. F. Gjengedal, M. Eggesbo and K. A. Francesconi, Anal. Chem., 2017, 89, 6265–6271 CrossRef CAS PubMed.
- Y. Qi, X. Mao, J. Liu, X. Na, G. Chen, M. Liu, C. Zheng and Y. Qian, Anal. Chem., 2018, 90, 6332–6338 CrossRef CAS PubMed.
- P. Podesva, I. Gablech and P. Neuzil, Anal. Chem., 2018, 90, 1161–1167 CrossRef CAS PubMed.
- J. H. Hwang, M. A. Islam, H. Choi, T. J. Ko, K. L. Rodriguez, H. S. Chung, Y. Jung and W. H. Lee, Anal. Chem., 2019, 91, 11770–11777 CrossRef CAS.
- Y. Zhao, L. Xu, M. Liu, Z. Duan and H. Wang, Food Chem., 2018, 239, 40–47 CrossRef CAS.
- Y. Xu, W. Zhang, J. Shi, X. Zou, Z. Li and Y. Zhu, Food Chem., 2016, 201, 190–196 CrossRef CAS.
- P. J. Yan, F. He, W. Wang, S. Y. Zhang, L. Zhang, M. Li, Z. Liu, X. J. Ju, R. Xie and L. Y. Chu, ACS Appl. Mater. Interfaces, 2018, 10, 36425–36434 CrossRef CAS PubMed.
- F. Cai, Q. Wang, X. Chen, W. Qiu, F. Zhan, F. Gao and Q. Wang, Biosens. Bioelectron., 2017, 98, 310–316 CrossRef CAS PubMed.
- L. H. Zhang, W. C. Li, D. Yan, H. Wang and A. H. Lu, Nanoscale, 2016, 8, 13695–13700 RSC.
- Z. Teng, H. Lv, L. Wang, L. Liu, C. Wang and G. Wang, Electrochim. Acta, 2016, 212, 722–733 CrossRef CAS.
- T. Priya, N. Dhanalakshmi, S. Thennarasu, S. Pulikkutty, V. Karthikeyan and N. Thinakaran, Food Chem., 2020, 317, 126430 CrossRef CAS PubMed.
- W. Kang, X. Pei, C. A. Rusinek, A. Bange, E. N. Haynes, W. R. Heineman and I. Papautsky, Anal. Chem., 2017, 89, 3345–3352 CrossRef CAS PubMed.
- M. Li, J. Wu, L. Cui and H. Ju, J. Electroanal. Chem., 2015, 757, 23–28 CrossRef CAS.
- Y. Zang, J. Lei, Q. Hao and H. Ju, ACS Appl. Mater. Interfaces, 2014, 6, 15991–15997 CrossRef CAS.
- L. Cui, J. Wu, J. Li and H. Ju, Anal. Chem., 2015, 87, 10635–10641 CrossRef CAS PubMed.
- C. Liu, P.-C. Hsu, J. Xie, J. Zhao, T. Wu, H. Wang, W. Liu, J. Zhang, S. Chu and Y. Cui, Nat. Energy, 2017, 2, 17007 CrossRef CAS.
- S. Abbasi, A. Sohrabi, A. Naghipour, M. B. Gholivand and F. Ahmadi, Anal. Lett., 2008, 41, 1128–1143 CrossRef CAS.
- S. K. Guin, A. S. Ambolikar, J. Paul Guin and S. Neogy, Sens. Actuators, B, 2018, 272, 559–573 CrossRef CAS.
- R. Gupta, M. Sundararajan and J. S. Gamare, Anal. Chem., 2017, 89, 8156–8161 CrossRef CAS PubMed.
- R. Gupta, J. S. Gamare, A. K. Pandey, D. Tyagi and J. V. Kamat, Anal. Chem., 2016, 88, 2459–2465 CrossRef CAS PubMed.
- Y. Peled, E. Krent, N. Tal, H. Tobias and D. Mandler, Anal. Chem., 2015, 87, 768–776 CrossRef CAS PubMed.
- H. Deng, M. Luo, X. Shi, P. N. Williams, K. Li, M. Liu, W. Fan, T. Xiao, Y. Chen, L. Q. Ma and J. Luo, Anal. Chem., 2019, 91, 1344–1352 CrossRef CAS PubMed.
- S. Li, W. Huang, Y. Duan, J. Xing and Y. Zhou, J. Forensic Sci., 2015, 60, 247–251 CrossRef CAS PubMed.
- A. Shah, A. Nisar, K. Khan, J. Nisar, A. Niaz, M. N. Ashiq and M. S. Akhter, Electrochim. Acta, 2019, 321, 134658 CrossRef CAS.
- B. Campanella, M. Onor, A. D'Ulivo, R. Giannecchini, M. D'Orazio, R. Petrini and E. Bramanti, Sci. Total Environ., 2016, 548–549, 33–42 CrossRef CAS PubMed.
- P. J. Huang, M. Vazin and J. Liu, Anal. Chem., 2015, 87, 10443–10449 CrossRef CAS PubMed.
- K. Węgiel, K. Jedlińska and B. Baś, J. Hazard. Mater., 2016, 310, 199–206 CrossRef PubMed.
- Y. Liu, X. Ke, X. Wu, C. Ke, R. Chen, X. Chen, X. Zheng, Y. Jin and B. Van der Bruggen, Environ. Sci. Technol., 2020, 54, 13304–13313 CrossRef CAS PubMed.
- H. Filik and A. A. Avan, Food Chem., 2019, 292, 151–159 CrossRef CAS PubMed.
- K. Zuo, X. Huang, X. Liu, E. M. Gil Garcia, J. Kim, A. Jain, L. Chen, P. Liang, A. Zepeda, R. Verduzco, J. Lou and Q. Li, Environ. Sci. Technol., 2020, 54, 13322–13332 CrossRef CAS PubMed.
- L. E. Korshoj, A. J. Zaitouna and R. Y. Lai, Anal. Chem., 2015, 87, 2560–2564 CrossRef CAS PubMed.
- J. Wei, Z. Guo, X. Chen, D. D. Han, X. K. Wang and X. J. Huang, Anal. Chem., 2015, 87, 1991–1998 CrossRef CAS PubMed.
- V. Y. Maldonado, P. J. Espinoza-Montero, C. A. Rusinek and G. M. Swain, Anal. Chem., 2018, 90, 6477–6485 CrossRef CAS PubMed.
- L. Cui, J. Wu, J. Li, Y. Ge and H. Ju, Biosens. Bioelectron., 2014, 55, 272–277 CrossRef CAS PubMed.
- P. Wang, X. Ma, M. Su, Q. Hao, J. Lei and H. Ju, Chem. Commun., 2012, 48, 10216–10218 RSC.
- Q. Hao, J. Lei, Q. Wang, Y. Zang and H. Ju, J. Electroanal. Chem., 2015, 759, 8–13 CrossRef CAS.
- Q. Hao, X. Shan, J. Lei, Y. Zang, Q. Yang and H. Ju, Chem. Sci., 2016, 7, 774–780 RSC.
| This journal is © The Royal Society of Chemistry 2021 |
