DOI:
10.1039/D0SM01504K
(Paper)
Soft Matter, 2020,
16, 10326-10333
Stratification of polymer–colloid mixtures via fast nonequilibrium evaporation†
Received
19th August 2020
, Accepted 24th September 2020
First published on 25th September 2020
Abstract
In drying liquid films of polymer–colloid mixtures, stratification in which polymers are placed on top of larger colloids is studied. It is often presumed that the formation of segregated polymer–colloid layers is solely due to the proportion in size at fast evaporation as in binary colloid mixtures. By comparing experiments with a theoretical model, we found that the transition in viscosity near the drying interface was another important parameter for controlling the formation of stratified layers in polymer–colloid mixtures. At high evaporation rates, increased polymer concentrations near the surface lead to a phase transition from a semidilute to concentrated regime, in which colloidal particles are kinetically arrested. Stratification only occurs if the formation of a stratified layer precedes the evolution to the concentrated regime near the drying interfaces. Otherwise, the colloids will be trapped by the polymers in the concentrated regime before forming a segregated layer. Also, no stratification is observed if the initial polymer concentration is too low to form a sufficiently high polymer concentration gradient within a short period of time. Our findings are relevant for developing solution-cast polymer composites for painting, antifouling and antireflective coatings.
1. Introduction
Solution-cast polymer composite films composed of polymer matrices containing colloidal particles have been widely studied for many applications, including paints,1 coatings,2,3 and cosmetics,4,5 because they provide highly tuned macroscopic properties relative to the pure polymer,6 through a simple manufacturing process. The controlled properties of the dried films are largely dependent on the spatial distribution of the polymer and colloid,7–10 which is strongly influenced by the solvent evaporation process.11,12 In particular, stratified layers consisting of a polymer layer on a colloidal layer have exhibited highly improved antifouling performance,13,14 and photoactive properties.15
Several previous studies have demonstrated ways of controlling the segregated layers of polymer–colloid mixtures in an equilibrium state.16–18 However, relatively little is known about how polymer–colloid mixtures can be stratified during the simple, fast and inexpensive nonequilibrium solvent evaporation process. Although solvent casting is one of the simplest manufacturing methods, from coffee ring stains19 to many industrial applications,1–5 the inherent nonequilibrium nature of drying has made it difficult to clarify the underlying mechanism.
As a solvent evaporates, the spatial distribution of the solutes in liquid films is determined by two competing factors: diffusion20 and receding drying interfaces. Solutes tend to distribute uniformly in drying films with a diffusion constant D, while a nonuniform concentration gradient is developed by the downward velocity of the interface vev. Which of the two phenomena dominates can be quantified by the dimensionless Péclet number Pe = vevz0/D, where z0 is the initial film thickness. If Pe > 1, the solutes cannot diffuse uniformly within the time of evaporation, and they accumulate near the top of the film. On the other hand, the drying film shows almost uniform distribution if Pe < 1.
In binary colloid mixtures, it was recently shown that stratifications with smaller colloids placed on large colloids can be realized if Pe is larger than 1.21–24 This occurs when the concentration gradient of both the large and smaller particles increases near the liquid/air interface. Fortini et al.22 proposed that the inverted stratification was caused by an imbalance in the osmotic pressure between the larger and smaller colloids. Zhou et al.23 suggested that the stratification phenomenon could be explained quantitatively using a diffusion model, with cross-interaction between the colloids. Sear and Warren24 argued that diffusiophoretic motion induced by the concentration gradient of the smaller components can exclude the larger colloids from the drying interfaces.
In a way similar to binary colloid mixtures, it has been proposed that a polymer–colloid mixture can yield the same stratified layers if the Pe values of both the polymer and colloid are larger than 1.24,25 However, these results have only been demonstrated by simulation and modelling studies, and few experimental studies have been performed on polymer–colloid stratification. Although polymers and colloids can show similar behaviors at very dilute concentrations,26,27 they might behave much differently at the high concentrations that any drying solution must experience for complete drying.28,29 The obvious difference is viscosity. It rapidly increases at relatively low concentrations in the polymer solution, slowing the motions of the species.29–31 In contrast, the viscosity of the colloidal suspension increases relatively slowly.32 Thus, the growth in viscosity near the interface, which can kinetically arrest larger colloids,33–35 needs to be considered differently for polymer and colloidal systems, but no appropriate studies have been performed yet.
In this work, we experimentally show that the formation of stratified layers, where a small polymer layer is placed on larger colloids, can be predicted using two competing time scales: the time at which the colloid begins to stratify (ts*) and the time at which the colloid is arrested by the transitions of viscosity near the interface (tc*).
We consider that the colloid starts to be arrested near the drying interfaces when the polymer concentration reaches a concentrated regime where the polymer chains are densely packed.31 The stratification can be observed only if ts* precedes tc*, or tc*/ts* > 1. Otherwise, the viscosity near the drying interface rapidly grows within a very short time and the colloids are kinetically trapped before a sufficient downward velocity away from the surface of large colloids is generated. In addition, when the initial polymer concentration is too low, no stratification can occur either because the concentration gradient of the polymer, or the additional migration velocity of the larger colloid, is not enough until the evaporation ends.
For the predictive analysis of ts* and tc*, we propose a simple model modified from a previous work.24 We observed quite excellent agreement in the final film morphology of the model prediction and experimental studies. Our comprehensive study predicts the spatial distribution of polymers and colloids in the final dried film, based on the experimental system and drying conditions.
2. Results and discussion
2.1 Structure of dried films of polymer–colloid
Mixtures of an aqueous polystyrene (PS) suspension with a mean diameter dc = 1 μm, and poly(ethylene glycol) (PEG) or poly(vinyl alcohol) (PVA) were used as a model system for stratification. The molecular weights of the polymers of PEG Mn (number average molecular weight) 6000 g mol−1, PEG Mn 20![[thin space (1/6-em)]](https://www.rsc.org/images/entities/char_2009.gif) 000 g mol−1, PVA Mw (weight average molecular weight) 6000 g mol−1, and PVA Mw 13000–23000 g mol−1 (PVA Mw 18000) were chosen to meet the condition of radius of colloid (Rcolloid) ≫ radius of polymer (Rpolymer). Before drying, the film solutions contained an initial volume fraction of ϕi,p = 0.01 or 0.04 for the polymer and ϕi,c = 0.67 × ϕi,p for the colloid, respectively. The volume ratio between polymer and colloid was selected to show a clear difference of stratified layer and non-stratified layer in the final dried films. The mixture solutions were deposited on glass substrates as z0 = 1.25 mm. The evaporation was performed at an ambient temperature and a relative humidity of 23%, resulting in an initial polymer Péclet number Pei,p > 1 (Fig. S1, ESI†). All of the experimental systems are summarized in Table 1. When the evaporation was completed, the final film morphologies were analyzed with the help of scanning electronic microscopy (SEM) and ImageJ analysis.
000 g mol−1, PVA Mw (weight average molecular weight) 6000 g mol−1, and PVA Mw 13000–23000 g mol−1 (PVA Mw 18000) were chosen to meet the condition of radius of colloid (Rcolloid) ≫ radius of polymer (Rpolymer). Before drying, the film solutions contained an initial volume fraction of ϕi,p = 0.01 or 0.04 for the polymer and ϕi,c = 0.67 × ϕi,p for the colloid, respectively. The volume ratio between polymer and colloid was selected to show a clear difference of stratified layer and non-stratified layer in the final dried films. The mixture solutions were deposited on glass substrates as z0 = 1.25 mm. The evaporation was performed at an ambient temperature and a relative humidity of 23%, resulting in an initial polymer Péclet number Pei,p > 1 (Fig. S1, ESI†). All of the experimental systems are summarized in Table 1. When the evaporation was completed, the final film morphologies were analyzed with the help of scanning electronic microscopy (SEM) and ImageJ analysis.
Table 1 Various polymer–colloid systems tested
| Colloid |
Polymer |
R
g
(nm) |
ϕ
i,p
|
Pei |
Stratification |
t
c*/ts* |
t
c* |
t
s* |
| Colloid was fixed as PS to exclude gravitational effect during drying (ρPS ≈ ρwater). A total of 8 systems were experimentally studied under ϕi,p:ϕi,c = 3:2, z0 = 1.25 mm and 23% relative humidity conditions. See ESI. |
| PS (r = 500 nm) |
PEG |
M
n 6000 |
3.6 |
0.01 |
4 |
X |
1.012 |
0.928 |
0.917 |
| 0.04 |
7 |
O |
1.153 |
0.670 |
0.581 |
| PEG |
M
n 20000 |
7.4 |
0.01 |
9 |
X |
0.976 |
0.841 |
0.862 |
| 0.04 |
22 |
X |
0.818 |
0.243 |
0.297 |
| PVA |
M
w 6000 |
3.5 |
0.01 |
4 |
X |
0.994 |
0.873 |
0.878 |
| 0.04 |
9 |
O |
0.911 |
0.400 |
0.439 |
| PVA |
M
w 18000 |
6.8 |
0.01 |
8 |
X |
0.882 |
0.707 |
0.802 |
| 0.04 |
24 |
X |
0.466 |
0.118 |
0.253 |
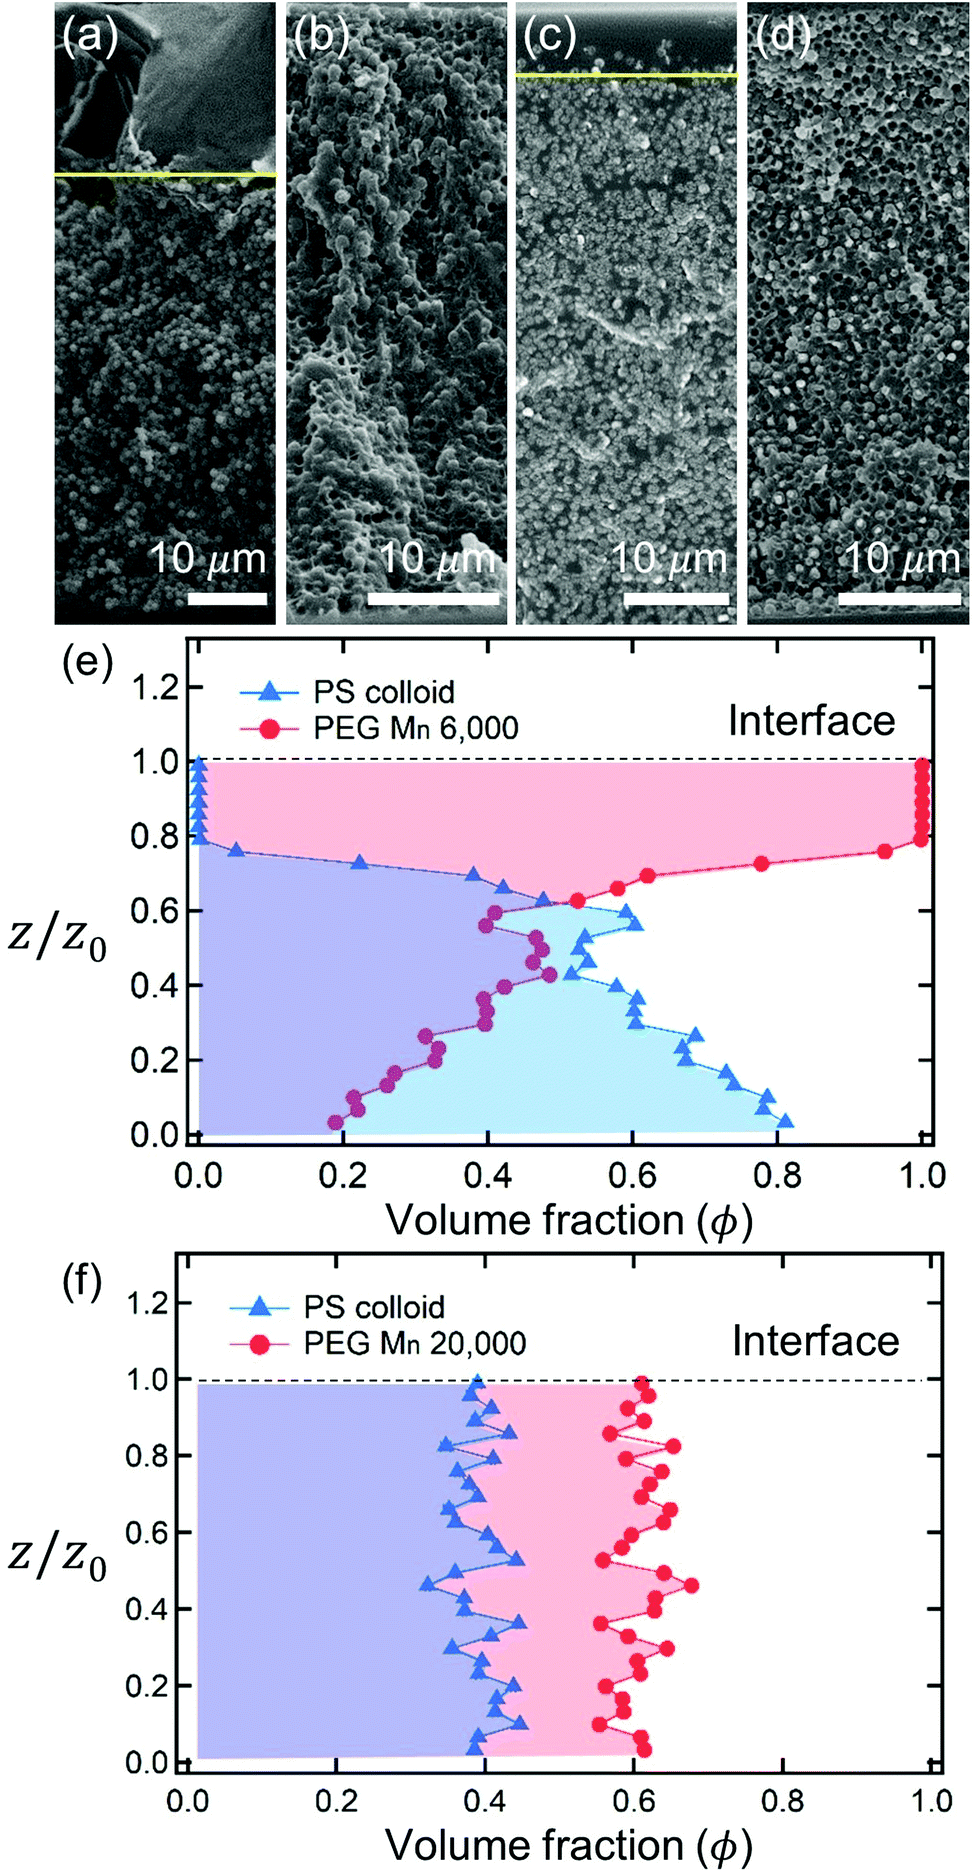
After complete drying, the polymers were enriched at the top of the films for PEG Mn 6000 g mol−1 (ϕi,p = 0.04) [Fig. 1(a)] and PVA Mw 6000 g mol−1 (ϕi,p = 0.04) [Fig. 1(c)] while the other 6 dried films shown in Fig. 1(b, d) and 2(a–d) were not segregated, but randomly distributed. Although the stratified layers in Fig. 1(a and c) also showed different degrees of stratification, there was a clear difference between the stratified layers [Fig. 1(e)] and non-stratified layers [Fig. 1(f), 2(e and f)].
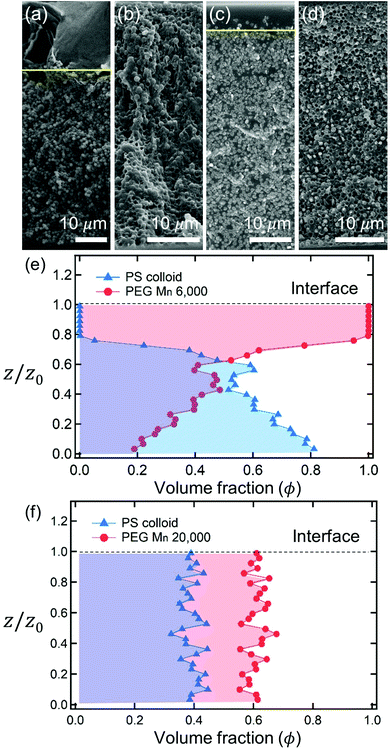 |
| | Fig. 1 Cross sectional SEM images of dried films of polymer–colloid mixtures (ϕi,p = 0.04, ϕi,p:ϕi,c = 3:2). The upper row shows various polymer–colloid distributions according to the polymer types and molecular weights: (a) PEG Mn 6000, (b) PEG Mn 20000, (c) PVA Mw 6000, and (d) PVA Mw 18000. The yellow lines represent the boundary of stratified layers. If there is no clear boundary, nothing is denoted. The lower rows are the estimated relative volume fraction of polymer ϕp (red circles) and colloid ϕc (blue triangles) of two representatives: (e) PEG Mn 6000 and (f) PEG Mn 20000. The colloidal volume fractions were obtained from SEM images through ImageJ analysis. The remained volume fraction was considered as polymer volume fraction ϕp = 1 − ϕc. | |
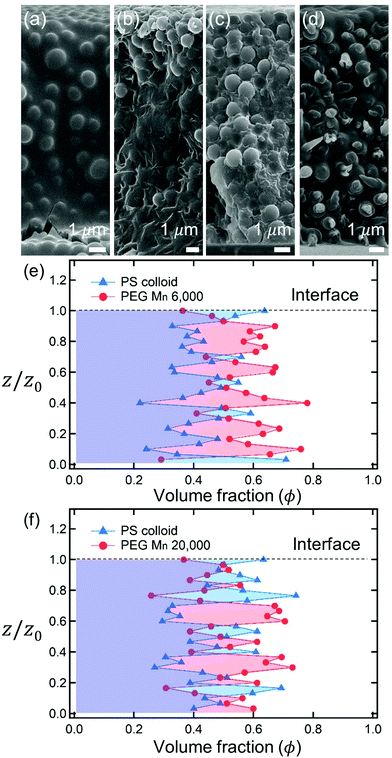 |
| | Fig. 2 SEM images of dried films formed from polymer–colloid mixtures (ϕi,p = 0.01, ϕi,p:ϕi,c = 3:2). Distributions of polymer and colloid are shown through the upper row depending on the polymer types and molecular weights: (a) PEG Mn 6000, (b) PEG Mn 20000, (c) PVA Mw 6000, and (d) PVA Mw 18000. There was no clear stratified layer in all four images. The volume fractions of polymer ϕp (red circles) and colloid ϕc (blue triangles) of the two dried films were obtained from SEM image analysis: (e) PEG Mn 6000 and (f) PEG Mn 20000. The volume fractions of the colloids were estimated by ImageJ analysis, and the polymer volume fraction was determined by ϕp = 1 − ϕc. | |
2.2 Modified theoretical model of dynamic stratification
As the solvent evaporated at Pe > 1 for both polymer and colloid, the descending air/water interface zinterface compressed the polymer and colloid, and they accumulated near the drying interface. From previous studies,24,36 the transition of the polymer concentration in a drying film ϕp(z,t) can be written as| |  | (1) |
| | | zinterface(t*) = z0 − vevt = (1 − t*)z0 | (2) |
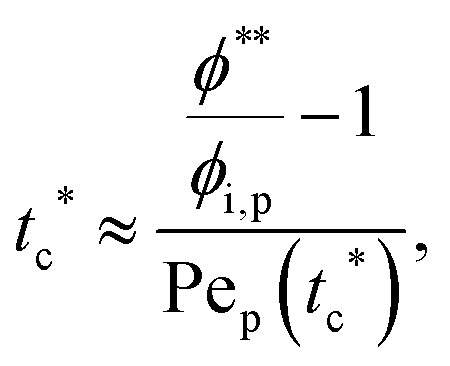
if the Péclet number of the polymer Pep ≫ 1, where t* = tvev/z0(0 ≤ t* ≤ 1) is the dimensionless time. Here, Pep and the diffusion coefficient of the polymer Dp can be expressed as a function of drying time when Pep and Dp vary slowly. Since the viscosity growth derived from the increased polymer concentration can be accompanied by the kinetic arrest of the colloidal particles, tc* can be determined as the time when the volume fraction of polymer reaches the concentrated regime ϕp = ϕp**. We consider that the colloidal particles at the drying interface (z = zinterface) are kinetically arrested when the polymer fraction reaches ϕp** at z = zinterface − rcolloid| | | ϕp(zinterface − rcolloid,tc*) = ϕp**. | (3) |
Meanwhile, increasing the concentration gradients of the small polymers can also create the diffusiophoretic drift velocity of larger colloids vdiffusiophoresis37,38
| |  | (4) |
under the condition of
Rcolloid ≫
Rpolymer. Since there is an assumption that
t*Pe
p should be large enough in
eqn (1), the polymer concentration gradient at the interface ∇
ϕp = −
vevϕinterface/
Dp39 is applied from the simple 1D diffusion model. This gives the diffusiophoretic velocity of the interfacial colloids with the combination of
ϕinterface =
ϕi,p(1 + Pe
pt*) originating from
eqn (1) at
z =
zinterface,
| | 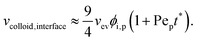 | (5) |
The time at which the colloid begins to stratify during the evaporation process (
ts*) is determined by comparing
vcolloid,interface and
vev. Near the time when evaporation begins, the gradient of polymer concentration is not too large and
vcolloid,interface does not overcome
vev. In this state, both the polymer and colloid simply accumulate at the drying interface. If the concentration gradient of the polymer is large enough for the formation of a higher colloidal diffusiophoretic velocity, however,
vcolloid,interface is larger than
vev and it starts to create stratified layers in the drying film. We consider the time
ts* when
vcolloid,interface =
vev, resulting in
| | | vcolloid,interface(ts*) = vev. | (6) |
The final morphologies of the drying polymer–colloid mixtures are determined by the two competing time scales ts* and tc*. There are three regimes for the predictive analysis of the stratification of polymer–colloid mixtures. The first is tc*/ts* > 1, where the downward motion of the colloidal particles appears before ϕp(zinterface − rcolloid,tc*) = ϕp**. The second is tc*/ts* < 1, where the polymer volume fraction reaches ϕp** before the evolution of vcolloid,interface(ts*) = vev. The third is ts* ≈ 1, where ts* reaches the time at which evaporation ends (t* = 1), even though ts* precedes tc*.
2.3 Comparison of experimental results and the theoretical model
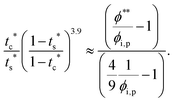
As described above, the prediction of polymer–colloid stratification can be estimated using the competition between tc* and ts*. For the time dependent volume fraction of the polymer in the drying films, evaporation rates were determined by measuring mass reduction (Fig. S2, ESI†). To calculate the time dependent (or concentration dependent) polymer diffusion coefficient, the average volume fractions of polymer in the drying film were used to estimate Dp (see Fig. S4, ESI†). Here, the self-diffusion coefficient of the polymer is used rather than the collective diffusion coefficient due to the slow polymer diffusion caused by the presence of colloids as the concentration increases (Fig. S3, ESI†). The transition of the volume fraction of semidilute entangled ϕe to the concentrated regime ϕ** in good solvent was determined by the specific viscosity ηsp slope transition29,30,40 shown in Fig. 3. From the slope transition of semidilute unentangled (ηsp ∼ ϕ1.3p) to semidilute entangled (ηsp ∼ ϕ3.9p), ϕe of the polymer in good solvent was measured. Similarly, ϕ** can be estimated using the slope transition point between the semidilute entangled regime (ηsp ∼ ϕ3.9p) and the concentrated regime (ηsp ∼ ϕαp, where α > 3.9).
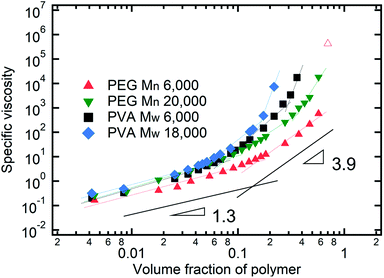 |
| | Fig. 3 Specific viscosity of four polymer solutions as a function of polymer volume fraction. Polymer volume fraction where it goes to the concentrated regime ϕ** is estimated by the slope transition point from 3.9 to larger than 3.9. In the case of PEG Mn 6000, ϕ** is considered as max. solubility (≈630 mg ml−1 at 20 °C). As the PEG Mn 6000 solution goes to higher than max. solubility, it shows an abrupt increment of specific viscosity (empty red triangle). | |
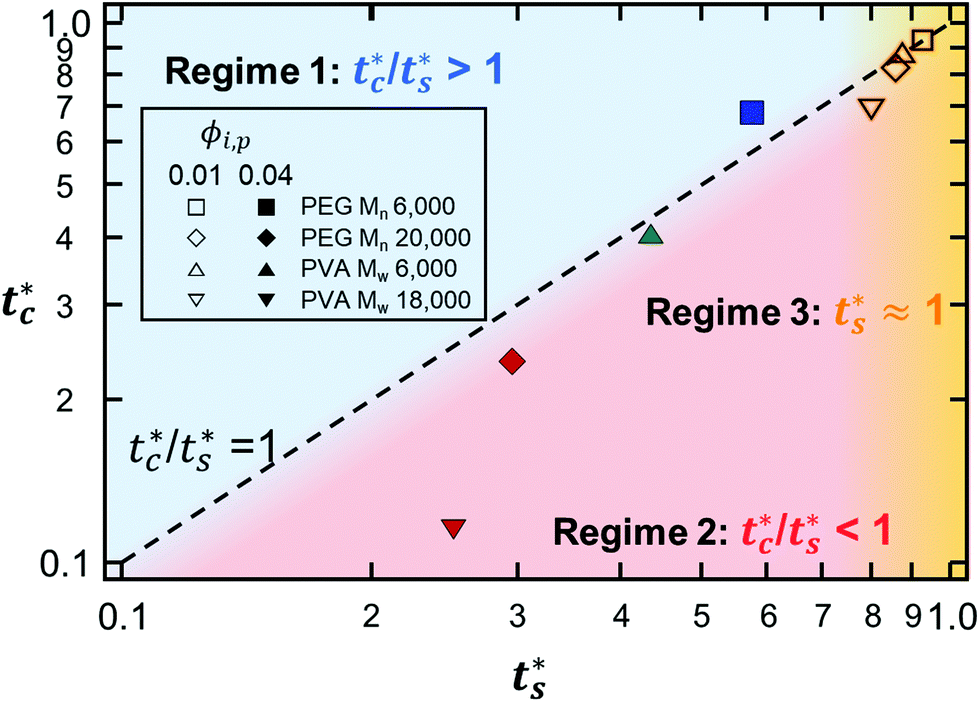
In drying films of polymer–colloid mixtures, the final film morphology can be predicted using the three regimes in the (ts*, tc*) plane. Regime 1 with tc*/ts* > 1 indicates clearly stratified layers in the dried films. Regime 2 represents nonsegregated layers, because tc* appears before ts*. Regime 3 also shows nonstratified layers in the final morphology of the complete dried polymer–colloid mixtures, since ts* appears very close to 1 (ts* ≈ 1).
The theoretical predictions based on eqn (3) and (6) and the experimental stratification results from 8 different systems are presented in Fig. 4. There is good agreement between the model prediction and experimental results.
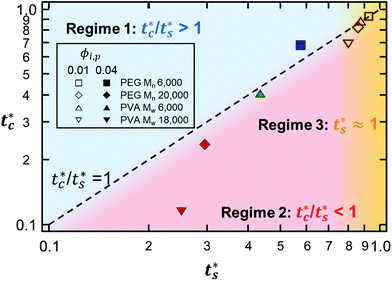 |
| | Fig. 4 State diagram on the (ts*, tc*) plane. The dotted line corresponds to tc*/ts* = 1. Theoretical predictions of 8 different systems are denoted as symbols in the diagram, and the experimental results are represented by colors. Blue indicates regime 1 (tc*/ts* > 1) where a stratified layer is expected and red shows regime 2 (tc*/ts* < 1). Orange designates regime 3 (ts* ≈ 1) (Fig. S5, ESI†). The green indicates the intermediate state where a stratified layer is observed in experiments while it belongs to regime 2 in model prediction. All data points show overall agreement with one exception, the filled green triangle, which also appears close to tc*/ts* = 1. | |
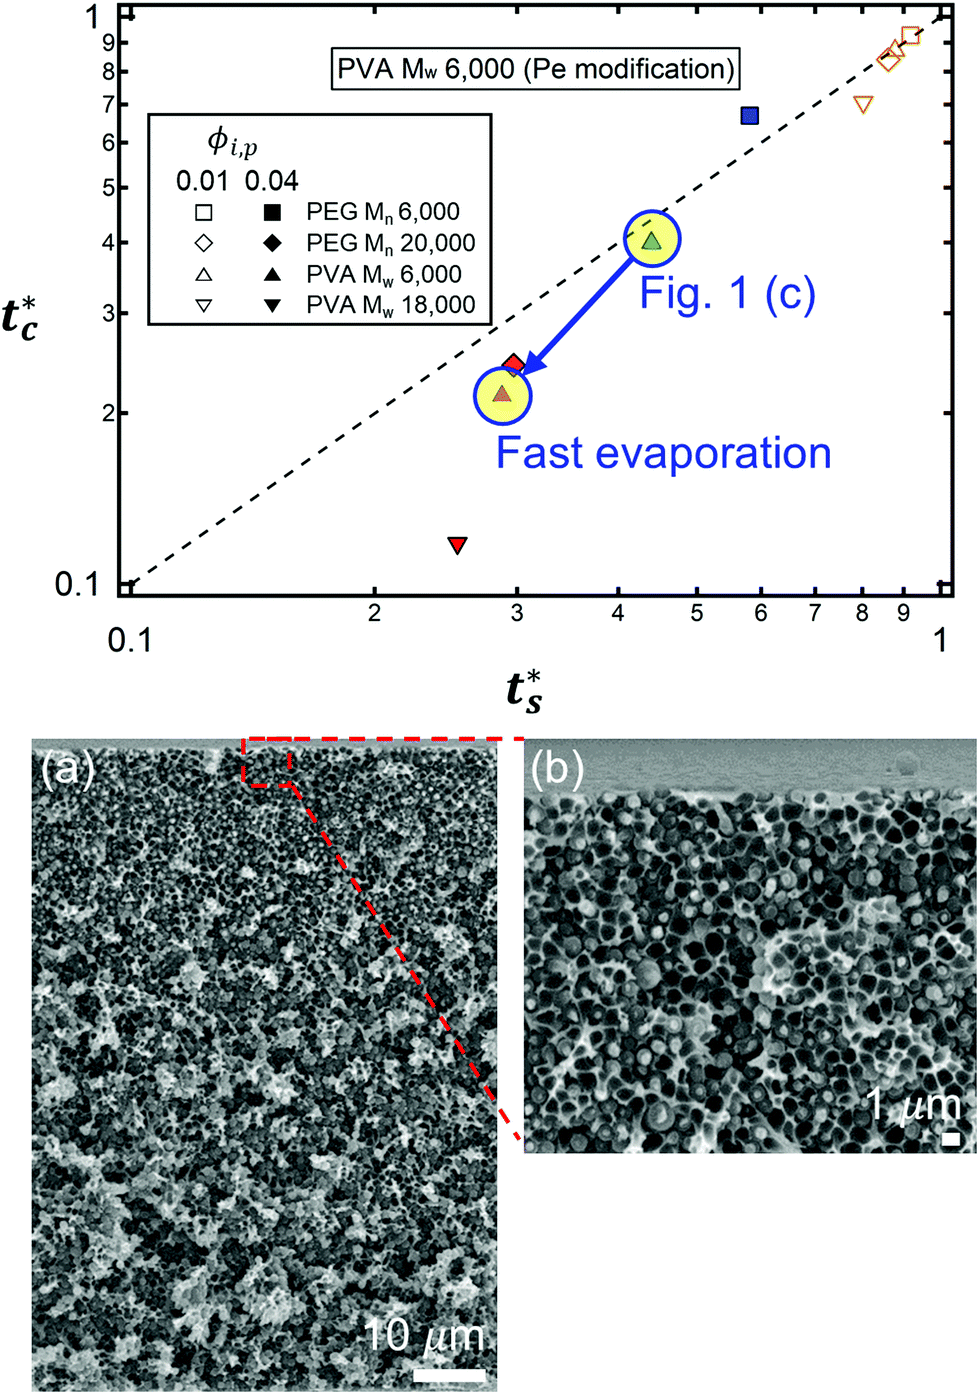
However, the model prediction does not show excellent agreement with experimental studies, especially for the PVA Mw 6000 (ϕi,p = 0.04) system, which appears to be closest to tc*/ts* = 1. This might be due to the air/water interfacial activity of PVA Mw 6000 (Fig. S6, ESI†), which can lead to a smaller ts* under real drying conditions, but it cannot bring tc* forward since tc* is related to z = zinterface − rcolloid, not z = zinterface. To reduce the interfacial activity effect of PVA Mw 6000 (ϕi,p = 0.04) on stratification, we moved the point to deviate from tc*/ts* = 1 in our theoretical model by changing vev. As it deviates from tc*/ts* = 1, the theoretical prediction becomes consistent with the experimental result for PVA Mw 6000 (ϕi,p = 0.04) (Fig. 5).
 |
| | Fig. 5 State diagram of PVA Mw 6000 (ϕi,p = 0.04) on the (ts*, tc*) plane. The dotted line corresponds to tc*/ts* = 1. The filled green triangle deviated from tc*/ts* = 1 in the theoretical model only by increasing vev. As it stays away from tc*/ts* = 1, the intermediate stratified morphology where a stratified layer is observed in experiment while it belongs to regime 2 in the model prediction becomes consistent with the model prediction. (a) SEM image of PVA Mw 6000 (ϕi,p = 0.04) at fast evaporation. (b) Top of the cross-sectional SEM image (a). The evaporation rate was controlled by convective flow of air with a relative humidity of 23% at ambient temperature. | |
2.4 Conditions for polymer–colloid stratification
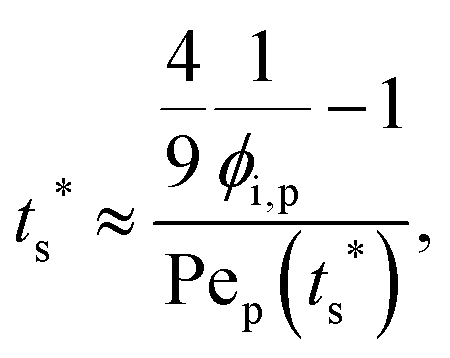
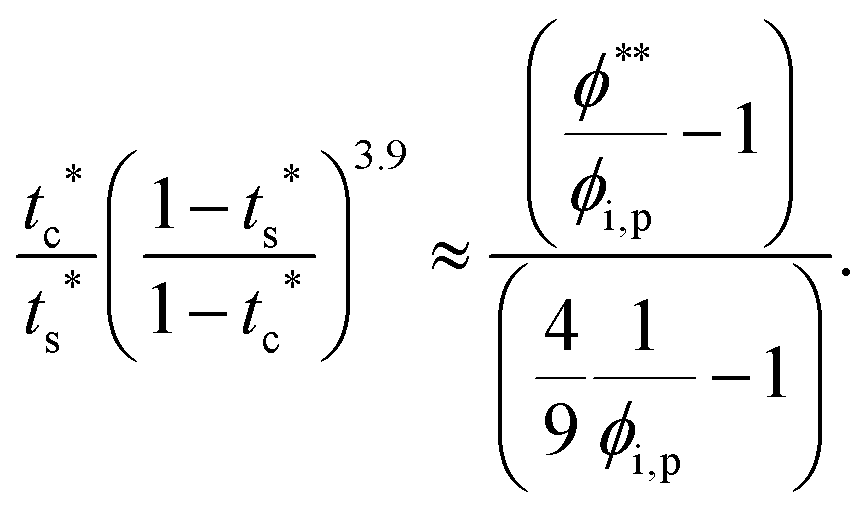
To analyze the general conditions for polymer–colloid stratification, we represented tc* and ts* in another experimental parameter. As mentioned above, the polymer-on-top structure can be formed when the two conditions, both ts* < 1 and tc*/ts* > 1, are satisfied. From eqn (3) and (6), tc* and ts* are (see ESI†)| |  | (7) |
| |  | (8) |
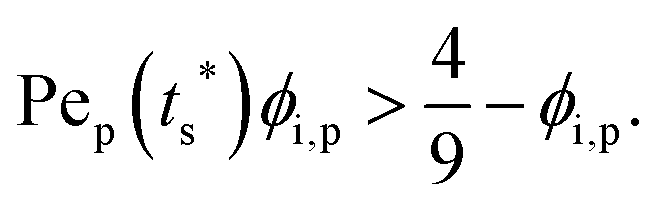
where Pep(tc*) and Pep(ts*) are the Pe of the polymer at dimensionless time t* = tc* and t* = ts*, respectively. The first condition for the stratification to happen, ts* < 1, is| | 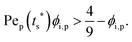 | (9) |
This follows a condition similar to that of the inverted stratification of binary colloidal mixtures.23,35,41
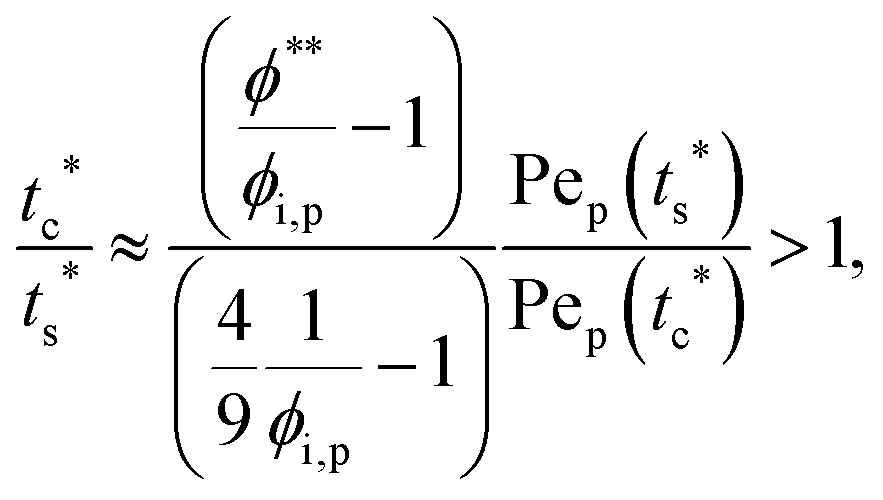
The second requirement for stratified layers in polymer–colloid mixtures, tc*/ts* > 1, can be expressed as
| |  | (10) |
| |  | (11) |
The polymer solutions are in the semi-dilute entangled regime (close to
ϕp =
ϕ**) when
t* =
tc* and
t* =
ts*,
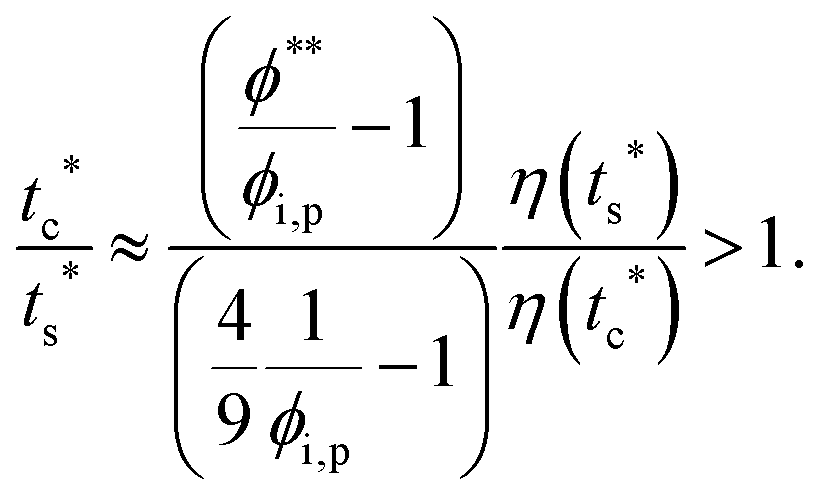
η(
t*) is
| |  | (12) |
from eqn (S14) of ESI,
† where
te* is the dimensionless time when
η =
ηe (viscosity when
ϕp =
ϕe) from eqn (S10) of the ESI.
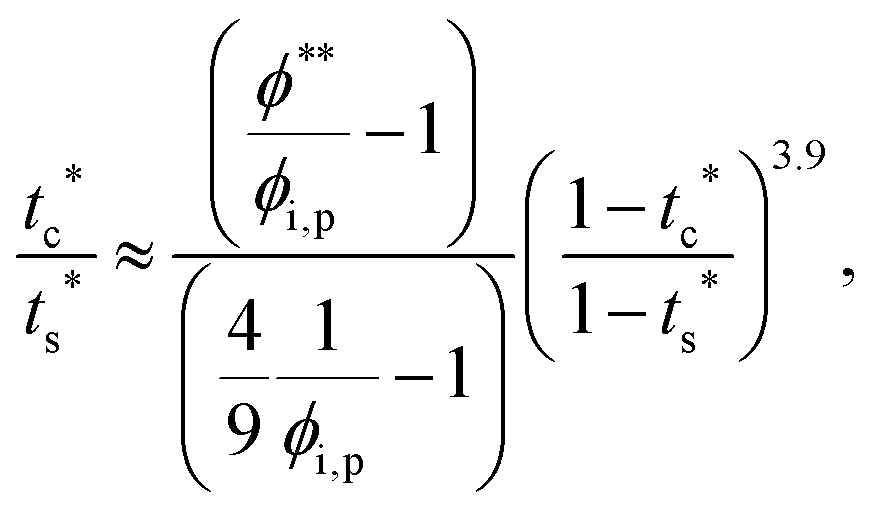
† If we neglect the last term in
eqn (12),
| | 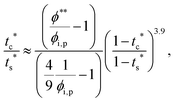 | (13) |
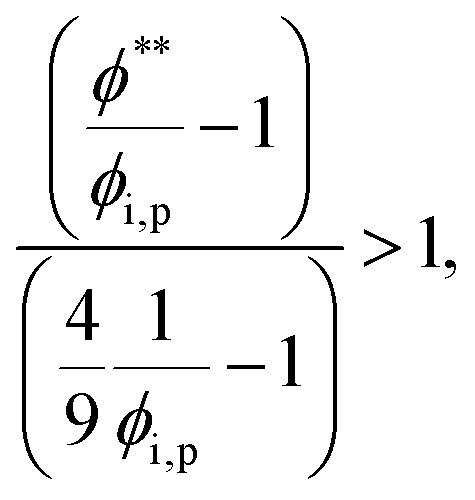
| |  | (14) |
To satisfy the condition of
tc*/
ts* > 1 for polymer–colloid stratification,
| |  | (15) |
| |  | (16) |
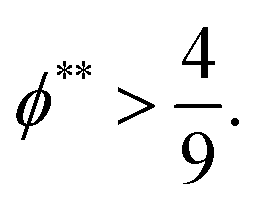
| |  | (17) |
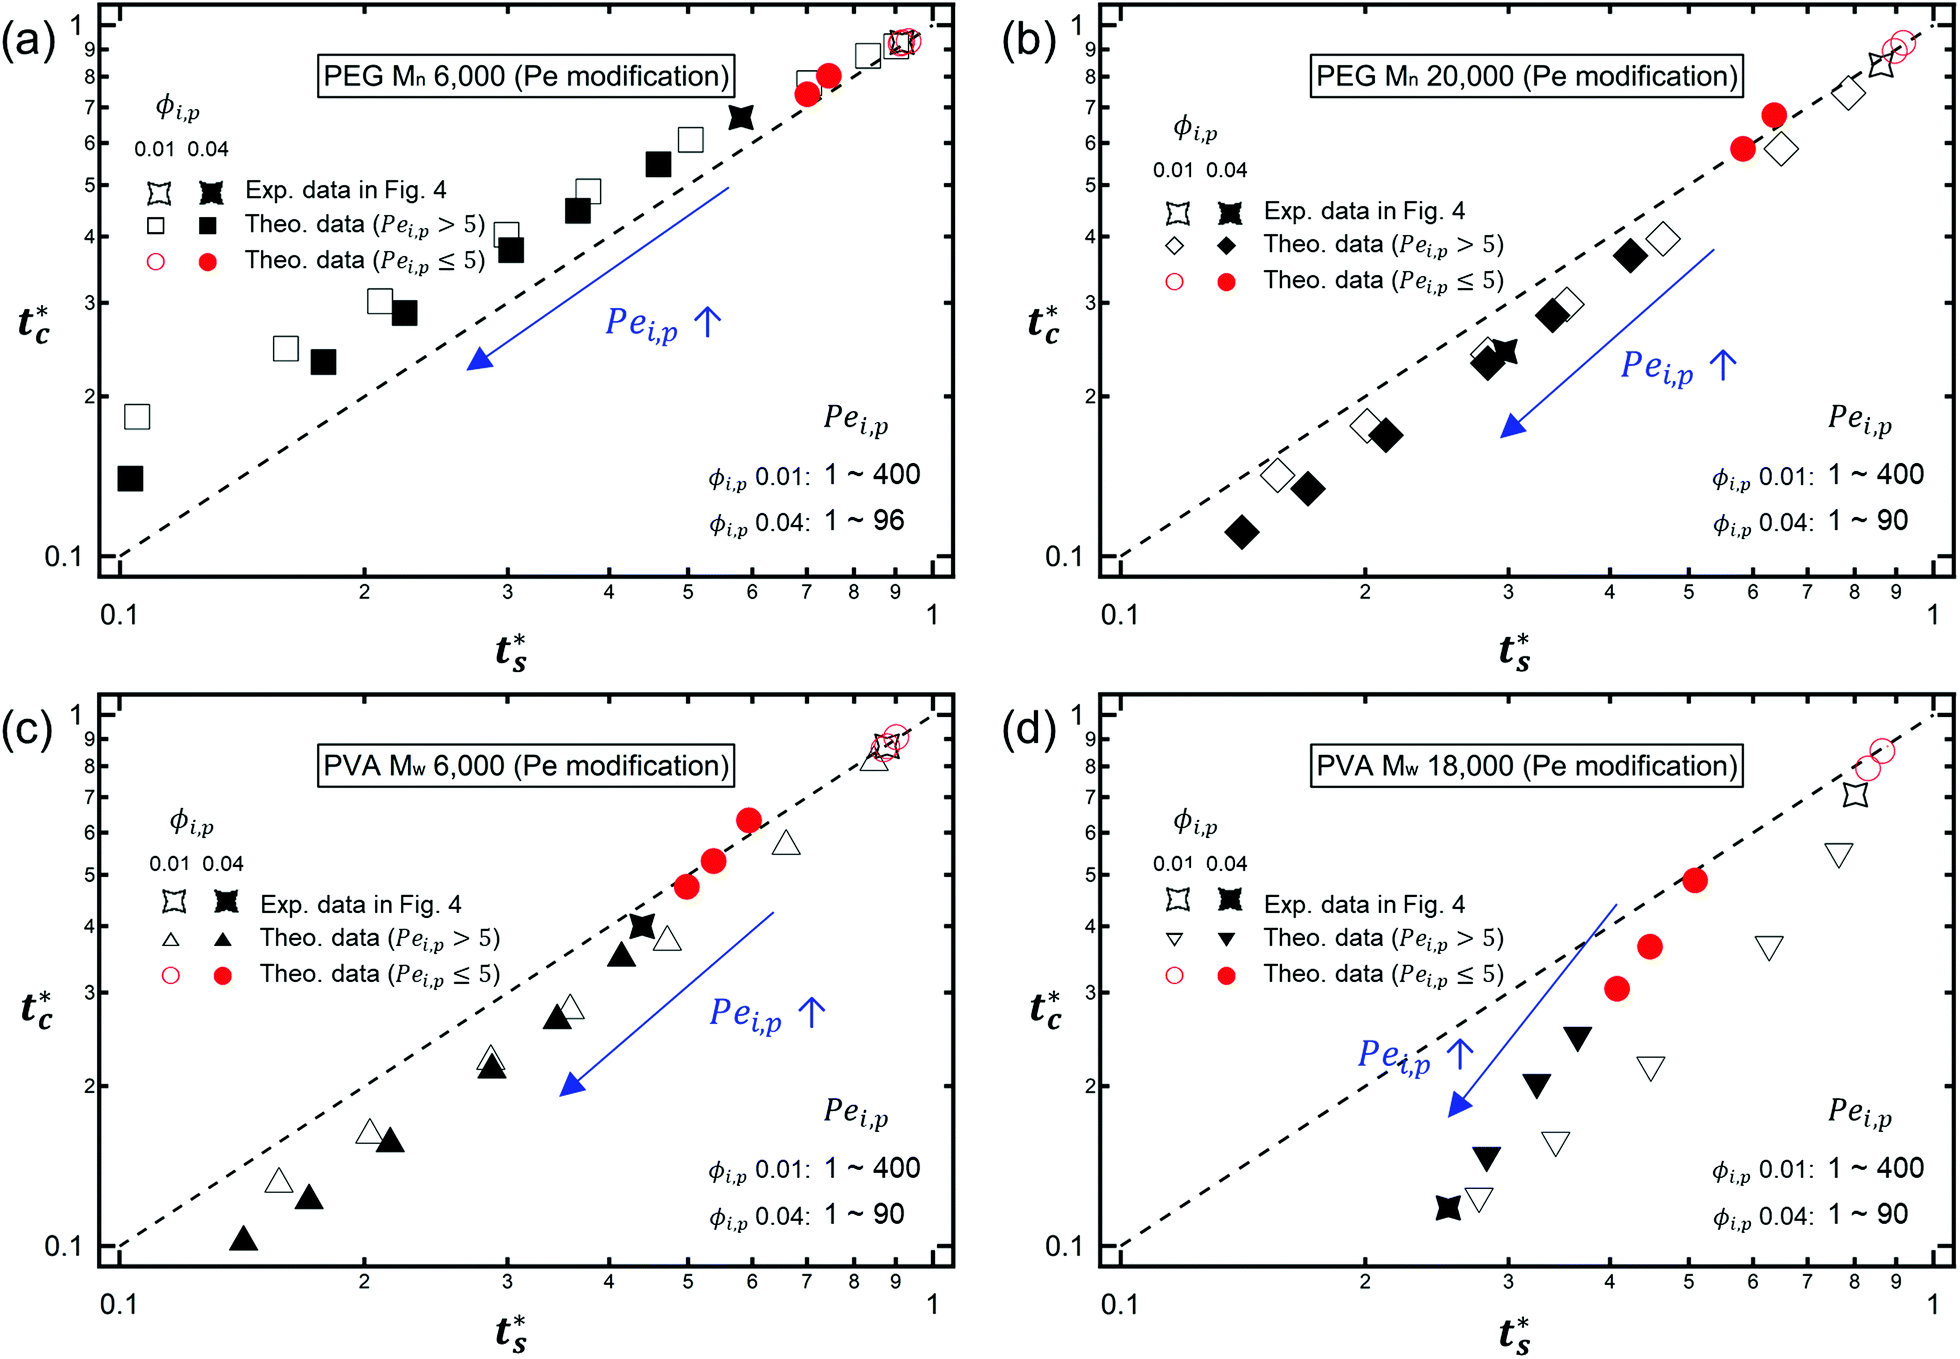
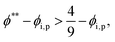
It is interesting to note that the predicted stratification of the polymer–colloid mixtures does not depend on the drying rate vev, or Pe, as long as Pe ≫ 1. This tendency can also be seen in Fig. 6, which shows the theoretical predictions of the 8 systems above, with vev values changed. Ignoring the data points of Pei,p ≤ 5, which fail to follow the aforementioned assumption that Pe ≫ 1, all the other points belong to the same regime once the polymer type and initial volume fraction are determined. This is quite plausible since the increase in polymer concentration near the drying interface accelerates both tc* and ts* in a similar order. Thus, it might be hard to create stratified layers in polymer–colloid mixtures only by varying the evaporation rate vev, or Pe. Altering other properties that can increase tc*/ts* to larger than 1, such as utilizing the interfacial activity of the polymer [PVA Mw 6000 ϕi,p 0.04 in Fig. 1(c) and 4] or the gravitational velocity from the density difference shown in Fig. S7 (ESI†), could be another solution to achieve stratified layers in polymer–colloid mixtures.
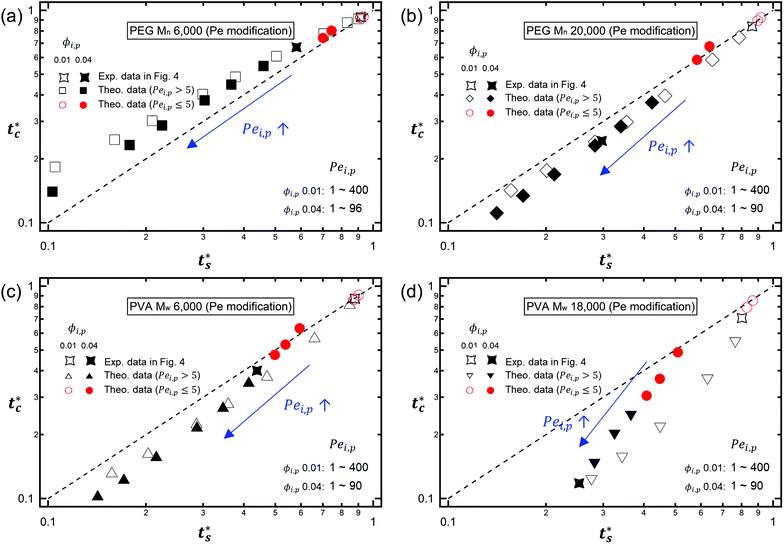 |
| | Fig. 6 Theoretical prediction of the stratification of 8 different systems on the (ts*, tc*) plane with controlled vev (or Pei,p): (a) PEG Mn 6000, (b) PEG Mn 20000, (c) PVA Mw 6000, and (d) PVA Mw 18000. As Pei,p increases, both ts* and tc* decrease and data points go to the left bottom side on the (ts*, tc*) plane. Regardless of the polymer type or molecular weight, most of the data points belong in the same regime once the type of polymer and initial volume fraction are determined except the relatively slow drying rate (Pei,p ≤ 5, red circles). | |
Our experimental and modelling studies on polymer–colloid stratification show different results to the previous simulation study by Cheng and Grest,42 which demonstrated the kinetic arresting of nanoparticles in the polymer-enriched surface layer with strong polymer–nanoparticle interactions. The difference might come from the size ratio of polymer and colloid. In our studies, we chose systems having size ratios of Rcolloid/Rpolymer of 150 and 70. Stratification can occur in the systems having a size ratio of 150 while it cannot occur in the systems having a size ratio of 70 since tc*/ts* becomes smaller than 1 as the size ratio decreases. This implies that a non-stratified layer would be observed if the size ratio decreased to 5 as in the work of Cheng and Grest.42
In addition, in several simulation studies,43,44 it was shown that the stratification phenomena could be controlled by changing the drying rate vev, or Pe, in binary colloidal mixtures. This discrepancy may come from the differences in fundamental characteristics between polymer and colloid. However, all of the stratification results in polymer–colloid mixtures that can be predicted by our modified model shown in Fig. 6 were not confirmed experimentally. Our modified model is very simple with several assumptions. These assumptions and simplicity might be another cause of the inconsistent results between binary colloids and polymer–colloid mixtures in controlling stratification by changing the drying rate vev or Pe. There might be some missing points in our simplified model, which could be clarified by further studies.
3. Conclusion
In summary, we demonstrated that dynamic stratification of polymer–colloid mixtures can be achieved by controlling viscosity near the drying interface, which results from increasing polymer concentration. When the polymer–colloid solution evaporates, the polymer starts to increase in solution viscosity near the air/water interface within a relatively very short time, unlike colloidal suspensions. Since the transition in viscosity due to the polymer can cause the kinetic arrest of colloidal particles, which hinders the diffusiophoretic downward motion of colloids, stratified layers are only observed if the formation of a stratified layer precedes the transition in viscosity near the liquid/air interfaces.
Our model calculations for tc* and ts*, inspired by a previous study,24 show that the segregation of polymer–colloid mixtures can only occur under the condition of tc*/ts* > 1, unless the solute fraction of the polymer is sufficiently low. The requirement for stratification, tc*/ts* > 1, implies that the stratification of polymer–colloid mixtures may not rely on the drying rate if Pe ≫ 1, since both tc* and ts* vary in a similar order as vev changes. Our model calculations are further supported by the consistency between the model prediction and final experimental film morphologies.
In other words, for the stratified layers in polymer–colloid mixtures, a polymer volume fraction that is not too low is necessary. If the polymer volume fraction is too low, it takes a fairly long time to create a sufficiently high concentration gradient of polymer that can induce diffusiophoretic motion of colloidal particles in the drying solution. In addition, both Pep and ϕ** should be sufficiently high to achieve a stratified layer in drying polymer–colloid mixtures. For a large Pep, the evaporation rate should be fast or the polymer size should be large at the constant initial film height. However, since a larger molecular weight of polymer leads to a lower ϕ**, it is better to use a lower molecular weight of polymer and fast evaporation rate to satisfy larger values in both Pep and ϕ**, which are the prerequisites for stratification in polymer–colloid mixtures.
In more general terms, the consistent results of the experiments and model prediction may shed light on methods of controlling surface enrichment in general solution–cast polymer composites. The ability to predict morphology in a simple nonequilibrium solvent evaporation process is highly desirable for preparing materials whose surface properties are crucial to performance, such as antireflective or organic photovoltaics. Our insights on how polymer concentration affects colloidal dynamics and stratification can be exploited to control segregated layers in solution-cast polymer–colloid mixtures.
Conflicts of interest
There are no conflicts to declare.
Acknowledgements
This work was supported by the Basic Science Research Program through the National Research Foundation of Korea (Grants NRF-2015R1C1A1A01054180, and NRF-2019R1F1A1059587).
Notes and references
- H. M. van der Kooij and J. Sprakel, Soft Matter, 2015, 11, 6353 RSC.
- A. Beaugendre, S. Degoutin, S. Bellayer, C. Pierlot, S. Du-quesne, M. Casetta and M. Jimenez, Prog. Org. Coat., 2017, 110, 210 CrossRef CAS.
- J. C. Padget, J. Coat. Technol., 1994, 66, 89 CAS.
- A. G. Márquez, T. Hidalgo, H. Lana, D. Cunha, M. J. Blanco-Prieto, C. Álvarez-Lorenzo, C. Boissiére, C. Sánchez, C. Serre and P. Horcajada, J. Mater. Chem. B, 2016, 4, 7031 RSC.
- S. A. Wissing and R. H. Müller, Int. J. Cosmet. Sci., 2001, 23, 233 CrossRef CAS.
- M. Moniruzzaman and K. I. Winey, Macromolecules, 2006, 39, 5194 CrossRef CAS.
- B. J. Anderson and C. F. Zukoski, Macromolecules, 2008, 41, 9326 CrossRef CAS.
- B. J. Anderson and C. F. Zukoski, Macromolecules, 2009, 42, 8370 CrossRef CAS.
- J. Jancar, J. F. Douglas, F. W. Starr, S. K. Kumar, P. Cas-sagnau, A. J. Lesser, S. S. Sternstein and M. J. Buehler, Polymer, 2010, 51, 3321 CrossRef CAS.
- P. Cassagnau, Polymer, 2008, 49, 2183 CrossRef CAS.
- S. K. Kumar, V. Ganesan and R. A. Riggleman, J. Chem. Phys., 2017, 147, 020901 CrossRef.
- N. Jouault, D. Zhao and S. K. Kumar, Macromolecules, 2014, 47, 5246 CrossRef CAS.
- D. M. Yebra, S. Kiil and K. Dam-Johansen, Prog. Org. Coat., 2004, 50, 75 CrossRef CAS.
- I. Banerjee, R. C. Pangule and R. S. Kane, Adv. Mater., 2011, 23, 690 CrossRef CAS.
- J. J. van Franeker, D. Westhoff, M. Turbiez, M. M. Wienk, V. Schmidt and R. A. J. Janssen, Adv. Funct. Mater., 2015, 25, 855 CrossRef CAS.
- R. S. Krishnan, M. E. Mackay, P. M. Duxbury, A. Pastor, C. J. Hawker, B. V. Horn, S. Asokan and M. S. Wong, Nano Lett., 2006, 7, 484 CrossRef.
- Q. Wei, T. Nishizawa, K. Tajima and K. Hashimoto, Adv. Mater., 2008, 20, 2211 CrossRef CAS.
- E. S. McGarrity, A. L. Frischknecht and M. E. Mackay, J. Chem. Phys., 2008, 128, 154904 CrossRef CAS.
- R. D. Deegan, O. Bakajin, T. F. Dupont, G. Huber, S. R. Nagel and T. A. Witten, Nature, 1997, 389, 827 CrossRef CAS.
- R. Brown, Philos. Mag., 1828, 4, 161 CrossRef.
- M. P. Howard, A. Nikoubashman and A. Z. Panagiotopoulos, Langmuir, 2017, 33, 3685 CrossRef CAS.
- A. Fortini, I. Martín-Fabiani, J. L. De La Haye, P.-Y. Dugas, M. Lansalot, F. D’Agosto, E. Bourgeat-Lami, J. L. Keddie and R. P. Sear, Phys. Rev. Lett., 2016, 116, 118301 CrossRef.
- J. Zhou, Y. Jiang and M. Doi, Phys. Rev. Lett., 2017, 118, 108002 CrossRef.
- R. P. Sear and P. B. Warren, Phys. Rev. E, 2017, 96, 62602 CrossRef.
- M. P. Howard, A. Nikoubashman and A. Z. Panagiotopoulos, Langmuir, 2017, 33, 11390 CrossRef CAS.
- P. J. Flory and T. G. J. Fox, J. Am. Chem. Soc., 1951, 73, 1909 CrossRef.
- S. Matsuoka and M. K. Cowman, Polymer, 2002, 43, 3447 CrossRef CAS.
-
P.-G. de Gennes, Scaling Concepts in Polymer Physics, Cornell University Press, New York, 1979 Search PubMed.
- R. H. Colby, Rheol. Acta, 2010, 49, 425 CrossRef CAS.
- Y. Takahashi, Y. Isono, I. Noda and M. Nagasawa, Macromolecules, 1985, 18, 1002 CrossRef CAS.
- W. W. Graessley, Polymer, 1980, 21, 258 CrossRef CAS.
- I. M. Krieger and T. J. Dougherty, Trans. Soc. Rheol., 1959, 3, 137 CAS.
- D. Langevin and F. Rondelez, Polymer, 1978, 19, 875 CrossRef CAS.
- C.-Y. Chou, B. C. Eng and M. Robert, J. Chem. Phys., 2006, 124, 044902 CrossRef.
- R. P. Sear, J. Chem. Phys., 2018, 148, 134909 CrossRef.
- A. I. Fedorchenko and A. A. Chernov, Int. J. Heat Mass Transfer, 2003, 46, 915 CrossRef CAS.
- J. L. Anderson, M. E. Lowell and D. C. Prieve, J. Fluid Mech., 1982, 117, 107 CrossRef CAS.
- J. L. Anderson, Annu. Rev. Fluid Mech., 1989, 21, 61 CrossRef.
- T. Okuzono, K. Ozawa and M. Doi, Phys. Rev. Lett., 2006, 97, 136103 CrossRef.
-
M. Rubinstein and R. H. Colby, In Polymer Physics, Oxford University Press, New York, 2003 Search PubMed.
- Y. Tang, G. S. Grest and S. Cheng, Langmuir, 2018, 34, 7161 CrossRef CAS.
- S. Cheng and G. S. Grest, ACS Macro Lett., 2016, 5, 694 CrossRef CAS.
- R. Tatsumi, T. Iwao, O. Koike, Y. Yamaguchi and Y. Tsuji, Appl. Phys. Lett., 2018, 112, 053702 CrossRef.
- Y. Tang, G. S. Grests and S. Cheng, J. Chem. Phys., 2019, 150, 224901 CrossRef.
Footnote |
| † Electronic supplementary information (ESI) available. See DOI: 10.1039/d0sm01504k |
|
| This journal is © The Royal Society of Chemistry 2020 |

 and
Siyoung Q.
Choi
and
Siyoung Q.
Choi