Hybrid GMP–polyamine hydrogels as new biocompatible materials for drug encapsulation†
Alberto
Lopera
*a,
Juan A.
Aguilar
 b,
Raquel
Belda
b,
Begoña
Verdejo
b,
Raquel
Belda
b,
Begoña
Verdejo
 a,
Jonathan W.
Steed
 *b and
Enrique
García-España
 *a
*a
aDepartamento de Química Inorgánica, Instituto de Ciencia Molecular, Universidad de Valencia, Calle Catedrático José Beltrán 2, 46980 Paterna, Valencia, Spain. E-mail: alberto.lopera@uv.es; enrique.garcia-es@uv.es
bDepartment of Chemistry, Durham University, South Road, DH1 3LE Durham, UK. E-mail: jon.steed@durham.ac.uk
First published on 10th June 2020
Abstract
Here we present the preparation and characterization of new biocompatible materials for drug encapsulation. These new gels are based on positively charged [1+1] 1H-pyrazole-based azamacrocycles which minimise the electrostatic repulsions between the negatively charged GMP molecules. Rheological measurements confirm the electroneutral hydrogel structure as the most stable for all the GMP–polyamine systems. Nuclear magnetic resonance (NMR) was employed to investigate the kinetics of the hydrogel formation and cryo-scanning electron microscopy (cryo-SEM) was used to obtain information about the hydrogel morphology, which exhibited a non-homogeneous structure with a high degree of cross-linking. It is possible to introduce isoniazid, which is the most employed antibiotic for tuberculosis treatment, into the hydrogels without disrupting the hydrogel structure at appropriate concentrations for oral administration.
Introduction
As early as in 1920 the Norwegian physicist and chemist I. C. Bang reported that aqueous solutions of guanylic acid could give rise to hydrogel formation under certain circumstances.1 Half a century later, the molecular biologist N. Gellert in a collaborative work with M. Lipsett and D. Davies determined by X-ray diffraction that the structure of these hydrogels was composed of helical aggregates with tetrameric structures stacked one upon the other.2 It is now known that relatively concentrated aqueous solutions of 5′-guanosine monophosphate (GMP) give rise to hydrogels made by the stacking of tetrads in which four guanine units self-assemble in a square, planar arrangement through a network of Hoogsteen-type hydrogen bonds giving rise to G-quadruplexes.3 The central hole on the structure is occupied by metal ions, typically Na+ or K+, which counterbalance the electrostatic repulsions binding to the guanine oxygen atoms.4 G-quartet structures also form in genomic guanine-rich DNA and RNA regions, particularly, in telomeres. The telomere length is critical to determine the cell survival. Each cell division shortens the telomere ends by 50–100 base pairs until a critical length is reached inducing senescence and apoptosis.5 While healthy somatic cells show low telomerase activity, tumour cells show high telomerase activity which contributes to cell inmortality.6 Since it is known that G-quadruplex structures inhibit telomerase activity, the preparation of compounds that stabilise these structures may be a route for therapeutic intervention.7Recently, low molecular weight gelators (LMWGs) have attracted much attention due to their potential applications in areas such as new sensor devices,8 catalysis,9 design of biocompatible materials for drug transport and release,10 and bioengineering.11 LWMGs can typically comprise molecules with a molecular weight below 3000 g mol−1 that are able to form supramolecular gels at low concentrations either in water or in non-aqueous solvents.12
Among the many applications, the development of biocompatible materials for drug transport and release represents a promising route to solving problems such as those related to drug bioavailability and/or solubility. Previously, several strategies have been put forward using liposomes, micelles or polymeric materials as carriers. Notwithstanding, supramolecular hydrogels have emerged recently as promising alternatives to those carriers. To be useful in this context hydrogels should exhibit, in addition to mechanical resistance, chemical stability and resistance to enzymatic degradation.13 In this respect, guanine-based hydrogels have good potential as biocompatible materials for drug delivery.14 The weak and reversible nature of the non-covalent forces governing guanine hydrogel formation makes them tuneable materials under different external stimuli. Moreover, such hydrogels can be readily prepared and, from an economical point of view, they are often rather inexpensive materials.
While aqueous GMP solutions can self-assemble to biocompatible G-quartet-based hydrogels, electrostatic repulsions between the GMP phosphate groups disfavour the self-assembly process making the use of large GMP concentrations and low temperatures necessary.15 To avoid this drawback and stabilise the gel, some authors have used modified guanines in which the phosphate group has been replaced by other less charged moieties. However, this strategy can result in less water-soluble or more toxic materials, which can make them unsuitable from a biological point of view. Another alternative may be the use of cationic species. Alkali metal ions as Na+ or K+ might be a good option from biological and economical points of view, however, these simple cations interact with phosphates weekly.16 Therefore, the use of polycationic proteins, lipids or sugars might be a more appropriate option. Although cationic proteins such as protamine are very efficient in reducing the electrostatic repulsions between the phosphate groups of nucleic acids, they are expensive and can give rise to immunogenicity.17 Polycationic lipids have also been used in gene therapy and do not seem to induce an immune response, although they can develop toxicity issues.
In a previous study we adopted a strategy based on the use of protonated polyamines to induce GMP gelation.18 Polyamines have remarkable affinity for phosphate groups16c,19 that depends not only on the charge but also on the charge distribution in the molecule. Moreover, even though polyamines might be toxic, there are a number of them that exist within cells in large amounts playing key biological roles.20 In this respect we showed that among the polyamines tested, the macrocyclic ones are more efficient gelators than the acyclic ones. Moreover, the incorporation of additional hydrogen bonding donor and/or acceptor groups may give rise to new self-assembling features. Within this context we considered that 1H-pyrazole,21 which can behave simultaneously as a hydrogen bonding donor through its pyrrolic nitrogen and as a hydrogen bond acceptor through its imine nitrogen, might be an interesting component of polyamines to tune the gelation process.
Here, we examine the gelation capacity of five 1H-pyrazole [1+1] condensation macrocycles containing different tetra- and hexamine bridges. We study their behaviour as gelators with a variety of experimental techniques. Finally, we examine the ability of one of these ligands to encapsulate isoniazid, the most employed antibiotic in the treatment of tuberculosis.
Results and discussion
Acid–base behaviour
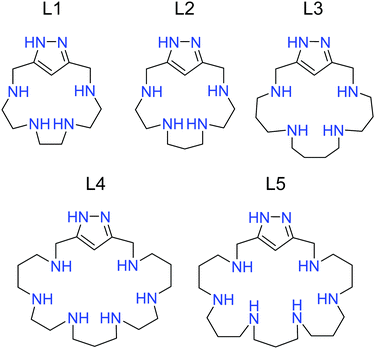
Since most of the studies presented here were performed in aqueous media, it was necessary to consider the acid–base properties of the polyamines L1–L5 (Fig. 1) employed as gelators.The protonation constants of L1–L5 were obtained from potentiometric titrations using the HYPERQUAD22 set of programs (Table 1). The distribution diagrams were calculated using the HySS software.23 The data are presented in Table 1 and in the Electronic Supplementary Information (Fig. S1–S5, ESI†).
| Reaction | L1 | L2 | L3 | L4 | L5 |
|---|---|---|---|---|---|
a Charges omitted.
b Values in parenthesis show the standard deviation in the last significant figure.
c Taken from ref. 24.
d Calculated as  . .
|
|||||
| L + H ⇆ HLa | 9.15(2)bc | 9.77(2)c | 10.52(1)c | 10.06(1) | 10.72(1) |
| HL + H ⇆ H2L | 8.10(2) | 8.19(2) | 9.46(1) | 9.24(1) | 9.80(1) |
| H2L + H ⇆ H3L | 4.84(3) | 5.19(3) | 6.76(1) | 8.09(1) | 8.63(1) |
| H3L + H ⇆ H4L | 2.65(3) | 3.71(3) | 5.87(1) | 6.50(1) | 7.46(1) |
| H4L + H ⇆ H5L | — | — | — | 5.41(1) | 6.90(1) |
| H5L + H ⇆ H6L | — | — | — | 4.42(1) | 6.02(1) |
Log![[thin space (1/6-em)]](https://www.rsc.org/images/entities/char_2009.gif) βd βd |
24.74(3) | 26.86(3) | 32.61(1) | 43.72(1) | 49.53(1) |
As shown in Table 1, all the compounds exhibit the same number of protonation processes as the number of secondary amines in their structures. While L1–L3 have four measurable protonation steps, L4–L5 can bind up to six protons. As already discussed for other [1+1] condensation aza-cyclophanes containing either pyridine or for the only one reported with a pyrazole spacer, no protonation is observed for the nitrogen atoms of the heterocycle in the pH range available for deriving accurate data from potentiometric measurements (pH 2.0–11.0).25 The accumulation of positive charges in the macrocycles due to the protonation of the more basic secondary amines likely prevents the protonation of the less basic groups of the heterocycles.
When comparing the data for the tetra-amine macrocycles, it is clear that the values of the constants follow the trend L3 > L2 > L1 for all the protonation steps. The macrocycles with longer hydrocarbon bridges between the amines are more basic because of both the increase in the inductive effect and the diminution in positive charge repulsions. It is considered that the repulsion between two positive centres separated by hydrocarbon chains diminishes markedly on going from ethylenic to propylenic chains and practically vanishes for separations by butylenic chains. Similar reasoning can explain the higher basicity of L5 compared to L4.26
An important point regarding the gelation induced by the polyamines L1–L5 is the GMP charge as well as the actual protonation degree of the polyamines at the pH selected for the studies (5.0 in this case). By means of the protonation constants in Table 1, the mean protonation degrees at pH 5.0 are 2.4, 2.7, 3.9, 4.9 and 5.9 for L1–L5, respectively. An important reduction in charge is observed when moving to the physiological pH of 7.4; at this pH, the values become 1.8, 1.9, 2.2, 2.9 and 3.7 for the same sequence of ligands. The GMP charge will be −1.1 at pH 5.0 and −1.9 at pH 7.4. Therefore, pH 5 was used as an appropriate value to facilitate the gelation process because of the lower repulsion between the GMP molecules. Moreover, in view of that many of the therapeutic applications of hydrogels involve cutaneous treatment, pH 5 is an interesting value since it is close to that of human skin.27
Interactions with GMP in aqueous solution
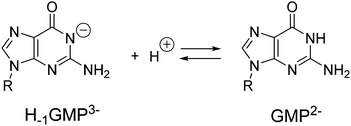
Polyamines in their protonated form have been shown to be able to form supramolecular complexes with nucleotides in aqueous solution.19a,28 Although the main driving force of this binding is likely to be based on charge attraction between the receptor and substrate, other interactions such as hydrogen bonding, π–π stacking, π–cation and van der Waals interactions may also be involved to some extent.29 Therefore, prior to the gelation studies, we analysed the ability of the polyamines L1–L5 to interact with GMP using potentiometric titration under the same conditions described for the determination of the protonation constants.In GMP, the hydrogen atom from the imidic nitrogen can be removed at alkaline pH. Hence, when calculating the acid–base behaviour of GMP we have to consider the first protonation equilibrium of the purine base which has a value of 9.45 logarithmic units (Scheme 1). The mononucleotide with the deprotonated imine will be termed H−1GMP3− throughout the text or H−1G in the tables and figures. The next two protonation steps affect the phosphate group with protonation constants of 6.30 and 2.84 logarithmic units.30
Taking into account the basicity of ligands and GMP, the cumulative stability constants obtained with the aid of HYPERQUAD22 have been decomposed into successive constants (Table S1, ESI†). As shown in Table S1 (ESI†) and in the distribution diagrams collected in the ESI† (Fig. S6–S10), all receptors form stable adducts with GMP in a wide pH range. However, among them, L1 forms the least stable adducts which can be attributed to its reduced basicity and size that may not be appropriate for binding GMP. On the other hand, the two largest receptors L4 and L5 form a higher number of very stable adducts with stoichiometries varying from the neutral [(HL)(H−1GMP)] species for L4 or [(HL)(GMP)]− for L5 to [(H6L)(HGMP)]5+. Nevertheless, since these systems present overlapped equilibria of receptors and substrates, and the decomposition of cumulative in stepwise constants is rather cumbersome, the most appropriate way to compare the relative stabilities of the different systems at the different pH values is to use effective constants. The effective constants (Keff) are calculated at every pH value as the quotient between the overall amount of complexed species (Hi+jAL) and of free receptor (HjL) and substrate (HiA) (see equation 1).31
 | (1) |
Fig. 2 plots the logarithms of the effective constant at pH 5.0 and 7.4 for the interactions of the polyamines L1–L5 with the GMP nucleotide calculated for 1![[thin space (1/6-em)]](https://www.rsc.org/images/entities/char_2009.gif) :
:![[thin space (1/6-em)]](https://www.rsc.org/images/entities/char_2009.gif) 1 GMP
1 GMP![[thin space (1/6-em)]](https://www.rsc.org/images/entities/char_2009.gif) :
:![[thin space (1/6-em)]](https://www.rsc.org/images/entities/char_2009.gif) polyamine molar ratio ([L1–L5] = [GMP] = 1.0 × 10⁻³ M). The complete plot of Keffvs. pH is shown in Fig. S11 in the ESI.† As shown in Fig. 2, L1 forms the least stable complexes with GMP at both pH values. On the other hand, the other four pyrazole-based macrocycles do not seem to differ much in spite of their different sizes and number of charges. This might be pointing out that the most important factor in the complex stability is the charge density and distribution instead of the total charge in the molecule.
polyamine molar ratio ([L1–L5] = [GMP] = 1.0 × 10⁻³ M). The complete plot of Keffvs. pH is shown in Fig. S11 in the ESI.† As shown in Fig. 2, L1 forms the least stable complexes with GMP at both pH values. On the other hand, the other four pyrazole-based macrocycles do not seem to differ much in spite of their different sizes and number of charges. This might be pointing out that the most important factor in the complex stability is the charge density and distribution instead of the total charge in the molecule.
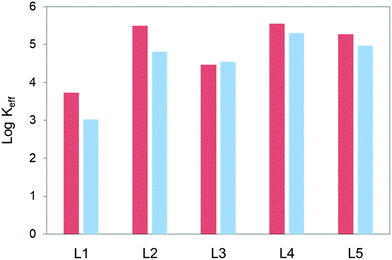 | ||
| Fig. 2 Plot of the values of the logarithms of the effective constants for the interaction of L1–L5 with GMP at pH 5.0 (red) and pH 7.4 (blue). [L1–L5] = [GMP] = 1.0 × 10⁻³ M. | ||
Another relevant aspect regarding the hydrogel formation is the percentages of adduct formation. The percentages of adducts present in solution at 1![[thin space (1/6-em)]](https://www.rsc.org/images/entities/char_2009.gif) :
:![[thin space (1/6-em)]](https://www.rsc.org/images/entities/char_2009.gif) 1 GMP
1 GMP![[thin space (1/6-em)]](https://www.rsc.org/images/entities/char_2009.gif) :
:![[thin space (1/6-em)]](https://www.rsc.org/images/entities/char_2009.gif) polyamine molar ratio ([L1–L5] = [GMP] = 1.0 × 10⁻³ M) and pH 5.0 change from over 90% for L2, L4 and L5, and 83% for L3 to 65% for L1. At pH 7.4 the percentages of complex formation for the same experimental conditions are 93% for L4, 90% for L5, 88% for L2, 85% for L3 and 40% for L1.
polyamine molar ratio ([L1–L5] = [GMP] = 1.0 × 10⁻³ M) and pH 5.0 change from over 90% for L2, L4 and L5, and 83% for L3 to 65% for L1. At pH 7.4 the percentages of complex formation for the same experimental conditions are 93% for L4, 90% for L5, 88% for L2, 85% for L3 and 40% for L1.
Rheology
As a general rule, the higher the concentration of the GMP solution, the greater the strength of the hydrogel formed. Typically, the concentration employed in the literature for GMP hydrogel preparation at room temperature is between 180 and 1000 mM. At room temperature the gel formation process is not efficient at GMP concentrations below this range. However, the use of polyamines permits GMP hydrogels to be obtained at concentrations even one order of magnitude lower than this. Furthermore, different polyamines produce different results depending on their charge and on the arrangement of the ammonium sites along their structure.18 Therefore, besides temperature, there are three main factors to consider in this study: (i) GMP concentration, (ii) pH, since it establishes the protonation state of GMP and polyamines, and (iii) the molar GMP![[thin space (1/6-em)]](https://www.rsc.org/images/entities/char_2009.gif) :
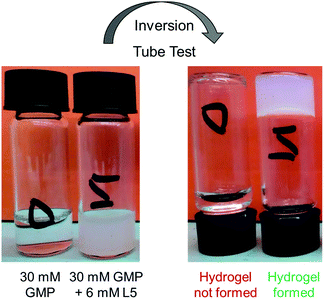
:![[thin space (1/6-em)]](https://www.rsc.org/images/entities/char_2009.gif) polyamine ratio needed to produce the hydrogels. To address the latter point, we tried different molar ratios for each GMP–polyamine system keeping the GMP concentration at 30 mM. The pH was adjusted to 5 by adding drops of concentrated HCl or NaOH. As previously noted, GMP behaves as a monoanion at this pH, and the repulsion between the GMP anions is less important than the repulsion experienced at higher pH. All samples were heated and sonicated until a transparent solution was obtained. Finally, the samples were left at room temperature overnight. Then a tube inversion test32 was carried out to evaluate the formation of the gel (see Fig. 3).
polyamine ratio needed to produce the hydrogels. To address the latter point, we tried different molar ratios for each GMP–polyamine system keeping the GMP concentration at 30 mM. The pH was adjusted to 5 by adding drops of concentrated HCl or NaOH. As previously noted, GMP behaves as a monoanion at this pH, and the repulsion between the GMP anions is less important than the repulsion experienced at higher pH. All samples were heated and sonicated until a transparent solution was obtained. Finally, the samples were left at room temperature overnight. Then a tube inversion test32 was carried out to evaluate the formation of the gel (see Fig. 3).
This simple inversion test allows us to discard combinations that do not result in gel formation (Table 2).
| Polyamine | GMP![[thin space (1/6-em)]](https://www.rsc.org/images/entities/char_2009.gif) : :![[thin space (1/6-em)]](https://www.rsc.org/images/entities/char_2009.gif) polyamine molar ratio polyamine molar ratio |
||||||||
|---|---|---|---|---|---|---|---|---|---|
3![[thin space (1/6-em)]](https://www.rsc.org/images/entities/char_2009.gif) : :![[thin space (1/6-em)]](https://www.rsc.org/images/entities/char_2009.gif) 1 1 |
4![[thin space (1/6-em)]](https://www.rsc.org/images/entities/char_2009.gif) : :![[thin space (1/6-em)]](https://www.rsc.org/images/entities/char_2009.gif) 1 1 |
5![[thin space (1/6-em)]](https://www.rsc.org/images/entities/char_2009.gif) : :![[thin space (1/6-em)]](https://www.rsc.org/images/entities/char_2009.gif) 1 1 |
6![[thin space (1/6-em)]](https://www.rsc.org/images/entities/char_2009.gif) : :![[thin space (1/6-em)]](https://www.rsc.org/images/entities/char_2009.gif) 1 1 |
8![[thin space (1/6-em)]](https://www.rsc.org/images/entities/char_2009.gif) : :![[thin space (1/6-em)]](https://www.rsc.org/images/entities/char_2009.gif) 1 1 |
10![[thin space (1/6-em)]](https://www.rsc.org/images/entities/char_2009.gif) : :![[thin space (1/6-em)]](https://www.rsc.org/images/entities/char_2009.gif) 1 1 |
15![[thin space (1/6-em)]](https://www.rsc.org/images/entities/char_2009.gif) : :![[thin space (1/6-em)]](https://www.rsc.org/images/entities/char_2009.gif) 1 1 |
30![[thin space (1/6-em)]](https://www.rsc.org/images/entities/char_2009.gif) : :![[thin space (1/6-em)]](https://www.rsc.org/images/entities/char_2009.gif) 1 1 |
50![[thin space (1/6-em)]](https://www.rsc.org/images/entities/char_2009.gif) : :![[thin space (1/6-em)]](https://www.rsc.org/images/entities/char_2009.gif) 1 1 |
|
| L1 | G | G | G | G | G | G | G | G | N |
| L2 | G | G | G | G | G | N | N | N | N |
| L3 | G | G | G | G | G | G | G | G | G |
| L4 | N | N | N | N | N | N | N | N | N |
| L5 | N | G | G | G | G | G | G | G | G |
Polyamines L4 and L5 should in principle be the best gel promoters because of their higher charge. However, surprisingly L4 did not promote gel formation at any molar ratio as shown in Table 2. In contrast, L5 promotes gel formation at every molar ratio assayed, except for the 3![[thin space (1/6-em)]](https://www.rsc.org/images/entities/char_2009.gif) :
:![[thin space (1/6-em)]](https://www.rsc.org/images/entities/char_2009.gif) 1 GMP
1 GMP![[thin space (1/6-em)]](https://www.rsc.org/images/entities/char_2009.gif) :
:![[thin space (1/6-em)]](https://www.rsc.org/images/entities/char_2009.gif) polyamine molar ratio, which is the ratio with the highest polyamine content and thereby, with the highest excess of positive charges. Repulsion between the excess positive charges of the polyamines destabilise the gel formation. Also surprising is the fact that L3 and L5 gave rise to gel formation even at the GMP
polyamine molar ratio, which is the ratio with the highest polyamine content and thereby, with the highest excess of positive charges. Repulsion between the excess positive charges of the polyamines destabilise the gel formation. Also surprising is the fact that L3 and L5 gave rise to gel formation even at the GMP![[thin space (1/6-em)]](https://www.rsc.org/images/entities/char_2009.gif) :
:![[thin space (1/6-em)]](https://www.rsc.org/images/entities/char_2009.gif) polyamine 50
polyamine 50![[thin space (1/6-em)]](https://www.rsc.org/images/entities/char_2009.gif) :
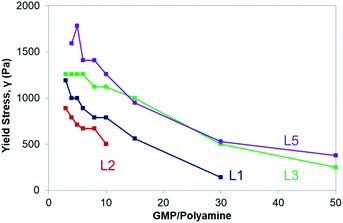
:![[thin space (1/6-em)]](https://www.rsc.org/images/entities/char_2009.gif) 1 molar ratio. This intriguing result suggests that besides net charge there are other important parameters to be taken into account to explain these processes. However, it is not possible to obtain more information from these simple inversion tests. For this reason, we characterized the hydrogels by means of rheological measurements. Gels are viscoelastic materials, showing both solid and liquid behaviour. From the rheological point of view, a material is a gel when its solid component predominates over its liquid one. The solid component is related to the storage modulus (G′) while the liquid component is related to the loss modulus (G′′). This technique also allows the determination of the maximum stress that can be applied to a material (yield stress, γ) without deforming it plastically in an irreversible way. The higher the value of γ, the stronger is the hydrogel, and consequently, the greater is the polyamine ability in promoting the GMP hydrogel formation.
1 molar ratio. This intriguing result suggests that besides net charge there are other important parameters to be taken into account to explain these processes. However, it is not possible to obtain more information from these simple inversion tests. For this reason, we characterized the hydrogels by means of rheological measurements. Gels are viscoelastic materials, showing both solid and liquid behaviour. From the rheological point of view, a material is a gel when its solid component predominates over its liquid one. The solid component is related to the storage modulus (G′) while the liquid component is related to the loss modulus (G′′). This technique also allows the determination of the maximum stress that can be applied to a material (yield stress, γ) without deforming it plastically in an irreversible way. The higher the value of γ, the stronger is the hydrogel, and consequently, the greater is the polyamine ability in promoting the GMP hydrogel formation.
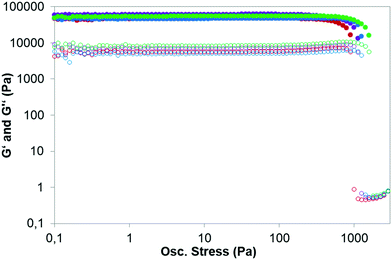
Except for the polyamine L4 that did not induce gel formation, rheological measurements confirmed the results of the tube inversion tests showing that G′ > G′′ by about one order of magnitude. The full rheological studies are presented in the ESI,† (Fig. S12–S15 and Tables S2–S5). The maximum gel strength (optimal conditions for the gelation) was always achieved when the negative charges of the GMP molecules matched the positives charges of the polyamine, implying the electroneutral structure as the most stable one (Fig. 4 and Table 3).
![[thin space (1/6-em)]](https://www.rsc.org/images/entities/char_2009.gif) :
:![[thin space (1/6-em)]](https://www.rsc.org/images/entities/char_2009.gif) polyamine optimal molar ratios for each GMP–polyamine system. G′ > G′′ confirms the material as a gel. The larger the value of γ, the stronger the gel
polyamine optimal molar ratios for each GMP–polyamine system. G′ > G′′ confirms the material as a gel. The larger the value of γ, the stronger the gel
| Polyamine | GMP![[thin space (1/6-em)]](https://www.rsc.org/images/entities/char_2009.gif) : :![[thin space (1/6-em)]](https://www.rsc.org/images/entities/char_2009.gif) polyamine molar ratio polyamine molar ratio |
G′ (Pa) | G′′ (Pa) | γ (Pa) |
|---|---|---|---|---|
| L1 | 3![[thin space (1/6-em)]](https://www.rsc.org/images/entities/char_2009.gif) : :![[thin space (1/6-em)]](https://www.rsc.org/images/entities/char_2009.gif) 1 1 |
65![[thin space (1/6-em)]](https://www.rsc.org/images/entities/char_2009.gif) 000 000 |
7300 | 1190 |
| L2 | 3![[thin space (1/6-em)]](https://www.rsc.org/images/entities/char_2009.gif) : :![[thin space (1/6-em)]](https://www.rsc.org/images/entities/char_2009.gif) 1 1 |
50![[thin space (1/6-em)]](https://www.rsc.org/images/entities/char_2009.gif) 000 000 |
6100 | 890 |
| L3 | 4![[thin space (1/6-em)]](https://www.rsc.org/images/entities/char_2009.gif) : :![[thin space (1/6-em)]](https://www.rsc.org/images/entities/char_2009.gif) 1 1 |
49![[thin space (1/6-em)]](https://www.rsc.org/images/entities/char_2009.gif) 000 000 |
5400 | 1260 |
| L5 | 5![[thin space (1/6-em)]](https://www.rsc.org/images/entities/char_2009.gif) : :![[thin space (1/6-em)]](https://www.rsc.org/images/entities/char_2009.gif) 1 1 |
60![[thin space (1/6-em)]](https://www.rsc.org/images/entities/char_2009.gif) 000 000 |
9100 | 1780 |
Table 3 lists the values of G′, G′′ and γ, obtained from the oscillatory stress sweep experiments under the optimal conditions for the gelation (shown in Fig. 4). When comparing the results presented in Table 3, polyamines L3 and L5 gave rise to the strongest hydrogels as they presented the higher values of yield stress (1260 Pa and 1780 Pa, respectively). Both compounds along with L4 are those having the largest macrocyclic cavities and highest net charges at pH 5. The fact that L4 does not form stable hydrogels is rather surprising and probably has to do with a particular network of intramolecular bonds that may alter its interaction and cross-linking with the GMP molecules.
Moreover, as seen in Fig. 5 for all the GMP–polyamine systems studied, the lower the polyamine concentration in the hydrogel, the lower is the hydrogel yield stress.
Nuclear magnetic resonance (NMR) studies
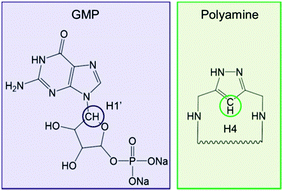
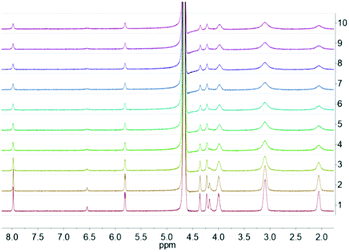
The NMR technique allows studying the liquid phase of the hydrogels by following the evolution of their 1H NMR spectra with time, giving an easy way to investigate the kinetics of the GMP–polyamine hybrid hydrogel formation. In this case we decided to monitor the H1′ signal from the GMP molecule and the H4 signal from the 1H-pyrazole ring (Fig. 6).The hydrogels were prepared employing the optimal conditions for gelation summarized in Table 3. For all the systems we observe a decrease in the integral of the 1H NMR signals over time as the gelation process proceeds which can be explained in terms of the deposition passage of both the GMP and polyamine molecules from the liquid phase to the solid phase of the hydrogel as it forms. Nevertheless, we can see different profiles when comparing the evolution of the monitored signals along with time (Fig. S16–S19, ESI†) which may indicate either different hydrogel formation mechanisms or different formation kinetics.
The kinetics for the formation of the GMP–L5 hydrogels is particularly remarkable, showing an estimate formation time of 2–3 minutes (Fig. 7), which is much faster than those for the other systems, which typically take approximately one hour for L1 and L2, and approximately two hours for L3.
Cryo-scanning electron microscopy (cryo-SEM) studies
The hydrogels presented here contain a large amount of water and cannot be directly observed using SEM without removing the water. The water can be removed to allow the use of SEM, but at the risk of distorting the solid matrix of the gel. This is somehow solved in cryo-SEM in which water is removed partly in a controlled sublimation process, and hence sample distortion due to the dehydration process is reduced, leading to a better representation of the hydrogel original structure.The hydrogels were prepared employing the optimal conditions for gelation shown in Table 3. As shown in Fig. 8, all the samples exhibit a quite similar morphology, having a non-homogeneous structure with a high cross-linking degree as we expect for a gel-like material.
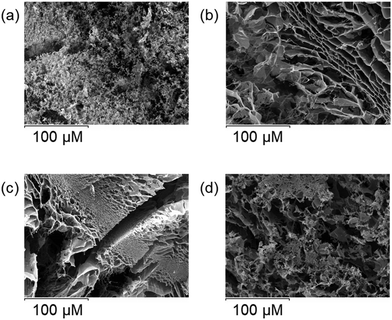 | ||
Fig. 8 Cryo-SEM images obtained for (a) GMP![[thin space (1/6-em)]](https://www.rsc.org/images/entities/char_2009.gif) : :![[thin space (1/6-em)]](https://www.rsc.org/images/entities/char_2009.gif) L1 3 L1 3![[thin space (1/6-em)]](https://www.rsc.org/images/entities/char_2009.gif) : :![[thin space (1/6-em)]](https://www.rsc.org/images/entities/char_2009.gif) 1, (b) GMP 1, (b) GMP![[thin space (1/6-em)]](https://www.rsc.org/images/entities/char_2009.gif) : :![[thin space (1/6-em)]](https://www.rsc.org/images/entities/char_2009.gif) L2 3 L2 3![[thin space (1/6-em)]](https://www.rsc.org/images/entities/char_2009.gif) : :![[thin space (1/6-em)]](https://www.rsc.org/images/entities/char_2009.gif) 1, (c) GMP 1, (c) GMP![[thin space (1/6-em)]](https://www.rsc.org/images/entities/char_2009.gif) : :![[thin space (1/6-em)]](https://www.rsc.org/images/entities/char_2009.gif) L3 4 L3 4![[thin space (1/6-em)]](https://www.rsc.org/images/entities/char_2009.gif) : :![[thin space (1/6-em)]](https://www.rsc.org/images/entities/char_2009.gif) 1 and (d) GMP 1 and (d) GMP![[thin space (1/6-em)]](https://www.rsc.org/images/entities/char_2009.gif) : :![[thin space (1/6-em)]](https://www.rsc.org/images/entities/char_2009.gif) L5 5 L5 5![[thin space (1/6-em)]](https://www.rsc.org/images/entities/char_2009.gif) : :![[thin space (1/6-em)]](https://www.rsc.org/images/entities/char_2009.gif) 1 molar ratios. 1 molar ratios. | ||
Hybrid GMP–polyamine hydrogels as new biocompatible materials
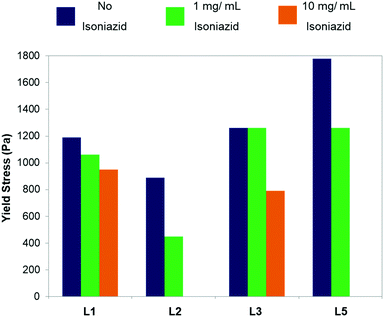
The hybrid GMP–polyamine hydrogels exhibit mechanical resistance as demonstrated by rheology and showed previously in Fig. 4 and 5 as well as in Table 3. Moreover, the dropping ball method32 indicates that these hydrogels are stable at temperatures higher than human body temperature, and exhibit gel–sol transition temperature (Tgel) values between 39 °C and 41 °C, depending on the GMP–polyamine system. These results highlight the potential of the hybrid GMP–polyamine hydrogels as biocompatible materials, as any material designed for this purpose must have both mechanical resistance and thermal stability. Encouraged by these results, we decided to add a drug to these gels. Many drugs can be used depending on the intended application; here we have decided to use the antibiotic isoniazid, which is an antibiotic widely used for the treatment of tuberculosis, as a preliminary test.We studied the effect of adding different amounts of isoniazid on the hydrogel yield stress value (Fig. S20–S23 and Tables S6–S9, ESI†). It was possible to introduce 1 mg of isoniazid in all the systems without disrupting the hydrogel structure. Furthermore, we were able to introduce 10 mg of isoniazid for the GMP–L1 and GMP–L3 systems, which is the normal dose of isoniazid when given orally. However, the higher the concentration of isoniazid, the lower is the resistance of the hydrogel (Fig. 9).
Experimental
Synthesis of L1–L3
The synthesis of L1–L3 was performed as described in ref. 24. The compounds gave satisfactory elemental microanalysis and spectroscopic characterization (see spectra in the ESI†).Synthesis of L4 and L5
The pyrazole precursor 3,5-bis-(chloromethyl)-1-(tetrahydropyr-ane-2-yl)-pyrazole was obtained as previously described in ref. 24. The polyamine precursors 1,5,8,12,15,19-hexaquis-(p-tolylsulfonyl)-1,5,8,12,15,19-hexaazanonadecane and 1,5,9,13,17,21-hexaquis-(p-tolylsulfonyl)-1,5,9,13,17,21-hexaazaheneicosane were prepared as reported in ref. 33 and 34, respectively.Nuclear magnetic resonance measurements
The 1H and 13C NMR spectra of compounds L4 and L5 were recorded on a Bruker Advance DPX 300 MHz and a Bruker Advance DPX 400 MHz spectrometer operating at 299.95 MHz and 399.95 MHz for 1H and at 75.43 MHz and 100.58 MHz for 13C. The chemical shifts are given in parts per million referenced to the solvent signal. tert-Butyl alcohol was used as a reference standard (δ = 1.24 ppm for 1H and δ = 70.36 ppm for 13C).35Mass spectrometry measurements
The mass spectra of water solutions of compounds L4 and L5 (5.0 × 10⁻⁴ M) were acquired in the positive ion mode using an ESQUIRE 3000 PLUS Ion Trap Mass Spectrometer attached to an AGILENT 1100 (HPLC-MS) high-performance liquid chromatograph. The equipment has an atmospheric-pressure chemical ionisation (APCI) source and an electrospray ionisation (ESI) source.Electromotive force measurements
The potentiometric titrations were carried out in water at 298.1 ± 0.1 K using 0.15 M NaCl as the supporting electrolyte. NaCl was chosen as the electrolyte because of (i) the high solubility of the receptor in this medium and (ii) the content of this salt in the extracellular matrix as well as its role in some biological relevant processes.36 The experimental procedure (burette, potentiometer, cell, stirrer, microcomputer, etc.) has been fully described elsewhere.37 The data were obtained by using the computer program PASAT.38 The reference electrode was an Ag/AgCl electrode in saturated KCl solution. The glass electrode was calibrated as a hydrogen ion concentration probe by titration of previously standardized amounts of HCl with CO2−-free NaOH solutions. The equivalent point was determined by Gran's method,39 which gives the standard potential (E0′) and the ionic product of water (pkw = 13.73(1)) in pure water. The computer program HYPERQUAD22 was used to calculate the protonation and stability constants and the HySS23 program was used to obtain the distribution diagrams. The pH range investigated was 2.0–11.0.Hydrogel preparation
The GMP–polyamine hybrid hydrogels were prepared by weighing the appropriate amount of the hydrochloride/bromide salt of the polyamine in a vial and adding 1 mL of water solution of 30 mM guanosine-5′-monophosphate disodium salt. Then the pH was adjusted to 5 by adding drops of concentrated HCl and/or NaOH. Then the resulting mixture was heated and sonicated and was left at room temperature overnight. Hydrogels having isoniazid were prepared as described, employing the optimal conditions for gelation for each system but adding the appropriate amount of isoniazid to the system before heating and sonicating the mixture.Rheology
Rheological measurements were carried out using a TA instrument Advanced Rheometer 2000. A parallel-rough-plate geometry (25 mm) was employed with a gap of 1000 μm. The samples were prepared by adding 1 mL of the melted hydrogel in a 25 mm cylindrical block leaving them to set for 25 minutes to allow the hydrogel formation at 10 °C.Oscillatory stress sweep experiments were performed over a 0.1–10![[thin space (1/6-em)]](https://www.rsc.org/images/entities/char_2009.gif) 000 Pa range with a constant frequency of 1 Hz. The rheometer was controlled by the Rheology Advance Instrument control programme (v 5.8.2) and the analysis of the data was performed using the Rheology Advance Data Analysis programme (v 5.7.0).
000 Pa range with a constant frequency of 1 Hz. The rheometer was controlled by the Rheology Advance Instrument control programme (v 5.8.2) and the analysis of the data was performed using the Rheology Advance Data Analysis programme (v 5.7.0).
Cryo-scanning electron microscopy (cryo-SEM) studies
Samples for cryo-SEM must be dry and conductive. Furthermore, the drying process must be carried out preserving the original structure of the sample as much as possible. With this aim we used the cryo-fixation method, cooling the sample as fast as possible by employing liquid nitrogen. Subsequently, the sample was transferred to the cryo-observation system, where it was treated and coated with gold for later observation. SEM images were obtained using a JEOL scanning electron microscope model JSM 5410.Nuclear magnetic resonance (NMR) studies
Kinetic studies were performed using a Varian Inova-500 NMR spectrometer operating at a frequency of 500.13 MHz for 1H NMR. Hydrogels were prepared in D2O as described previously employing the optimal conditions of gelation for each GMP-polyamine system deduced by means of rheology. The pD was adjusted by adding concentrated DCl and/or NaOD to the mixture. The pD values were measured using a pH meter calibrated with proteo standards. A correction factor of +0.4 units was applied to account for the fact that the calibration used proteo standards instead of deuterium ones. pD = reading + 0.4.40Dropping ball method
The dropping ball method32 was used to determine the gel–sol transition temperature (Tgel). The methodology consisted of placing a 261.1 mg metal ball on the surface of the hydrogel and increasing the temperature gradually 1.0 °C per minute. The temperature at which the dropping of the metal ball through the hydrogel is observed is considered as the gel–sol transition temperature.Conclusions
We have shown that the pyrazole-based polyamines tested, with the exception of L4, significantly facilitate GMP gel formation by reducing unfavourable electrostatic repulsion. In the case of L3 and L5 considerable enhancements in gelation efficiency are obtained even at a 50![[thin space (1/6-em)]](https://www.rsc.org/images/entities/char_2009.gif) :
:![[thin space (1/6-em)]](https://www.rsc.org/images/entities/char_2009.gif) 1 GMP
1 GMP![[thin space (1/6-em)]](https://www.rsc.org/images/entities/char_2009.gif) :
:![[thin space (1/6-em)]](https://www.rsc.org/images/entities/char_2009.gif) polyamine ratio. The fact that a considerable difference in gel formation efficiency is observed when slightly different polyamines are used suggests that the structure and nature of the polyamine are factors that need to be considered in addition to the electrostatic effect. Macrocycle L5 also results in considerably enhanced gelation kinetics. Gels were optimised at pH 5.0 consistent with human skin pH and probed to be able to tolerate a therapeutically meaningful amount of a model drug substance. These factors, coupled with a gel–sol transition temperature above body temperature, mean that these systems exhibit promise for topical delivery of active pharmaceutical ingredients. Further studies are necessary to establish which drugs are compatible with these gels, to check that the polyamines used in the study do not develop any toxicity at the concentrations employed, and in which scenarios these gels could be used for medical applications.
polyamine ratio. The fact that a considerable difference in gel formation efficiency is observed when slightly different polyamines are used suggests that the structure and nature of the polyamine are factors that need to be considered in addition to the electrostatic effect. Macrocycle L5 also results in considerably enhanced gelation kinetics. Gels were optimised at pH 5.0 consistent with human skin pH and probed to be able to tolerate a therapeutically meaningful amount of a model drug substance. These factors, coupled with a gel–sol transition temperature above body temperature, mean that these systems exhibit promise for topical delivery of active pharmaceutical ingredients. Further studies are necessary to establish which drugs are compatible with these gels, to check that the polyamines used in the study do not develop any toxicity at the concentrations employed, and in which scenarios these gels could be used for medical applications.
Conflicts of interest
There are no conflicts to declare.Acknowledgements
This work was supported by Spanish MICINN and MEC and FEDER funds from the European Union (grants CTQ2016-78499-C6-1-R, CTQ2017-90852-REDC, Unidad de Excelencia María de Maeztu MDM-15-0538), Generalitat Valenciana (PROMETEO II 2015-002). A. L. would like to thank Generalitat Valenciana for his VALI+D PhD grant. European Commission is acknowledged for COST ACTION NECTAR CA18202.References
- I. C. Bang, Biochem. Z., 1910, 26, 293–311 CAS.
- M. F. Gellert, M. N. Lipsett and D. R. Davies, Proc. Natl. Acad. Sci. U. S. A., 1962, 48, 2013–2018 CrossRef CAS PubMed.
- (a) S. Neidle and S. Balasubramanian, Quadruplex Nucleic Acids, Royal Society of Chemistry, Cambridge, 2006 RSC; (b) J. L. Huppert, Biochimie, 2008, 90, 1140–1148 CrossRef CAS PubMed.
- (a) V. Sasisekharan, S. Zimmerman and D. R. Davies, J. Mol. Biol., 1975, 92, 171–179 CrossRef CAS PubMed; (b) S. B. Zimmerman, J. Mol. Biol., 1976, 106, 663–672 CrossRef CAS PubMed; (c) J. T. Davis, Angew. Chem., Int. Ed., 2004, 43, 668–698 CrossRef CAS PubMed.
- (a) E. H. Blackburn, Nature, 1991, 350, 569–573 CrossRef CAS PubMed; (b) S. Neidle and G. N. Parkinson, Curr. Opin. Struct. Biol., 2003, 13, 275–283 CrossRef CAS PubMed; (c) T. Ou, Y. Lu, J. Tan, Z. Huang, K.-Y. Wong and L. Gu, ChemMedChem, 2008, 3, 690–713 CrossRef CAS PubMed.
- (a) N. Kim, M. Piatyszek, K. Prowse, C. Harley, M. West, P. Ho, G. Coviello, W. Wright, S. Weinrich and J. Shay, Science, 1994, 266, 2011–2015 CrossRef CAS PubMed; (b) J. W. Shay and S. Bacchetti, Eur. J. Cancer, 1997, 33, 787–791 CrossRef CAS PubMed.
- (a) L. H. Hurley, R. T. Wheelhouse, D. Sun, S. M. Kerwin, M. Salazar, O. Yu. Fedoroff, F. X. Han, H. Han, E. Izbicka and D. D. Von Hoff, Pharmacol. Ther., 2000, 85, 141–158 CrossRef CAS PubMed; (b) D. Monchaud and M.-P. Teulade-Fichou, Org. Biomol. Chem., 2008, 6, 627–636 RSC; (c) G. W. Collie and G. N. Parkinson, Chem. Soc. Rev., 2011, 40, 5867–5892 RSC.
- (a) R. Yoshida, K. Uchida, Y. Kaneko, K. Sakai, A. Kikuchi, Y. Sakurai and T. Okano, Nature, 1995, 374, 240–242 CrossRef CAS; (b) S. C. Bremmer, J. Chen, A. J. McNeil and M. B. Soellner, Chem. Commun., 2012, 48, 5482–5484 RSC.
- (a) B. Escuder, F. Rodríguez-Llansola and J. F. Miravet, New J. Chem., 2010, 34, 1044–1054 RSC; (b) F. Hapiot, S. Menuel and E. Monflier, ACS Catal., 2013, 3, 1006–1010 CrossRef CAS.
- (a) H. Wang and Z. Yang, Soft Matter, 2012, 8, 2344–2347 RSC; (b) T. N. Plank and J. T. Davis, Chem. Commun., 2016, 52, 5037–5040 RSC.
- (a) J. Z. Gasiorowski and J. H. Collier, Biomacromolecules, 2011, 12, 3549–3558 CrossRef CAS PubMed; (b) E. C. Wu, S. Zhang and C. A. E. Hauser, Adv. Funct. Mater., 2012, 22, 456–468 CrossRef CAS.
- (a) A. R. Hirst, B. Escuder, J. F. Miravet and D. K. Smith, Angew. Chem., Int. Ed., 2008, 47, 8002–8018 CrossRef CAS PubMed; (b) J. W. Steed, Chem. Commun., 2011, 47, 1379–1383 RSC; (c) J. Raeburn and D. J. Adams, Chem. Commun., 2015, 51, 5170–5180 RSC.
- K. J. Skilling, F. Citossi, T. D. Bradshaw, M. Ashford, B. Kellam and M. Marlow, Soft Matter, 2014, 10, 237–256 RSC.
- (a) J. T. Davis and G. P. Spada, Chem. Soc. Rev., 2007, 36, 296–313 RSC; (b) L. E. Buerkle, H. A. von Recum and S. J. Rowan, Chem. Sci., 2012, 3, 564–572 RSC; (c) G. M. Peters and J. T. Davis, Chem. Soc. Rev., 2016, 45, 3188–3206 RSC.
- Y. Yu, D. Nakamura, K. DeBoyace, A. W. Neisius and L. B. McGown, J. Phys. Chem. B, 2008, 112, 1130–1134 CrossRef CAS PubMed.
- (a) J. A. Walmsley and T. J. Pinnavaia, Biophys. J., 1982, 38, 315–317 CrossRef CAS PubMed; (b) C. De Stefano, O. Giuffrè, S. Sammartano, A. Gianguzza and D. Piazzese, Chem. Speciation Bioavailability, 2001, 13, 113–119 CrossRef CAS; (c) C. Bazzicalupi, A. Bencini and V. Lippolis, Chem. Soc. Rev., 2010, 39, 3709–3728 RSC; (d) A. Sornosa-Ten, M. T. Albelda, J. C. Frías, E. García-España, J. M. Llinares, A. Budimir and I. Piantanida, Org. Biomol. Chem., 2010, 8, 2567–2574 RSC.
- (a) R. Balhorn, L. Brewer and M. Corzett, Mol. Reprod. Dev., 2000, 56, 230–234 CrossRef CAS PubMed; (b) R. Balhorn, Genome Biol., 2007, 8, 227.1–227.8 CrossRef PubMed.
- R. Belda, E. García-España, G. A. Morris, J. W. Steed and J. A. Aguilar, Chem. – Eur. J., 2017, 23, 7755–7760 CrossRef CAS PubMed.
- (a) J. L. Sessler, P. A. Gale and W.-S. Cho, Anion Receptor Chemistry, Royal Society of Chemistry, Cambridge, 2006; (b) K. Bowman-James, A. Bianchi and E. García-España, Anion Coordination Chemistry, Wiley-VCH, New York, 2012 Search PubMed.
- (a) P. Woster and R. Casero, Polyamine Drug Discovery, Royal Society of Chemistry, Cambridge, 2011 RSC; (b) D. Castagnolo, S. Schenone and M. Botta, Chem. Rev., 2011, 111, 5247–5300 CrossRef CAS PubMed; (c) L. D'Agostino and A. Di Luccia, Eur. J. Biochem., 2002, 269, 4317–4325 CrossRef PubMed; (d) L. D'Agostino, M. di Pietro and A. D. Luccia, FEBS J., 2005, 272, 3777–3787 CrossRef PubMed.
- J. Elguero, Pyrazoles in Comprehensive Heterocyclic Chemistry II, A Review of the Literature, Pergamon, New York, 1997 Search PubMed.
- P. Gans, A. Sabatini and A. Vacca, Talanta, 1996, 43, 1739–1753 CrossRef CAS PubMed.
- L. Alderighi, P. Gans, A. Ienco, D. Peters, A. Sabatini and A. Vacca, Coord. Chem. Rev., 1999, 184, 311–318 CrossRef CAS.
- A. Lopera, A. Gil-Martínez, J. Pitarch-Jarque, B. Verdejo, S. Blasco, M. P. Clares, H. R. Jiménez and E. García-España, Dalton Trans., 2020 10.1039/D0DT01056A.
- (a) K. P. Guerra, R. Delgado, M. G. B. Drew and V. Félix, Dalton Trans., 2006, 4124–4133 RSC; (b) M. Inclán, M. T. Albelda, J. C. Frías, S. Blasco, B. Verdejo, C. Serena, C. Salat-Canela, M. L. Díaz, A. García-España and E. García-España, J. Am. Chem. Soc., 2012, 134, 9644–9656 CrossRef PubMed; (c) R. Belda, J. Pitarch-Jarque, C. Soriano, J. M. Llinares, S. Blasco, J. Ferrando-Soria and E. García-España, Inorg. Chem., 2013, 52, 10795–10803 CrossRef CAS PubMed.
- A. Bencini, A. Bianchi, E. Garcia-España, M. Micheloni and J. A. Ramirez, Coord. Chem. Rev., 1999, 188, 97–156 CrossRef CAS.
- H. Lambers, S. Piessens, A. Bloem, H. Pronk and P. Finkel, Int. J. Cosmet. Sci., 2006, 28, 359–370 CrossRef CAS PubMed.
- (a) E. García-España, R. Belda, J. González, J. Pitarch and A. Bianchi, in Supramolecular Chemistry. ed. P. A. Gale and J. W. Steed, Wiley-VCH, Chichester, 2012 Search PubMed; (b) I. Pont, C. Galiana-Rosello, A. Lopera, J. González-García and E. García-España, in Supramolecular Chemistry in Water, ed. S. Kubik, Wiley-VCH, Weinheim, 2019 Search PubMed.
- I. Alkorta, J. Elguero and A. Frontera, Crystals, 2020, 10, 180 CrossRef CAS.
- J. González-García, S. Tomić, A. Lopera, L. Guijarro, I. Piantanida and E. García-España, Org. Biomol. Chem., 2015, 13, 1732–1740 RSC.
- (a) A. Bianchi and E. García-España, J. Chem. Educ., 1999, 76, 1727–1732 CrossRef CAS; (b) C. Bazzicalupi, A. Bianchi, C. Giorgi, M. P. Clares and E. García-España, Coord. Chem. Rev., 2012, 256, 13–27 CrossRef CAS.
- V. J. Nebot and D. K. Smith, in Functional Molecular Gels, ed. B. Escuder and J. F. Miravet, Royal Society of Chemistry, Cambridge, 2013 Search PubMed.
- M. G. Basallote, A. Doménech, A. Ferrer, E. García-España, J. M. Llinares, M. A. Máñez, C. Soriano and B. Verdejo, Inorg. Chim. Acta, 2006, 359, 2004–2014 CrossRef CAS.
- R. Belda, S. Blasco, B. Verdejo, H. R. Jiménez, A. Doménech-Carbó, C. Soriano, J. Latorre, C. Terencio and E. García-España, Dalton Trans., 2013, 42, 11194–11204 RSC.
- H. E. Gottlieb, V. Kotlyar and A. Nudelman, J. Org. Chem., 1997, 62, 7512–7515 CrossRef CAS PubMed.
- (a) J. W. Erdman, Present knowledge in nutrition, Wiley, Ames, 2012 CrossRef; (b) A. C. Ross, Modern nutrition in health and disease, Wolters Kluwer, Philadelphia, 2014 Search PubMed.
- E. Garcia-España, M.-J. Ballester, F. LLoret, J. M. Moratal, J. Faus and A. Bianchi, J. Chem. Soc., Dalton Trans., 1988, 101–104 RSC.
- M. Fontanelli and M. Micheloni, Diputación de Castellón, Spain, 1990 Search PubMed.
- (a) G. Gran, Acta Chem. Scand., 1950, 4, 559–577 CrossRef CAS; (b) G. Gran, Analyst, 1952, 77, 661–671 RSC; (c) F. J. C. Rossotti and H. Rossotti, J. Chem. Educ., 1965, 42, 375–378 CrossRef CAS.
- (a) P. K. Glasoe and F. A. Long, J. Phys. Chem., 1960, 64, 188–190 CrossRef CAS; (b) A. K. Covington, M. Paabo, R. A. Robinson and R. G. Bates, Anal. Chem., 1968, 40, 700–706 CrossRef CAS.
Footnote |
| † Electronic supplementary information (ESI) available. See DOI: 10.1039/d0sm00704h |
| This journal is © The Royal Society of Chemistry 2020 |

