Tunable benzothiadiazole-based donor–acceptor materials for two-photon excited fluorescence†
Nathan R.
Paisley
 ,
Christopher M.
Tonge
 ,
Don M.
Mayder
,
Kyle A.
Thompson
and
Zachary M.
Hudson
,
Don M.
Mayder
,
Kyle A.
Thompson
and
Zachary M.
Hudson
 *
*
Department of Chemistry, The University of British Columbia, 2036 Main Mall, Vancouver, British Columbia, Canada V6T 1Z1. E-mail: zhudson@chem.ubc.ca; Fax: +1-604-822-2847; Tel: +1-604-822-3266
First published on 17th December 2019
Abstract
Here we describe the synthesis of eight benzothiadiazole-based D–π–A–π–D materials and evaluate their potential as imaging agents for two-photon excited fluorescence (2PEF). These compounds exhibit fluorescent emission with λmax ranging from 529 to 674 nm in toluene and quantum yields as high as 99%. Emission from the aggregated state is also examined with all species exhibiting emission from the aggregated state. Finally, three of these compounds are encapsulated within an amphiphilic water-soluble polymer and explored as imaging agents. The use of benzothiadiazole functionalized with two locked-planarity hexamethylazatriangulene (HMAT) donors was found to give red fluorescence with the highest two-photon cross-section σ2 of 230 GM, while also exhibiting the highest photostability of the series.
Introduction
Two-photon (2P) materials are attracting increasing attention for applications in biological imaging,1,2 optical power limiting,3,4 and 3D-data storage.5,6 Factors influencing the two-photon absorption (2PA) cross-section (σ2) of a material have also been investigated in detail, improving our ability to design compounds for 2P applications.7,8 In two-photon excited fluorescence (2PEF) imaging, dyes with large Stokes shifts which emit within the biological transparency window (650–1350 nm) can also be excited by light with wavelengths within that range,9,10 enabling in vivo imaging that is not possible with one-photon (1P) techniques.11 In order to maximize a material's 2PA cross-section, strong charge-transfer character in the material is desirable, as well as an extended π-bridge between electron donor (D) and acceptor (A) groups.7,8 In addition to the two-photon cross-section of a compound, for imaging applications, a high photoluminescent quantum yield (ΦPL), good photostability, and solubility in the imaging media are desirable.11 A synthetic pathway that diverges late in the synthetic route can also be of benefit, allowing a broader library of compounds to be easily screened.trans-Stilbene was one of the first compounds investigated for 2P properties, and stilbene derivatives are still commonly used as 2P dyes today.8,12,13 Functionalization with hydroxy, alkoxy, or amine donors improves the σ2 of these compounds, as well as red-shifting their emission spectra.8 These systems often have peak emission at wavelengths shorter than 650 nm, however, achieving emission within the biological transparency window is challenging.13 Porphyrins have been explored as 2P dyes, and take advantage of their high transition-dipole moment which can give large σ2 values.8,14,15 2,1,3-benzothiadiazole (BTD) has also been investigated as a component in 2P materials and can give emission within the biological transparency window.16–18
The use of BTD as an acceptor unit in organic electronics is widespread, and this moiety has been used in antibacterial, organic photovoltaic, fluorescent, and thermally activated delayed fluorescence materials.19 BTD-based compounds are typically highly stable, have a high ΦPL, facilitate excitation in the visible range, and exhibit large Stokes shifts in emissive derivatives.19–21 These features make BTD intriguing as an electron-accepting core for 2P applications. Functionalization with electron-donating moieties connecting via a π bridge should thus yield compounds that are strongly emissive, stable, and can be excited within the biological transparency window.
Herein, we investigate a series of quadrupolar D–π–A–π–D compounds with a BTD acceptor and a range of donor moieties and examine their potential as two-photon imaging agents. These compounds exhibit fluorescent emission ranging from 529 to 674 nm with quantum yields as high as 99%. Molecular planarity has a higher effect than donor strength on the resulting σ2 of the compounds. Finally, we investigate three of these compounds as potential water-soluble imaging agents, with the use of a locked-planarity amine donor yielding a particularly promising bright, stable system exhibiting red fluorescence.
Results and discussion
Synthesis
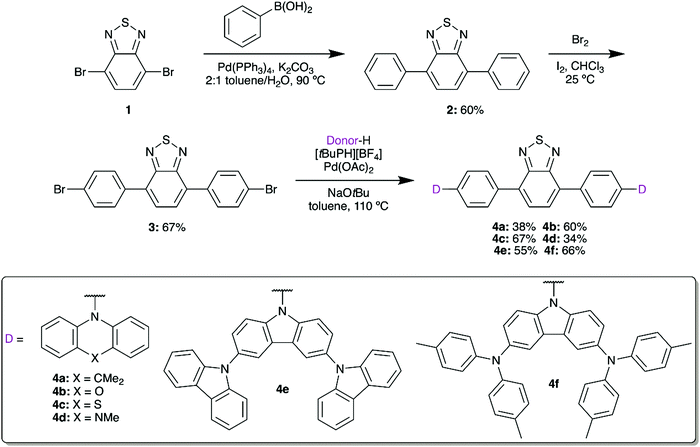
2,1,3-Benzothiadiazole (BTD) can be symmetrically modified at the 4 and 7 positions using bromination and palladium-based cross-coupling methods. We first installed a phenyl spacer as the π bridge, linking to donors with a range of electron donor strengths. These materials would then be used to form water-soluble fluorescent micelles by coprecipitation with an amphiphilic polymer, facilitating imaging in aqueous media while limiting losses in quantum yield.22,23Suzuki coupling of brominated BTD 1 with phenylboronic acid gave 2 in 60% yield (Scheme 1). Following the installation of the π bridge, this compound can once again be dibrominated with Br2 in the presence of I2 to give 3. This compound acts as a useful intermediate, as Buchwald–Hartwig amination can then be used to prepare a series of donor–acceptor materials by installing 9,9-dimethyl-9,10-dihydroacridine (DMAC, 4a), phenoxazine (POZ, 4b), phenothiazine (PTZ, 4c), 5-methylphenazine (MPAZ, 4d), 9′H-9,3′:6′,9′′-tercarbazole (TCz, 4e), or 3,6-bis(di(p-tolyl)aminyl)carbazole (TTCA, 4f) groups. Due to their low solubility in the reaction medium, purification was completed by filtration of the cooled mixture to collect the solid crude product. The mixture was then dissolved in CH2Cl2 and any undissolved solids were removed by gravity filtration. Volatiles were removed in vacuo, yielding the target compounds in approximately 95% purity by 1H NMR. The compounds could then be further purified by either Soxhlet extraction or short silica column to obtain analytically-pure materials.
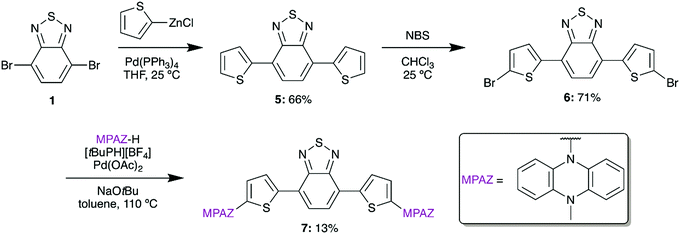
To target an ultra-low bandgap material, we also designed a thiophene-bridged molecule with MPAZ donors. Thiophene-bridged BTD materials are commonly used in bulk-heterojunction polymer solar cells and have been shown to significantly increase σ2 in BTD materials.24,25 To synthesize the thiophene-bridged species, 5 was formed from 1 by a Negishi coupling reaction using (2-thiophenyl)zinc chloride (Scheme 2). A subsequent bromination with N-bromosuccinimide (NBS) afforded 6 which was then amenable to the addition of MPAZ via a Buchwald–Hartwig amination to give 7.
Hexamethylazatriangulene (HMAT) has also been used in 2PA systems to lock molecular planarity, resulting in high values for σ2.26–29 In dendritic triphenylamines, the use of HMAT instead of analogous, nonplanar triarylamines led to a 4 times increase in σ2 between molecules with similar size and structure.29 Due to reduced energy losses in the excited state imposed by its molecular rigidity, molecules including the HMAT donor also typically exhibit improved ΦPL relative to analogous, nonplanar systems.28,30
Based on the demonstrated benefits of HMAT materials, a planarized version of 4a was synthesized from 2-bromohexamethyltriangulene (HMAT-Br) to give 9 (Scheme 3). HMAT is synthesized from methyl anthranilate and methyl 2-iodobenzoate in three steps,27 after which selective bromination with NBS yields HMAT-Br.27 In analogy with 5, a Negishi coupling reaction was initially attempted between 1 and HMAT-Br by formation of the organozinc chloride of HMAT, yet this reaction gave negligible amounts of compound 9. Pinacol borane groups were therefore added to 1via Suzuki coupling to give 8, which furnished D–A–D type 9 upon Suzuki coupling.
Density functional theory calculations
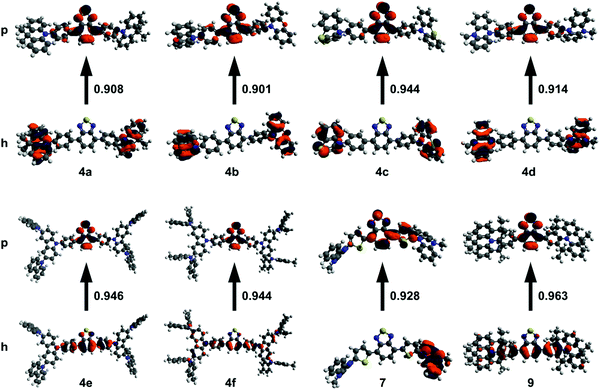
Density functional theory (DFT) is useful for studying the nature of optical transitions, though DFT functionals such as B3LYP poorly describe transitions with charge-transfer character.31–33 Range-separated hybrid (RSH) functionals such as ωB97XD better account for CT character, yet require tuning in order to optimize the functional to the specific system under study.31,32 Hybrid functionals, such as B3LYP, use a fixed amount of exact-exchange (from Hartree–Fock theory) in addition to electron correlation (from DFT).31 RSH functionals use a variable amount of exact-exchange and electron correlation that changes with distance according to a pre-set range separation value (ω).31 Gap tuning, for a specific molecule, can be performed on RSH functionals by varying ω to minimize the difference between the ionization potential and HOMO energy, as well as between the electron affinity and LUMO energy.31,32 The Tamm–Dancoff approximation (TDA) scheme of time-dependant DFT (TD-DFT) discards the deexcitation matrix present in TD-DFT.34 The advantage of using TDA-DFT over TD-DFT is in the calculation of triplet energies, saving significant computational time while still giving reliable absorption spectra.34 This is especially beneficial for systems which suffer from the triplet instability problem, and when dealing with large molecules.34With these considerations in mind, DFT calculations were run using the gap-tuned RSH functional ωB97XD (hereon denoted ωB97XD*) and the 6-31+G(d) basis set. Structures were initially optimized using ωB97XD with the default range separation value. The resulting structure was then used to gap-tune the ωB97XD functional and give a specific ωB97XD* functional for each compound. TDA-DFT calculations were run at the ωB97XD*/6-31+G(d) level in toluene using the polarizable continuum model. Natural transition orbitals (NTOs) for the S1 excited state were computed to gain insight into the nature of the 1PA transition (Fig. 1). Time-dependant calculations often show multiple orbital contributions for each transition; NTOs combine these multiple transitions into ideally one particle-hole (excited state-ground state) pair. Compounds 4a–d and 7 primarily show CT character in their respective NTOs with no significant overlap between particle and hole orbitals. 4e, f, and 9 have a significant amount of π to π* character in addition to CT character with orbital contribution from the BTD core in both the particle and hole orbitals.
Structural characterization
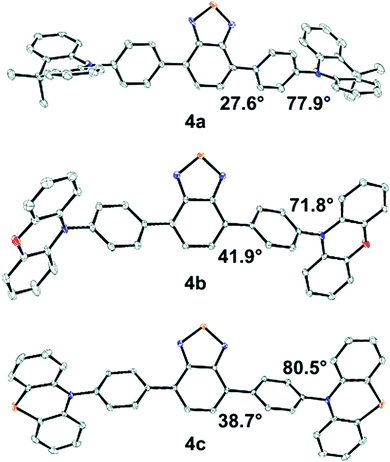
Solid-state molecular structures were obtained from single crystal X-ray diffraction (XRD) for 4a–c (Fig. 2). The average BTD-phenyl dihedral angle is 27.6°, 41.9°, and 38.7° for 4a, 4b, and 4c, respectively, while the average phenyl-donor dihedral angles are 77.9°, 71.8°, and 80.5°. The DMAC donor units in 4a show significant deviation from planarity, appearing puckered about the central dimethylmethylene bridge, while the donor moieties in 4b and 4c are nearly planar. Molecular packing of 4b shows ∼4 Å π–π stacking interactions between the POZ donor and BTD core, however, no such interactions are observed in 4a or 4c (Fig. S2–S4, ESI†).The calculated structures of 4a–c have similar BTD-phenyl dihedral angles at ∼43.3° and are larger than those determined from XRD. The phenyl-donor dihedral in 4a is 90°, which is higher than the value determined from XRD, while the same angle in 4b and 4c is similar to their XRD values. The planarity of the donors in 4a–c is opposite to the XRD structures with the DMAC donors in 4a showing no deviation from planarity and significant puckering occurring in the POZ and PTZ donors in 4b and 4c, respectively. Comparing the calculated structures; 4d has a similar BTD-phenyl and phenyl-donor dihedral as 4a–c, and the MPAZ donor is puckered. 4e and 4f have similar BTD-phenyl dihedrals as 4a–c, however, the phenyl-donor dihedral is significantly lower at 60.7° and 55.4°, respectively. 7 has a smaller BTD-thiophene dihedral of 21.7° and the thiophene-donor dihedral is similar to the analogous dihedral in 4d. In 9 the calculated BTD-donor dihedral is substantially smaller at 39.2°, a result of the donor moiety's limited ability to twist relative to the others.
One-photon photophysical properties
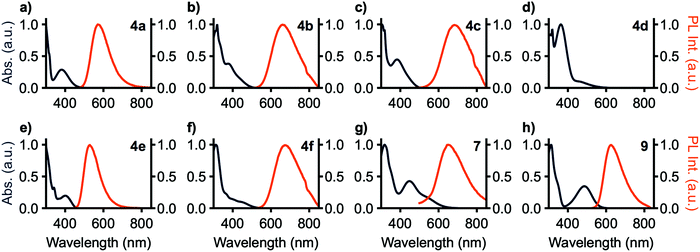
One-photon absorbance (1PA) spectra are shown in Fig. 3. The lowest energy transition for 4a–c have respective maxima between 378 and 383 nm. 4d has an absorbance band at 449 nm which is red-shifted from 4a–c. The strong donor strength of the MPAZ moiety shrinks the band gap, leading to a lower energy absorbance relative to 4a–c. 4e and 4f have lower-energy bands located at 401 and 440 nm, respectively, due to their increased π–π* excited state character compared to 4a–c. 7 has an absorbance maximum at 447 nm, consistent with the extended nature of the calculated S1 particle NTO. 9, the most planar of the compounds tested, shows the most red-shifted absorption at 487 nm. Molecular conformations are expected to have a significant effect on both the absorptivity of these materials, as well as their two-photon cross-sections and their propensity for thermally activated delayed fluorescence (TADF). The observed values for ε (Table 1) are consistent with similar phenyl-bridged BTD-based systems,35 and the lack of TADF in these materials is attributable to the modest donor–acceptor dihedral angles.| Cmpd | λ 1PAmax (nm) | E optgap/EDFTgapb,c (eV) | HOMO/LUMOd,e (eV) | ε (104 M−1 cm−1) | λ emmax (nm) | Φ air /ΦN2g (ΦSS)h | τ air /τN2g (ns) |
|---|---|---|---|---|---|---|---|
| a Measured in CH2Cl2 at 0.01 mg mL−1. b Calculated from a Tauc plot of the UV-Vis spectrum in CH2Cl2. c Energy corresponding to the S1 excited state from TDA-DFT at the ωB97XD*/6-31+G(d) level. d HOMO = −(E1/2,ox + 4.8 eV). e LUMO = (HOMO + Eoptgap). f Measured in toluene (4a–f and 9) or THF (7) at 0.01 mg mL−1. g Measured in toluene (4a–f and 9) or THF (7) at 0.01 mg mL−1 with 5 min N2 sparging. h Measured as a powder. λex = λmax,abs. | |||||||
| 4a | 381 | 2.90/3.48 | −5.2/−2.3 | 1.4 | 574 | 0.43/0.60 (0.33) | 8.9/12.4 |
| 4b | 378 | 2.94/3.37 | −5.1/−2.2 | 1.2 | 653 | 0.15/0.21 (0.03) | 6.6/8.1 |
| 4c | 383 | 2.85/3.53 | −5.1/−2.3 | 1.5 | 674 | 0.04/0.07 (0.03) | 6.0/7.8 |
| 4d | 363 | 3.07/3.13 | −4.5/−1.4 | 2.5 | — | — (—) | — |
| 4e | 401 | 2.86/3.37 | −5.4/−2.5 | 1.9 | 529 | 0.97/0.99 (0.54) | 4.8/5.0 |
| 4f | 440 | 2.52/3.10 | −5.0/−2.5 | 1.0 | 667 | 0.19/0.22 (0.12) | 5.7/6.9 |
| 7 | 447 | 2.11/2.75 | −4.6/−2.5 | 1.2 | 652 | <0.01/<0.01 (—) | 8.0/7.9 |
| 9 | 487 | 2.31/2.73 | −5.2/−2.9 | 2.0 | 626 | 0.82/0.77 (0.30) | 6.2/6.3 |
Photoluminescence (PL) spectra are shown in Fig. 3 and photoluminescence data is summarized in Table 1. No photoluminescence was detected from 4d in solution at room temperature, potentially a consequence of the band-gap law as MPAZ was the strongest donor tested. 7 shows no emission in toluene solution, however, in THF solution emission is detected. All observed emission bands are broad and without vibronic character. These results are consistent with TDA-DFT showing significant charge transfer in these compounds. The trend in emission maxima matches that expected from the donor strength of the compounds, with 4a and 4e having the weakest donors and yellow-green emission at 574 and 529 nm, respectively. 9 has an intermediate strength donor and peak emission occurs at 626 nm. 4b, c, f, and 7 have the strongest donors and peak emission is observed at 674, 653, 667, and 652 nm, respectively. ΦPL is highest with 4a and 4e at 43% and 97%, respectively, and drops with increasing donor strength to a minimum of less than 1% with 7. 9, however, breaks this trend, with a high ΦPL of 83%. Emission lifetimes for all compounds range from 4.9 to 8.9 ns and are single component in nature.
Under an inert N2 atmosphere, 4a–c, 4e, and 4f display enhanced ΦPL and longer PL lifetimes (Table 1). ΦPL values increase by a maximum of 17% (4a) with the remaining compounds showing a much smaller increase. A similar trend is observed with PL lifetimes, with 4a showing an increase in lifetime of 3.5 ns and 4b, 4c, and 4f showing an increase of 1.5, 1.8, and 1.2 ns, respectively. 4e, 7, and 9 show minimal change in lifetime.
Solvatochromism was also investigated using toluene, methylene chloride, ethyl acetate, and pyridine solutions, chosen as they provide sufficient solubility to all compounds in the series. All compounds except 4c exhibited positive solvatochromism with the highest-energy emission in toluene. 4c includes phenothiazine donors which may adopt either pseudoaxial or pseudoequatorial conformations,36,37 and it is likely that solvent polarity influences the distribution between the two. 4d shows emission around 480 nm arising from donor-based transitions, yet no charge transfer emission is observed owing to the small bandgap resulting from the highly electron-rich methylphenazine donor.
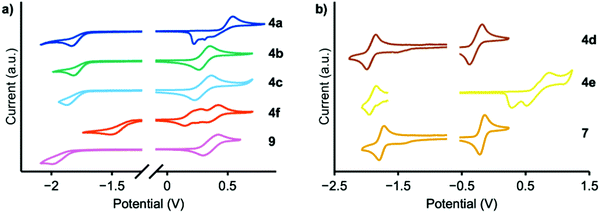
Cyclic voltammetry experiments were conducted to determine EHOMO (Fig. 4); the results are summarized in Table 1. Reduction peaks were not well resolved in THF solution and therefore the optical bandgap was used to calculate ELUMO. MPAZ (4d) exhibits the highest HOMO energy of approximately −4.5 eV, while the weakest donors, DMAC and TCz (4a and 4e), exhibit HOMO energies of −5.2 and −5.4 eV, respectively, consistent with the expected trend in donor strength. Faradaic events occurring at potentials higher than EHOMO were also observed and likely correspond to electrodeposition, electropolymerization events, or oxidation of the second donor moiety.
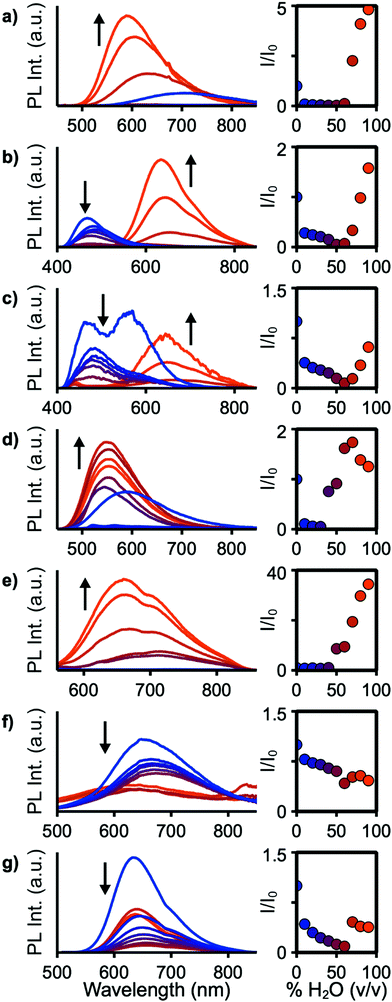
For applications in biological imaging, dissolution of these nonpolar fluorophores in aqueous environments will inevitably result in aggregation. We thus investigated the emission of each of these materials in the aggregated state by collecting spectra of each compound in THF/water solutions with fw (water fraction, v/v%) ranging from 0% to 90% (Fig. 5). 4a–c, e, f, 7, and 9 show emission in the aggregated state with 4f increasing in intensity by 3400% at 90% H2O. 7 shows aggregation-caused quenching behaviour. The remaining compounds emit in fw 0% solutions, then drop in emission intensity as fw increases before again rising in intensity at high water fraction. At a fw of 90%, 4a, 4b, and 4e emit with slightly higher intensity compared to their emission in pure THF, while 4c and 9 are lower in intensity at fw = 90%. In THF solution 4b and 4c show strongly blue-shifted emission, relative to their emission at fw above 60%, possibly arising from donor-based transitions (POZ and PTZ, respectively). 4c also shows dual emission below fw 60%. This is consistent with previous studies showing that PTZ has multiple emissive conformations.38,39 The mechanism for emission enhancement in 4a–f is likely due to restriction of vibrational motion within the donor, as well as restricted rotational motion about the phenyl spacers.35,40 At high fw aggregation of the materials is expected to reduce intramolecular motion, consistent with reduced non-radiative relaxation.
Solid-state quantum yields were determined to further investigate the effects of aggregation (Table 1). All compounds except 4d are emissive in the solid state but with reduced ΦPL compared to their solution values. The largest decrease is observed for 4b and 9, resulting in ΦPL of 3% and 30% compared to 15% and 82%, respectively, in toluene solution. In the molecular structure of 4b, significant π stacking interactions are observed which led to increased quenching over 4a and 4c.
Two-photon excited fluorescence
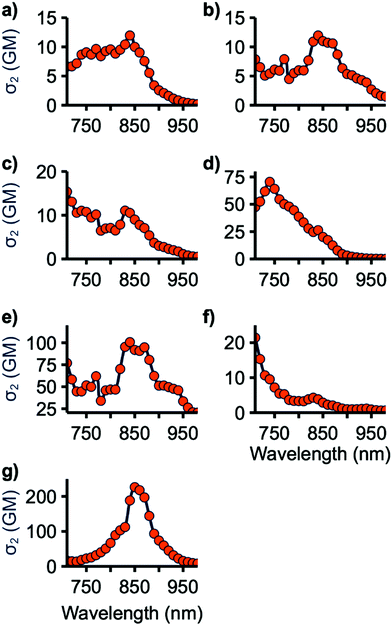
The two-photon cross-sections (σ2) of all emissive compounds were determined using the two-photon excited fluorescence (2PEF) method from 710 to 980 nm, the limits of our laser.41 Rhodamine 6G in MeOH was used as the reference for all samples. Samples were periodically checked to ensure a square dependence of signal intensity with excitation power. As shown in Fig. 6, 4a–c and 7 display small σ2 values. The maximum 2PA cross-section for 4c and 7 occurs at 710 nm, the lowest wavelength tested, suggesting that the maximum σ2 value for these compounds may occur at shorter wavelength. This may also be the case for 4a and 4b as they are structurally similar to 4c with nearly identical 1PA maxima. 4e and 4f have improved cross-sections, with peak σ2 values of 70 and 100 GM at 740 and 840 nm, respectively. 9 has the highest two-photon response with a maximum of 230 GM at 850 nm. 4e, f, and 9 have lowest energy 2PA bands at an energy higher than their corresponding lowest energy 1PA band, consistent with studies on similar molecules.18 This can be explained in light of the symmetry selection rules for 2PA. 2PA symmetry selection rules are opposite to those for 1PA in centrosymmetric systems, resulting in the lowest 1PA band being 2PA forbidden. While the tested molecules are not centrosymmetric, reduction in the 2PA band matching the low-energy 1PA maximum band has been previously observed for quadrupolar linear molecules such as these.8The two-photon response of these compounds can be rationalized by considering the planarity of their structure. 4a–c have large BTD-spacer and spacer-donor dihedral angles which limits their ability to undergo 2PA. 7 has a low BTD-thiophene dihedral, however, the thiophene-donor dihedral is large. 4e and 4f are relatively planarized with smaller spacer-donor dihedrals and 9 is further planarized with only a BTD-donor dihedral. This is consistent with studies of BTD and HMAT-derived systems finding that 2P activity scaled with the planarity of the molecule overall.18,27,28
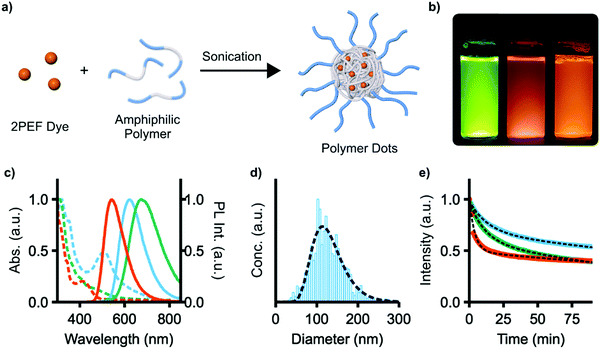
We next explored the use of compounds 4e, f, and 9 as fluorescent dyes encapsulated in water-soluble micelles, to explore their utility for applications in imaging. Such micelles, also known as polymer dots (Pdots), are emerging as a useful class of materials for nanoparticle-based sensing and analysis.42–44 A high density of chromophores can be encapsulated within Pdots, offering high signal-to-noise in imaging, and functionalization with binding groups or therapeutic cargo affords multifunctional probes. 4e, f, and 9 were chosen as they have the highest two-photon brightness (σ2ΦPL) of the compounds studied. Encapsulation was performed by dissolving both the dye and the amphiphilic polymer Pluronic F127 (PEO100-b-PPO65-b-PEO100) in CHCl3, removing all volatiles in vacuo, and then redissolving the solid with sonication in water (Fig. 7a, PEO = poly(ethylene oxide), PPO = poly(propylene oxide)). The low-energy 1PA absorption maxima of these micelles is red-shifted in all cases from those of the unencapsulated dyes, with λmax = 412, 445, and 507 nm for 4e, f, and 9 (Fig. 7c). The emission of 4e and 4f red-shift slightly to 543 and 674 nm, respectively; the emission of 9, however, remains essentially unchanged. ΦPL is reduced to 0.44, 0.05, and 0.39 for 4e, f, and 9 upon encapsulation. As a representative sample, the micelles of 9 were found to have an average diameter of 129 ± 4 nm by nanoparticle tracking analysis, which also showed a monomodal particle distribution with a size dispersity of 2.9 (Fig. 7d).
The relative photostability of each micelle sample was also examined by photobleaching experiments. Each micelle sample was continuously illuminated with 450 nm light under a fluorescence microscope and emission intensity was recorded at 1 minute intervals (Fig. 7e). Photobleaching occurs with two first-order rate constants of 0.25 and 0.002 min−1, 0.09 and 0.005 min−1, and 0.07 and 0.003 min−1 for 4e, f, and 9, respectively. The two constants are attributed to photobleaching of the dye and the increasing penetration of excitation light into the micelles as photobleaching occurs.
Conclusion
In this study, 8 new D–π–A–π–D type benzothiadiazoles were synthesized using a divergent synthetic pathway allowing for the facile installation of a series of donor moieties. All except 4d are fluorescent in solution with emission maxima ranging from 529 to 674 nm and quantum yields as high as 99%. Emission from the aggregated state was also examined, with all but 4d showing emission from the aggregated state and 4f exhibiting a 34-fold increase in photoluminescence intensity in 90% water/THF compared to pure THF solution. 2PEF activity was also examined for this series of materials, with peak σ2 values ranging from 12 to 230 GM. Molecular planarity was found to be the major factor affecting two-photon cross-section, with 4a–c having the lowest σ2 values, 4e and 4f having intermediate σ2 values, while the use of HMAT as the donor with no phenyl π bridge gives the highest σ2. Water-soluble micelles applicable to biological imaging were also formed with 4e, f, or 9 encapsulated within. Photobleaching experiments revealed that 9 was significantly more stable under illumination than the other dyes examined, while still exhibiting a high quantum yield of 39% in aqueous solution. Overall, this work develops a detailed understanding of the photophysics of benzothiadiazole-based materials for two-photon imaging, with promise for applications in imaging in the biological transparency window.Experimental
General considerations
All reactions were performed under a nitrogen atmosphere using standard Schlenk techniques unless otherwise stated. Solvents were of reagent grade or higher. Toluene was obtained from Caledon Laboratories, dried using an Innovative Technologies Inc. solvent purification system, collected under vacuum, and stored under a nitrogen atmosphere. All reagents were purchased from Sigma-Aldrich or Oakwood Chemical and used as received unless otherwise stated. 4,7-Dibromo-2,1,3-benzothiadiazole,45 4,7-diphenyl-2,1,3-benzothiadiazole,46 4,7-bis(4-bromophenyl)-2,1,3-benzothiadiazole,46 4,7-bis(2-thienyl)-2,1,3-benzothiadiazole,45 4,7-bis(5-bromothiophen-2-yl)-2,1,3-benzothiadiazole,47 4,7-bis(4,4,5,5-tetramethyl-1,3,2-dioxaborolan-2-yl)-2,1,3-benzothiadiazole,48 9,9-dimethyl-9,10-dihydroacridine,49 5-methylphenazine,50 9′H-9,3′:6′,9′′-tercarbazole,51N3,N3,N6,N6-tetra-p-tolyl-9H-carbazole-3,6-diamine,52 and 2-bromo-4,4,8,8,12,12-hexamethyl-8,12-dihydro-4H-benzo[9,1]quinolizino[3,4,5,6,7-defg]acridine53 were synthesized according to literature methods. 1H and 13C{1H} nuclear magnetic resonance (NMR) spectra were measured on Bruker Avance 400 MHz or Bruker AV III HD 400 MHz spectrometers with chloroform-d (CDCl3), dichloromethane-d2 (CD2Cl2), tetrahydrofuran-d8 (THF-d8), dimethyl sulfoxide-d6 (DMSO-d6), or pyridine-d5 (Py-d5) as the solvent. Mass spectra were recorded on a Kratos MS-50 instrument using electron impact ionization or field desorption.Photophysical characterization
Absorbance measurements were made on a Cary 60 spectrometer with dichloromethane (CH2Cl2) as the solvent. One-photon excited fluorescence measurements were made on an Edinburgh Instruments FS5 Spectrofluorometer or Cary Eclipse Fluorescence Spectrophotometer. The excitation wavelength (λex) of all fluorescence measurements was matched to the maximum of the lowest energy absorption band determined from UV-Vis. Steady state fluorescence measurements were conducted at 10 μg mL−1 in toluene, methylene chloride, ethyl acetate, or pyridine. Absolute photoluminescence quantum yield (PLQY) was determined using an Edinburgh Instruments SC-30 integrating sphere module. PLQY measurements were conducted in toluene at 5 μg mL−1 (optical density at the excitation wavelength between 0.05 and 0.15). Time-correlated single photon counting (TCSPC) measurements were made on an Edinburgh Instruments FS5 Spectrofluorometer equipped with a 313 nm picosecond pulsed diode LED. Aggregation-induced emission (AIE) measurements were conducted in THF/water mixtures at 0.01 mg mL−1. Two-photon cross-sections (σ2) were calculated using the two-photon excited fluorescence method.41 Two-photon cross-section (σ2) values from 710–980 nm were measured with an inverted two-photon fluorescence scanning microscope (Zeiss LSM 510 MP). Samples (3 mL) were measured in quartz cuvettes and concentrations were adjusted to give similar 2PEF intensities (4a, 0.01 mg mL−1; 4b, 0.05 mg mL−1; 4c, 0.20 mg mL−1; 4e, 0.01 mg mL−1; 4f, 0.01 mg mL−1; 7, 1.0 mg mL−1; 9, 0.01 mg mL−1 in toluene) and Rhodamine 6G in MeOH (0.001 mg mL−1 in MeOH) was used as the ref. 41. The cuvette was illuminated at a depth of 0.6 mm from the bottom of the cuvette and imaged with a 10×/0.3 objective lens and femtosecond laser with a tuning range of 710–980 nm. The dichroic mirror had a cut-off at 660 nm and detector wavelength sensitivity was corrected for using either a 550/40 or 610/20 bandpass filter (center wavelength and bandwidth in nm). The square-dependence of the fluorescence intensity on laser power was periodically confirmed for all measured and σ2 was calculated using the quantum yield obtained from one-photon excitation experiments.Photobleaching
Photobleaching measurements were done on an inverted microscope. Sample aliquots (5 μL) were measured in a clear flat-bottom 1536-well plate (Greiner Bio One, Kremsmünster, Austria) with the wells covered with universal optical sealing tape (#6575, Corning). Sample concentrations were adjusted to obtain similar initial fluorescence intensities (4e, 0.005 mg mL−1; 4f, 0.05 mg mL−1; 9, 0.002 mg mL−1). A 2 × 2 array of wells was illuminated and imaged with a 4× objective lens (NA 0.16). The excitation filter was 450/50 (center wavelength and bandwidth in nm), the dichroic mirror had a cut-off at 565 nm, and the emission filter was a longpass filter with a 570 nm cut-off (Chroma, Bellows Falls, VT). The excitation power was estimated to be ∼62 mW at the sample. Samples were continuously illuminated using the above conditions and images were acquired at 1 min intervals for 90 min and analyzed using ImageJ software (NIH, Bethesda, MD) with the Time Series Analyzer V3 plugin. The initial intensity for each sample was normalized to a value of unity. Photobleaching rates were determined by fitting the intensity versus time data with a biexponential decay function.Nanoparticle tracking analysis
Size and molar concentration of Pluronic F127 encapsulated 9 was determined by nanoparticle tracking analysis (NTA) using a NanoSight NS300 (Malvern Panalytical, Malvern, UK). The sample was diluted with filtered (0.22 μm) water prior to measurements (0.25 μg mL−1). Measurements were recorded in scattering (no filter) mode using a laser wavelength of 488 nm. Nanoparticle sizes and concentrations were determined by using the NanoSight NTA software (ver. 3.3).Electrochemical methods
Cyclic voltammograms were recorded using a CH Instruments 660D potentiostat at room temperature using a standard three-electrode configuration (working electrode: 2 mm diameter Pt disc; reference electrode: RE-5B Ag/AgCl electrode in saturated aqueous KCl (BASi Inc.), referenced externally to ferrocene/ferrocenium; counter electrode: Pt wire) in 0.2 M tetrabutylammonium hexafluorophosphate in tetrahydrofuran or o-dichlorobenzene. Experiments were run at a scan rate of 50 mV s−1 in dry degassed electrolyte solution with 0.001 M analyte.Density functional theory
Quantum-mechanical calculations were performed using the Gaussian 16 Rev. B.01 computational package using default settings unless otherwise stated. All geometries were optimized to a minimum, and frequency calculations were performed at the same level of theory to verify the absence of imaginary frequencies. Initial geometry optimizations were conducted at the ωB97XD/6-31+G(d) level. The optimal range-separation value (ω) was determined based on the ωB97XD/6-31+G(d) level and are listed in Table S1 (ESI†). To optimize ω, J2 (eqn (1)) was minimized.32εHOMO is the energy of the HOMO. IP is the ionization potential and is calculated using eqn (2). Egs is the energy of the ground state system. | (1) |
| IP(N) = Egs(N − 1) − Egs(N) | (2) |
Single-point energy calculations were carried out on the N and N ± 1 electron systems and optimization was conducted using a golden section search implemented with a bash script to find the minimum of J2 and give the optimized functional (referred to as ωB97XD*). Possible ω values for the minimization were limited between 0.05 and 0.5 Bohr−1. A second geometry optimization at the ωB97XD*/6-31+G(d) level was conducted. Vertical excitation (absorption) energies of the lowest singlet- and triplet-excited states were calculated using the Tamm–Dancoff approximation (TDA) scheme of time-dependent DFT (TD-DFT) at the ωB97XD*/6-31+G(d) level in toluene using the polarizable continuum model (PCM). Natural transition orbitals (NTOs) were calculated using Multiwfn Version 3.6.
X-ray crystallography
Single yellow plate-shaped (4a), orange prism-shaped (4b), or red needle-shaped (4c) crystals were recrystallized from a mixture of THF and heptane by slow evaporation. A suitable crystal (0.40 × 0.30 × 0.03) mm3 (4a), (0.28 × 0.26 × 0.14) mm3 (4b), or (0.54 × 0.11 × 0.06) mm3 (4c) was selected and mounted on a mylar loop in oil on a Bruker APEX II area detector diffractometer. The crystal was kept at a steady T = 90(2) K during data collection. The structure was solved with the XT54 structure solution program using the Intrinsic Phasing solution method and by using Olex255 as the graphical interface. The model was refined with version 2018/3 of XL56 using Least Squares minimization CCDC 1953988–1953990.†General reaction A
Carried out using a modified literature method.57 An oven-dried 100 mL 3-neck round-bottom flask was equipped with a liquid-cooled condenser, Teflon stir bar, glass stopper, and rubber septum. The flask was evacuated and back filled with nitrogen gas three times. 3 (1.12 mmol, 500 mg, 1 eq.), [t-Bu3PH][BF4] (0.13 mmol, 39 mg, 0.12 eq.), palladium(II)acetate (0.06 mmol, 13 mg, 0.05 eq.), sodium tert-butoxide (2.8 mmol, 269 mg, 2.5 eq.) and the respective donor (2.7 mmol, 2.4 eq.) were added rapidly to the flask under positive nitrogen gas flow. The flask was again evacuated and back filled with nitrogen gas three times. Toluene (23 mL) was added via air-tight syringe and the reaction was heated to reflux with an oil bath set to 130 °C. The reaction was monitored by TLC (1![[thin space (1/6-em)]](https://www.rsc.org/images/entities/char_2009.gif) :
:![[thin space (1/6-em)]](https://www.rsc.org/images/entities/char_2009.gif) 1 hexanes
1 hexanes![[thin space (1/6-em)]](https://www.rsc.org/images/entities/char_2009.gif) :
:![[thin space (1/6-em)]](https://www.rsc.org/images/entities/char_2009.gif) dichloromethane) until no 3 remained. The reaction was cooled to room temperature. The precipitated product was isolated by vacuum filtration and rinsed with a minimal amount of cold toluene. The collected solid was dissolved in dichloromethane and filtered by gravity. Volatiles were removed from the filtrate to isolate the solid product.
dichloromethane) until no 3 remained. The reaction was cooled to room temperature. The precipitated product was isolated by vacuum filtration and rinsed with a minimal amount of cold toluene. The collected solid was dissolved in dichloromethane and filtered by gravity. Volatiles were removed from the filtrate to isolate the solid product.
![[thin space (1/6-em)]](https://www.rsc.org/images/entities/char_2009.gif) :
:![[thin space (1/6-em)]](https://www.rsc.org/images/entities/char_2009.gif) 1 hexanes
1 hexanes![[thin space (1/6-em)]](https://www.rsc.org/images/entities/char_2009.gif) :
:![[thin space (1/6-em)]](https://www.rsc.org/images/entities/char_2009.gif) dichloromethane). Product isolated as an orange/red powder (437 mg, 60%). 1H NMR (400 MHz, THF-d8): δ 8.40 (d, J = 8.4 Hz, 4H), 8.10 (s, 2H), 7.57 (d, J = 8.4 Hz, 4H), 6.71–6.57 (m, 12H), 6.08 (dd, J = 7.1, 2.2 Hz, 4H). 13C{1H} NMR (101 MHz, THF-d8): δ 154.78, 144.83, 140.05, 138.27, 135.12, 133.19, 132.72, 131.53, 129.13, 123.93, 122.00, 115.96, 114.09. HRMS (EI-TOF) m/z: M˙+ calculated for [C42H26N4O2S]˙+ 650.1776; found 650.1767; difference 0.61 ppm.
dichloromethane). Product isolated as an orange/red powder (437 mg, 60%). 1H NMR (400 MHz, THF-d8): δ 8.40 (d, J = 8.4 Hz, 4H), 8.10 (s, 2H), 7.57 (d, J = 8.4 Hz, 4H), 6.71–6.57 (m, 12H), 6.08 (dd, J = 7.1, 2.2 Hz, 4H). 13C{1H} NMR (101 MHz, THF-d8): δ 154.78, 144.83, 140.05, 138.27, 135.12, 133.19, 132.72, 131.53, 129.13, 123.93, 122.00, 115.96, 114.09. HRMS (EI-TOF) m/z: M˙+ calculated for [C42H26N4O2S]˙+ 650.1776; found 650.1767; difference 0.61 ppm.
![[thin space (1/6-em)]](https://www.rsc.org/images/entities/char_2009.gif) :
:![[thin space (1/6-em)]](https://www.rsc.org/images/entities/char_2009.gif) 1 hexanes
1 hexanes![[thin space (1/6-em)]](https://www.rsc.org/images/entities/char_2009.gif) :
:![[thin space (1/6-em)]](https://www.rsc.org/images/entities/char_2009.gif) dichloromethane). Product isolated as an orange/red powder (206 mg, 67%). 1H NMR (400 MHz, THF-d8): δ 8.38 (d, J = 8.5 Hz, 4H), 8.09 (s, 2H), 7.58 (d, J = 8.5 Hz, 4H), 7.05 (dd, J = 7.5, 1.7 Hz, 4H), 6.96–6.81 (m, 8H), 6.46 (dd, J = 8.1, 1.3 Hz, 4H). 13C{1H} NMR (101 MHz, THF-d8): δ 154.81, 144.94, 142.35, 137.51, 133.12, 132.27, 130.54, 129.01, 127.52, 127.38, 123.41, 122.18, 117.65. HRMS (EI-TOF) m/z: M˙+ calculated for [C42H26N4S3]˙+ 682.1320; found 682.1286; difference −4.91 ppm.
dichloromethane). Product isolated as an orange/red powder (206 mg, 67%). 1H NMR (400 MHz, THF-d8): δ 8.38 (d, J = 8.5 Hz, 4H), 8.09 (s, 2H), 7.58 (d, J = 8.5 Hz, 4H), 7.05 (dd, J = 7.5, 1.7 Hz, 4H), 6.96–6.81 (m, 8H), 6.46 (dd, J = 8.1, 1.3 Hz, 4H). 13C{1H} NMR (101 MHz, THF-d8): δ 154.81, 144.94, 142.35, 137.51, 133.12, 132.27, 130.54, 129.01, 127.52, 127.38, 123.41, 122.18, 117.65. HRMS (EI-TOF) m/z: M˙+ calculated for [C42H26N4S3]˙+ 682.1320; found 682.1286; difference −4.91 ppm.
![[thin space (1/6-em)]](https://www.rsc.org/images/entities/char_2009.gif) :
:![[thin space (1/6-em)]](https://www.rsc.org/images/entities/char_2009.gif) 1 hexanes
1 hexanes![[thin space (1/6-em)]](https://www.rsc.org/images/entities/char_2009.gif) :
:![[thin space (1/6-em)]](https://www.rsc.org/images/entities/char_2009.gif) dichloromethane) until no 6 remained. The initially isolated solid was purified with a silica column (4
dichloromethane) until no 6 remained. The initially isolated solid was purified with a silica column (4![[thin space (1/6-em)]](https://www.rsc.org/images/entities/char_2009.gif) :
:![[thin space (1/6-em)]](https://www.rsc.org/images/entities/char_2009.gif) 1 hexanes
1 hexanes![[thin space (1/6-em)]](https://www.rsc.org/images/entities/char_2009.gif) :
:![[thin space (1/6-em)]](https://www.rsc.org/images/entities/char_2009.gif) dichloromethane). The product was isolated as a dark red solid (87 mg, 13%). 1H NMR (400 MHz, DMSO-d6): δ 8.24 (d, J = 4.0 Hz, 2H), 8.20 (s, 2H), 7.27 (d, J = 4.0 Hz, 2H), 6.81–6.74 (m, 4H), 6.64–6.56 (m, 8H), 6.35–6.27 (m, 4H), 3.05 (s, 6H). 13C{1H} NMR (101 MHz, DMSO-d6): δ 144.23, 136.96, 136.79, 131.28, 130.08, 128.14, 125.76, 123.11, 113.71, 111.83, 106.91, 101.45, 90.40, 32.02. HRMS (EI-TOF) m/z: M˙+ calculated for [C40H28N6S3]˙+ 688.1538; found 688.1542; difference 0.63 ppm.
dichloromethane). The product was isolated as a dark red solid (87 mg, 13%). 1H NMR (400 MHz, DMSO-d6): δ 8.24 (d, J = 4.0 Hz, 2H), 8.20 (s, 2H), 7.27 (d, J = 4.0 Hz, 2H), 6.81–6.74 (m, 4H), 6.64–6.56 (m, 8H), 6.35–6.27 (m, 4H), 3.05 (s, 6H). 13C{1H} NMR (101 MHz, DMSO-d6): δ 144.23, 136.96, 136.79, 131.28, 130.08, 128.14, 125.76, 123.11, 113.71, 111.83, 106.91, 101.45, 90.40, 32.02. HRMS (EI-TOF) m/z: M˙+ calculated for [C40H28N6S3]˙+ 688.1538; found 688.1542; difference 0.63 ppm.
![[thin space (1/6-em)]](https://www.rsc.org/images/entities/char_2009.gif) :
:![[thin space (1/6-em)]](https://www.rsc.org/images/entities/char_2009.gif) 1, 2.1 mL) was sparged with nitrogen gas for 15 min. The THF/water mixture was added via air-tight syringe and the reaction was heated with an oil bath set to 80 °C. The reaction was monitored by TLC (10
1, 2.1 mL) was sparged with nitrogen gas for 15 min. The THF/water mixture was added via air-tight syringe and the reaction was heated with an oil bath set to 80 °C. The reaction was monitored by TLC (10![[thin space (1/6-em)]](https://www.rsc.org/images/entities/char_2009.gif) :
:![[thin space (1/6-em)]](https://www.rsc.org/images/entities/char_2009.gif) 1 hexanes
1 hexanes![[thin space (1/6-em)]](https://www.rsc.org/images/entities/char_2009.gif) :
:![[thin space (1/6-em)]](https://www.rsc.org/images/entities/char_2009.gif) ethyl acetate) until no 8 remained (approximately 17 h). The reaction was cooled to room temperature and the volatiles removed. The mixture was purified with a silica column (4
ethyl acetate) until no 8 remained (approximately 17 h). The reaction was cooled to room temperature and the volatiles removed. The mixture was purified with a silica column (4![[thin space (1/6-em)]](https://www.rsc.org/images/entities/char_2009.gif) :
:![[thin space (1/6-em)]](https://www.rsc.org/images/entities/char_2009.gif) 1 gradient to 3
1 gradient to 3![[thin space (1/6-em)]](https://www.rsc.org/images/entities/char_2009.gif) :
:![[thin space (1/6-em)]](https://www.rsc.org/images/entities/char_2009.gif) 1 hexanes
1 hexanes![[thin space (1/6-em)]](https://www.rsc.org/images/entities/char_2009.gif) :
:![[thin space (1/6-em)]](https://www.rsc.org/images/entities/char_2009.gif) dichloromethane). The product was isolated as a red solid (15 mg, 23%). 1H NMR (400 MHz, CD2Cl2): δ 8.14 (s, 4H), 7.90 (s, 2H), 7.48–7.41 (m, 8H), 7.17 (t, J = 7.7 Hz, 4H), 1.75 (s, 24H), 1.65 (s, 12H). 13C{1H} NMR (101 MHz, CD2Cl2): δ 154.83, 132.61, 132.37, 132.07, 132.04, 130.43, 130.40, 130.38, 127.31, 125.15, 124.13, 124.05, 123.54, 36.12, 35.91, 33.64, 33.36. HRMS (FD-TOF) m/z: M˙+ calculated for [C60H54N4S]˙+ 862.40692; found 862.40642; difference −0.57 ppm.
dichloromethane). The product was isolated as a red solid (15 mg, 23%). 1H NMR (400 MHz, CD2Cl2): δ 8.14 (s, 4H), 7.90 (s, 2H), 7.48–7.41 (m, 8H), 7.17 (t, J = 7.7 Hz, 4H), 1.75 (s, 24H), 1.65 (s, 12H). 13C{1H} NMR (101 MHz, CD2Cl2): δ 154.83, 132.61, 132.37, 132.07, 132.04, 130.43, 130.40, 130.38, 127.31, 125.15, 124.13, 124.05, 123.54, 36.12, 35.91, 33.64, 33.36. HRMS (FD-TOF) m/z: M˙+ calculated for [C60H54N4S]˙+ 862.40692; found 862.40642; difference −0.57 ppm.
Polymer dot synthesis
4e, f, or 9 (1.2 mg) and Pluronic F127 (14 mg) were dissolved in 2.4 mL of CHCl3. Volatiles were completely removed in vacuo. 1.7 mL of deionized water was then added to 1.2 mg of the obtained solid and the mixture was sonicated for 5 min. This dispersion was then used without any further purification.Conflicts of interest
There are no conflicts to declare.References
- G. Niu, R. Zhang, J. P. C. Kwong, J. W. Y. Lam, C. Chen, J. Wang, Y. Chen, X. Feng, R. T. K. Kwok, H. H.-Y. Sung, I. D. Williams, M. R. J. Elsegood, J. Qu, C. Ma, K. S. Wong, X. Yu and B. Z. Tang, Chem. Mater., 2018, 30, 4778–4787 CrossRef CAS.
- B. Situ, M. Gao, X. He, S. Li, B. He, F. Guo, C. Kang, S. Liu, L. Yang, M. Jiang, Y. Hu, B. Z. Tang and L. Zheng, Mater. Horiz., 2019, 6, 546–553 RSC.
- C. Tang, Q. Zheng, H. Zhu, L. Wang, S.-C. Chen, E. Ma and X. Chen, J. Mater. Chem. C, 2013, 1, 1771 RSC.
- T.-C. Lin, Y.-F. Chen, C.-L. Hu and C.-S. Hsu, J. Mater. Chem., 2009, 19, 7075 RSC.
- J. H. Strickler and W. W. Webb, Opt. Lett., 1991, 16, 1780 CrossRef CAS PubMed.
- B. H. Cumpston, S. P. Ananthavel, S. Barlow, D. L. Dyer, J. E. Ehrlich, L. L. Erskine, A. A. Heikal, S. M. Kuebler, I.-Y. S. Lee, D. McCord-Maughon, J. Qin, H. Röckel, M. Rumi, X.-L. Wu, S. R. Marder and J. W. Perry, Nature, 1999, 398, 51–54 CrossRef CAS.
- F. Terenziani, C. Katan, E. Badaeva, S. Tretiak and M. Blanchard-Desce, Adv. Mater., 2008, 20, 4641–4678 CrossRef CAS.
- M. Pawlicki, H. A. Collins, R. G. Denning and H. L. Anderson, Angew. Chem., Int. Ed., 2009, 48, 3244–3266 CrossRef CAS PubMed.
- R. Weissleder, Nat. Biotechnol., 2001, 19, 316–317 CrossRef CAS PubMed.
- A. M. Smith, M. C. Mancini and S. Nie, Nat. Nanotechnol., 2009, 4, 710–711 CrossRef CAS PubMed.
- H. M. Kim and B. R. Cho, Chem. Rev., 2015, 115, 5014–5055 CrossRef CAS PubMed.
- T. He, S. Sreejith, Y. Gao, A. C. Grimsdale, Y. Zhao, X. Lin and H. Sun, Appl. Phys. Lett., 2015, 106, 111904 CrossRef.
- T. He, Y. Wang, X. Tian, Y. Gao, X. Zhao, A. C. Grimsdale, X. Lin and H. Sun, Appl. Phys. Lett., 2016, 108, 011901 CrossRef.
- K. S. Kim, J. M. Lim, A. Osuka and D. Kim, J. Photochem. Photobiol., C, 2008, 9, 13–28 CrossRef CAS.
- P. C. Ray and Z. Sainudeen, J. Phys. Chem. A, 2006, 110, 12342–12347 CrossRef CAS PubMed.
- F. Ricci, F. Elisei, P. Foggi, A. Marrocchi, A. Spalletti and B. Carlotti, J. Phys. Chem. C, 2016, 120, 23726–23739 CrossRef CAS.
- S. Yao, B. Kim, X. Yue, M. Y. Colon Gomez, M. V. Bondar and K. D. Belfield, ACS Omega, 2016, 1, 1149–1156 CrossRef CAS PubMed.
- S. Kato, T. Matsumoto, M. Shigeiwa, H. Gorohmaru, S. Maeda, T. Ishi-i and S. Mataka, Chem. – Eur. J., 2006, 12, 2303–2317 CrossRef CAS PubMed.
- B. A. D. Neto, A. A. M. Lapis, E. N. da Silva Júnior and J. Dupont, Eur. J. Org. Chem., 2013, 228–255 CrossRef CAS.
- B. A. D. Neto, P. H. P. R. Carvalho and J. R. Correa, Acc. Chem. Res., 2015, 48, 1560–1569 CrossRef CAS PubMed.
- F. S. Mancilha, B. A. DaSilveira Neto, A. S. Lopes, P. F. Moreira, F. H. Quina, R. S. Gonçalves and J. Dupont, Eur. J. Org. Chem., 2006, 4924–4933 CrossRef CAS.
- Y. Wang, M. Chen, N. Alifu, S. Li, W. Qin, A. Qin, B. Z. Tang and J. Qian, ACS Nano, 2017, 11, 10452–10461 CrossRef CAS PubMed.
- W. Qin, P. Zhang, H. Li, J. W. Y. Lam, Y. Cai, R. T. K. Kwok, J. Qian, W. Zheng and B. Z. Tang, Chem. Sci., 2018, 9, 2705–2710 RSC.
- L. Lu, T. Zheng, Q. Wu, A. M. Schneider, D. Zhao and L. Yu, Chem. Rev., 2015, 115, 12666–12731 CrossRef CAS PubMed.
- S. Kato, T. Matsumoto, T. Ishi-i, T. Thiemann, M. Shigeiwa, H. Gorohmaru, S. Maeda, Y. Yamashita and S. Mataka, Chem. Commun., 2004, 2342–2343 RSC.
- N. S. Makarov, S. Mukhopadhyay, K. Yesudas, J.-L. Brédas, J. W. Perry, A. Pron, M. Kivala and K. Müllen, J. Phys. Chem. A, 2012, 116, 3781–3793 CrossRef CAS PubMed.
- Z. Fang, T.-L. Teo, L. Cai, Y.-H. Lai, A. Samoc and M. Samoc, Org. Lett., 2009, 11, 1–4 CrossRef CAS PubMed.
- Z. Fang, X. Zhang, Y. Hing Lai and B. Liu, Chem. Commun., 2009, 920 RSC.
- Z. Fang, R. D. Webster, M. Samoc and Y. H. Lai, RSC Adv., 2013, 3, 17914–17917 RSC.
- Z. Fang, V. Chellappan, R. D. Webster, L. Ke, T. Zhang, B. Liu and Y.-H. Lai, J. Mater. Chem., 2012, 22, 15397 RSC.
- H. Sun, C. Zhong and J.-L. Brédas, J. Chem. Theory Comput., 2015, 11, 3851–3858 CrossRef CAS PubMed.
- L. Kronik, T. Stein, S. Refaely-Abramson and R. Baer, J. Chem. Theory Comput., 2012, 8, 1515–1531 CrossRef CAS PubMed.
- X.-K. Chen, D. Kim and J.-L. Brédas, Acc. Chem. Res., 2018, 51, 2215–2224 CrossRef CAS PubMed.
- A. Chantzis, A. D. Laurent, C. Adamo and D. Jacquemin, J. Chem. Theory Comput., 2013, 9, 4517–4525 CrossRef CAS PubMed.
- J. Mei, N. L. C. Leung, R. T. K. Kwok, J. W. Y. Lam and B. Z. Tang, Chem. Rev., 2015, 115, 11718–11940 CrossRef CAS PubMed.
- M. K. Etherington, F. Franchello, J. Gibson, T. Northey, J. Santos, J. S. Ward, H. F. Higginbotham, P. Data, A. Kurowska, P. L. Dos Santos, D. R. Graves, A. S. Batsanov, F. B. Dias, M. R. Bryce, T. J. Penfold and A. P. Monkman, Nat. Commun., 2017, 8, 14987 CrossRef PubMed.
- I. Marghad, F. Bencheikh, C. Wang, S. Manolikakes, A. Rérat, C. Gosmini, D. H. Kim, J.-C. Ribierre and C. Adachi, RSC Adv., 2019, 9, 4336–4343 Search PubMed.
- R. S. Nobuyasu, J. S. Ward, J. Gibson, B. A. Laidlaw, Z. Ren, P. Data, A. S. Batsanov, T. J. Penfold, M. R. Bryce and F. B. Dias, J. Mater. Chem. C, 2019, 7, 6672–6684 RSC.
- M. K. Etherington, F. Franchello, J. Gibson, T. Northey, J. Santos, J. S. Ward, H. F. Higginbotham, P. Data, A. Kurowska, P. L. Dos Santos, D. R. Graves, A. S. Batsanov, F. B. Dias, M. R. Bryce, T. J. Penfold and A. P. Monkman, Nat. Commun., 2017, 8, 14987 CrossRef PubMed.
- L. Yao, S. Zhang, R. Wang, W. Li, F. Shen, B. Yang and Y. Ma, Angew. Chem., Int. Ed., 2014, 53, 2119–2123 CrossRef CAS PubMed.
- N. S. Makarov, M. Drobizhev and A. Rebane, Opt. Express, 2008, 16, 4029 CrossRef CAS PubMed.
- J. Yu, Y. Rong, C.-T. Kuo, X.-H. Zhou and D. T. Chiu, Anal. Chem., 2017, 89, 42–56 CrossRef CAS PubMed.
- S.-Y. Kuo, H.-H. Li, P.-J. Wu, C.-P. Chen, Y.-C. Huang and Y.-H. Chan, Anal. Chem., 2015, 87, 4765–4771 CrossRef CAS PubMed.
- M. Massey, M. Wu, E. M. Conroy and W. R. Algar, Curr. Opin. Biotechnol., 2015, 34, 30–40 CrossRef CAS PubMed.
- N. R. Paisley, C. M. Tonge, E. R. Sauvé, S. V. Halldorson and Z. M. Hudson, J. Polym. Sci., Part A: Polym. Chem., 2018, 56, 2183–2191 CrossRef CAS.
- E. Shi, H. Zhuang, Z. Liu, X. Cheng, H. Hu, N. Li, D. Chen, Q. Xu, J. He, H. Li, J. Lu and J. Zheng, Dyes Pigm., 2015, 122, 66–73 CrossRef CAS.
- C. Dai, D. Yang, W. Zhang, B. Bao, Y. Cheng and L. Wang, Polym. Chem., 2015, 6, 3962–3969 RSC.
- Z. Ni, H. Wang, Q. Zhao, J. Zhang, Z. Wei, H. Dong and W. Hu, Adv. Mater., 2019, 31, 1806010 CrossRef PubMed.
- S. S. Reddy, V. G. Sree, K. Gunasekar, W. Cho, Y.-S. Gal, M. Song, J.-W. Kang and S.-H. Jin, Adv. Opt. Mater., 2016, 4, 1236–1246 CrossRef CAS.
- X.-Q. Zhu, Z. Dai, A. Yu, S. Wu and J.-P. Cheng, J. Phys. Chem. B, 2008, 112, 11694–11707 CrossRef CAS PubMed.
- H. Liu, G. Cheng, D. Hu, F. Shen, Y. Lv, G. Sun, B. Yang, P. Lu and Y. Ma, Adv. Funct. Mater., 2012, 22, 2830–2836 CrossRef CAS.
- E. R. Sauvé, J. Paeng, S. Yamaguchi and Z. M. Hudson, J. Org. Chem., 2019 DOI:10.1021/acs.joc.9b02283.
- Z. Fang, T.-L. Teo, L. Cai, Y.-H. Lai, A. Samoc and M. Samoc, Org. Lett., 2009, 11, 1–4 CrossRef CAS PubMed.
- G. M. Sheldrick, Acta Crystallogr., Sect. A: Found. Adv., 2015, 71, 3–8 CrossRef PubMed.
- O. V. Dolomanov, L. J. Bourhis, R. J. Gildea, J. A. K. Howard and H. Puschmann, J. Appl. Crystallogr., 2009, 42, 339–341 CrossRef CAS.
- G. M. Sheldrick, Acta Crystallogr., Sect. C: Struct. Chem., 2015, 71, 3–8 Search PubMed.
- F. Ni, Z. Wu, Z. Zhu, T. Chen, K. Wu, C. Zhong, K. An, D. Wei, D. Ma and C. Yang, J. Mater. Chem. C, 2017, 5, 1363–1368 RSC.
Footnote |
| † Electronic supplementary information (ESI) available. CCDC 1953988–1953990. For ESI and crystallographic data in CIF or other electronic format see DOI: 10.1039/c9qm00627c |
| This journal is © the Partner Organisations 2020 |

