The formation mechanism and fluorophores of carbon dots synthesized via a bottom-up route
Dan
Qu
 and
Zaicheng
Sun
 *
*
Center of Excellence for Environmental Safety and Biological Effects, Beijing Key Laboratory of Green Catalysis and Separation, Department of Chemistry and Chemical Engineering, School of Environmental and Energy, Beijing University of Technology, 100 Pingleyuan, Chaoyang District, Beijing 100124, P. R. China. E-mail: sunzc@bjut.edu.cn
First published on 24th October 2019
Abstract
Carbon dots (CDs) with incomparable optical properties have attracted extensive attention. However, some unclear issues remain, which has impeded the basic understanding and practical application of CDs. The formation process and chemical structure of CDs are critical factors for understanding their optical properties. In this review, recent progress in the formation and fluorophores of CDs is summarized and discussed, which draws a clear picture of related research and indicates a promising future for further studies.
Introduction
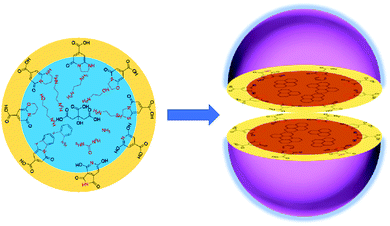
Carbon dots (CDs, encompassing carbon nanodots, C-dots, carbon quantum dots, and graphene quantum dots in this context) have been significantly developed since their discovery in 2004 due to their unique properties and promising potential application.1,2 Carbon is generally the main component of CDs; thus, they have very low cytotoxicity and high biocompatibility. They can emit multiple-colored light in the visible light region because they contain both assorted conjugated and abundant surface groups, which are beneficial for functionalization for different applications, such as for use in light-emitting diodes (LEDs), photovoltaic cells, catalysts, fluorescent sensors, bio-imaging agents, and nanomedicines.3–8 Recently, great progress has been made in the synthesis of red and near-infrared emissive CDs via a bottom-up route, which will further extend the applications of CDs to new fields. It is well known that the typical structure of CDs is treated as a core/shell model that is composed of a carbon core containing graphitic fragments and a shell made of various surface functional groups (Scheme 1). The photoluminescence originated from the conjugated fragments of the core and/or surface chromophore groups. Although many reviews on the synthesis route, properties, and applications of CDs have been published, their formation process and fluorophores remain obscure. For example, it is unknown how to form the conjugated unit from a non-conjugated molecule, e.g., citric acid, as is the fluorophore group on the surface. To address these questions, the formation mechanism must be fully understood, as it will aid in the understanding of the composition, structure, and photoluminescence origin of CDs. In this review, recent works on the study of the synthesis mechanism of CDs via a bottom-up route are summarized. The authors hope that this review will provide the readers with a clear development route that benefits the future design of CDs.CDs synthesized via a bottom-up route are divided into two categories based on the corresponding precursors: those synthesized from non-conjugated molecules and those from conjugated molecules. In the former case, the reactants, such as citric acid, are the non-conjugated molecules, whereas in the latter case, the precursors are usually aromatic molecules.
Non-conjugated molecule-based CDs
In 2008, Bourlinos et al.9,10 reported the formation of fluorescent carbogenic dots from citric acid (CA) and alkyl amine via a pyrolytic process. Since then, CA has become a common and effective carbon source for the preparation of CDs,11,12 although other types of carbon sources, such as organic molecules, organic solvents, sugars, and other biomasses, are extensively employed.13–19 Until the past 2–3 years, few research groups had devoted themselves to these fields, and a better overview of CDs than what existed before has emerged.1. Citric acid and ammonia
As per the preceding claim, CA has been extensively used for the synthesis of CDs, and is thus treated as a model non-conjugated molecule. Ammonia is the simplest amine that can be employed in the synthesis of CDs. As early as 1884 and 1894, Behrmann et al. and Sell et al. investigated the reaction of CA with ammonia or urea, which can release ammonia during the heating process,20,21 and indicated the formation of the fluorophore citrazinic acid via the reaction. Reckmeier et al. synthesized CDs from CA and ammonia via hydrothermal reaction and the ammonothermal (supercritical ammonia) method.22 By comparing the optical properties of CDs and citrazinic acid, they confirmed that CDs can be identified as amorphous aggregates of molecular fluorophores based on citrazinic acid derivatives. Schneider et al. investigated the reactions of CA with ethylenediamine (EDA), hexamethylenetetramine (HMTA), and triethanolamine (TEOA).23 The EDA-CDs exhibited strong blue emission with a PL QY of 53% because the fluorophore imidazo[1,2-a]pyridine-7-carboxylic acid (IPCA) was generated in the reaction.24 HMTA can release ammonia at elevated temperatures, and citrazinic acid derivatives might be produced from CA and ammonia during the reaction (Scheme 2). However, the fluorophore formation was lower than that in the reaction of CA with EDA because of the slow decomposition and low nucleophilic strength of NH3. This is the reason why the HMTA-CDs exhibited a weaker fluorescence with a PL QY of 17%. The reaction between CA and TEOA could not produce a similar fluorophore due to the tertiary amines in the reaction. Therefore, citrazinic acid derivatives are the main contributors to the PL of CDs.2. Citric acid and ethanolamine
In 2011, Krysmann et al. investigated the pyrolytic carbonization of CA in ethanolamine (EA).25 They obtained three distinct photoluminescent species that are associated with three different stages of the pyrolytic process. At the low-temperature stage (<180 °C), carbogenic nanoparticles were produced with strong PL, which was assigned to the organic fluorophores. The spectral analyses, including those of FTIR (Fig. 1B), NMR (Fig. 1C), ESI-MS (Fig. 1D), XPS, and UV-vis spectra, revealed an amide functional group in the product formed by a simple condensation reaction between CA and EA molecules (Fig. 1A). This was further confirmed by the dehydration of tris(2-hydroxyethyl)ammonium citrate salt at 140 °C under vacuum. The same fluorescent species were obtained with excitation-independent PL at 455 nm with excitation at 375 nm and a high quantum yield (QY = ∼50%). Hu et al.26 investigated the heating process from room temperature to 170 °C, and the maintenance of 170 °C for different time periods. They found that polymer nanoparticles ∼150 nm in diameter were initially formed at a temperature of 130 °C. With the increase of the temperature, the polymer nanoparticles began to shrink to ∼60 nm due to dehydration. When the temperature reached 170 °C, many CD seeds with diameters of ∼1.5 nm could be found in the shrunken polymer nanoparticles. After 10 minutes, the polymer fragments vanished, and CD particles ∼3.5 nm in size could be found (Fig. 1E). Excitation-independent emission was observed after the formation of the nuclei of CDs. The CDs were formed with the extension of the reaction time.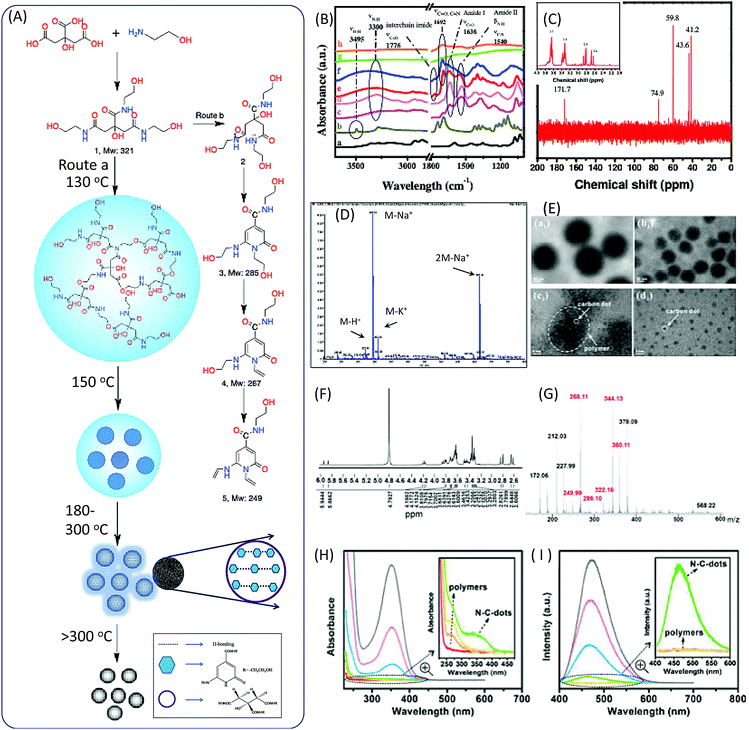 | ||
| Fig. 1 (A) The scheme of the preparation of CDs from CA and EA. (B) FTIR spectra of (a) CA, (b) EA, (c) CDs prepared at different temperature 180 °C, the PL parts at (d) 180 °C, (e) 230 °C, (f) 300 °C, and (g) 400 °C, and (h) the oxidized part at 400 °C. (C) 1H-NMR (inset) and 13C-NMR spectra of the PL part of CDs prepared at 180 °C. (D) ESI-MS spectrum of the PL part of CDs prepared at 180 °C.25 (E) TEM images of the products at different reaction stages. The temperature reached (a1) 130 °C, (b1) 150 °C, and (c2) 170 °C, and (d2) was maintained at 170 °C for 10 min.26 (F) MALDI MS and (G) 1H NMR of purified CDs prepared by reflux at 180 °C.27 The (H) adsorption and (I) PL emission of the reaction product of CA and EA at different temperatures (red: room temperature, orange: 130 °C, yellow: 150 °C, green: 170 °C, blue: 170 °C for 2 min, pink: 170 °C for 5 min, and gray: 170 °C for 10 min); the insets show the enlarged UV-vis adsorption and PL spectra.26 | ||
Das et al. analyzed the spectra of CDs prepared from CA and EA.27 FTIR spectra confirmed the presence of functional groups including –OH (stretching, 3150–3550 cm−1), sp2 C–H (stretching, 3100 cm−1), sp3 C–H (asymmetric stretching, 2940 cm−1, and symmetric stretching, 2882 cm−1), >C![[double bond, length as m-dash]](https://www.rsc.org/images/entities/char_e001.gif) O stretching and –NH bending in amides (1635 and 1540 cm−1), the stretching of sp2 C (1422 cm−1), and different vibration modes of –C–N– and –C–O (1355, 1231 and 1055 cm−1). 1H NMR spectra provided more evidence for the chemical structures. The chemical shifts of 1H NMR in the region from 8.0307 to 7.68 ppm corresponded to H-bond amide protons, which were similar to that of –CO–NH–CH2. The peaks at 6.33 and 5.72 ppm were associated with hydroxyl (–OH) protons, and the peaks at 5.87 and 5.63 ppm corresponded to protons attached to sp2 carbon. A small peak at 4.7 ppm was attributed to the proton attached to the nitrogen. The triplet peaks ranging from 4.90 to 3.57 ppm, and multiple peaks from 3.28 to 3.08 ppm, corresponded to protons of the methylene group (–CH2), which attached to O and N atoms in the EA moieties. The AB quartet-type signal from 2.54 to 2.41 corresponded to the methylene group protons of CA (Fig. 1F). The mass spectrum and m/z value are presented in Fig. 1G, and the peaks related to the CDs are marked in red. The value of m/z = 322 is related to the proton product 1a, which is in agreement with Krysmann's report.25 The peak at m/z = 286 indicates the presence of 2-pyridone derivatives, which are proposed as the fluorophores for the CDs. They can further lose water to produce product 1c, the m/z values of which are 268.11 and 249.99, corresponding to points 4 and 5 in Fig. 1A. The UV-vis and PL emission spectra of the reaction solution at different stages are presented in Fig. 1H and I. A new absorption band and emission band appeared after the formation of the citrazinic acid derivatives (4 and 5).
O stretching and –NH bending in amides (1635 and 1540 cm−1), the stretching of sp2 C (1422 cm−1), and different vibration modes of –C–N– and –C–O (1355, 1231 and 1055 cm−1). 1H NMR spectra provided more evidence for the chemical structures. The chemical shifts of 1H NMR in the region from 8.0307 to 7.68 ppm corresponded to H-bond amide protons, which were similar to that of –CO–NH–CH2. The peaks at 6.33 and 5.72 ppm were associated with hydroxyl (–OH) protons, and the peaks at 5.87 and 5.63 ppm corresponded to protons attached to sp2 carbon. A small peak at 4.7 ppm was attributed to the proton attached to the nitrogen. The triplet peaks ranging from 4.90 to 3.57 ppm, and multiple peaks from 3.28 to 3.08 ppm, corresponded to protons of the methylene group (–CH2), which attached to O and N atoms in the EA moieties. The AB quartet-type signal from 2.54 to 2.41 corresponded to the methylene group protons of CA (Fig. 1F). The mass spectrum and m/z value are presented in Fig. 1G, and the peaks related to the CDs are marked in red. The value of m/z = 322 is related to the proton product 1a, which is in agreement with Krysmann's report.25 The peak at m/z = 286 indicates the presence of 2-pyridone derivatives, which are proposed as the fluorophores for the CDs. They can further lose water to produce product 1c, the m/z values of which are 268.11 and 249.99, corresponding to points 4 and 5 in Fig. 1A. The UV-vis and PL emission spectra of the reaction solution at different stages are presented in Fig. 1H and I. A new absorption band and emission band appeared after the formation of the citrazinic acid derivatives (4 and 5).
Fluorescent CDs were formed when the temperature was above 230 °C for 30 minutes.25 The PL QY of CDs with excitation-independent emission was about 15%, which is much lower than that of the liquid formed at 180 °C. Further pyrolysis at a higher temperature (300 °C) resulted in the formation of CDs with excitation-dependent emission. The PL intensity and QY were dramatically decreased. The FTIR spectra indicate that imide groups were formed in the CDs. The Raman spectra show a strong G band at 1595 cm−1 in the CDs, indicating the sp2 domain embedded in the amorphous carbon (sp3 C) matrix. The authors proposed that the PL behavior of amorphous/disordered graphite containing a mixture of sp2 and sp3 carbons could be attributed to the photogeneration of electron–hole pairs; this could have induced the radiative recombination of the trap carriers localized within small sp2 carbon clusters that were surrounded by sp3 defects, which is a mechanism that can remain active in the presence of heteroatoms. The formation of larger and non-uniform particles with diameters of a few hundred nanometers occurred due to aggregation. The PL emission completely vanished when the reaction temperature reached 400 °C.
The overall formation process is illustrated in Fig. 1A. The polymer nanoparticles were first formed between the CA and amine, followed by the formation of citrazinic acid derivatives that exhibited strong fluorescence. CDs with a graphitic core were produced, and contained some aggregates of citrazinic acid derivatives with the extension of carbonization. At the same time, the organic functional groups were left on the surface due to incomplete carbonization. The citrazinic acid derivatives were assigned as the fluorophores in the CDs.
3. Citric acid and ethylenediamine (EDA)
In 2013, Zhu et al. reported highly fluorescent CDs prepared from CA and EDA, the PL QY of which could attain 80% and even higher.28,29 Thus, this method has attracted more attention in order to better understand the reaction process. Zhu et al. proposed a reaction process that includes obtaining branched polymers via amidation reaction, and then partial carbonization to form graphitic fragments in the amorphous carbonic matrix (Fig. 2A). First, the amide group forms between CA and EDA because CA has three carboxylic acid groups and EDA has two amine groups. Due to the abundant carboxylic acid and amine groups, CA and EDA can react and form either linear30 or cross-linked24 polymers via dehydration and condensation depending on the ratio of CA to EDA. Vallan et al. investigated CDs prepared from CA and EDA (molar ratio 1![[thin space (1/6-em)]](https://www.rsc.org/images/entities/char_2009.gif) :
:![[thin space (1/6-em)]](https://www.rsc.org/images/entities/char_2009.gif) 1) in water via microwave methods.30 Two types of CDs were synthesized from EDA and either CA or tricarballylic acid (TA), and are denoted as CD1 and CD2, respectively. The third type of CD, CD3, was obtained from EDA and CA via coupling reaction in the presence of N,N′-diisopropylcarbodiimide at room temperature (Fig. 2B). These 3 types of CDs exhibited similar optical properties, as determined by UV-vis and PL spectra. FTIR disclosed that most of the carboxylic groups were involved in H-bonds (peak I1710 > I1780), and that the amide peaks at 1653 and 1560 cm−1 shifted; this was comparable to the peptide, indicating that the amide groups were engaged in H-bonds that strengthened the rigidity of the polymer. Detailed NMR spectroscopy was carried out to reveal the chemical structure. A comparison of the 1H and 13C {1H} attached proton test (APT) NMR spectra is presented in Fig. 2C–E. In the 1H NMR spectra, the sharp line shape of the peaks suggests a compact and static structure. The 1H–13C HSQC spectra demonstrate that methylene carbons coupled with a rather condensed set of proton signals. The density of the sharp signals is related to the variety of static chemical environments that surrounded these protons, and can be assigned to the presence of various chain isomers of the repetitive unit that coexisted in the polymer. These three types of CDs exhibited similar NMR spectra, which indicates that the chemical structures of these three CDs can be identified as non-conjugated polymers consisting of the product of the condensation of CA (TA) and EDA. Yang et al. thought that the polymer was highly branched, as an excess amount of EDA was employed in the reaction.28 Furthermore, a certain degree of carbonization produced some conjugated fragments in the entangled polymer chains. The carbonization degree is strongly dependent on the reaction conditions. TEM and HR TEM images of the CDs are presented in Fig. 2F, and have a uniform dispersion without apparent aggregation and particle diameters of 2–6 nm. The XRD pattern exhibits a broad diffraction peak at 25 °C corresponding to 0.34 nm, indicating a highly dispersed arrangement of carbon atoms. The Raman spectra also show the presence of a disordered and graphitic band. The chemical shift from 7 to 9 ppm proves the existence of sp2 C in the 1H NMR spectrum (Fig. 2G). In the 13C NMR spectrum (Fig. 2H), signals from 30 to 45 ppm, which are assigned to sp3 carbon atoms, and signals from 100 to 185 ppm, which are indicative of sp2 carbon, can be observed. Moreover, the X-ray photoelectron spectra also show the presence of sp2 C, sp3 C, and oxygenated C. The FTIR spectra show the presence of OH, COOH, and NH2 groups. However, the defined chemical structure remains unclear, which results in poor reproducibility from batch to batch.
1) in water via microwave methods.30 Two types of CDs were synthesized from EDA and either CA or tricarballylic acid (TA), and are denoted as CD1 and CD2, respectively. The third type of CD, CD3, was obtained from EDA and CA via coupling reaction in the presence of N,N′-diisopropylcarbodiimide at room temperature (Fig. 2B). These 3 types of CDs exhibited similar optical properties, as determined by UV-vis and PL spectra. FTIR disclosed that most of the carboxylic groups were involved in H-bonds (peak I1710 > I1780), and that the amide peaks at 1653 and 1560 cm−1 shifted; this was comparable to the peptide, indicating that the amide groups were engaged in H-bonds that strengthened the rigidity of the polymer. Detailed NMR spectroscopy was carried out to reveal the chemical structure. A comparison of the 1H and 13C {1H} attached proton test (APT) NMR spectra is presented in Fig. 2C–E. In the 1H NMR spectra, the sharp line shape of the peaks suggests a compact and static structure. The 1H–13C HSQC spectra demonstrate that methylene carbons coupled with a rather condensed set of proton signals. The density of the sharp signals is related to the variety of static chemical environments that surrounded these protons, and can be assigned to the presence of various chain isomers of the repetitive unit that coexisted in the polymer. These three types of CDs exhibited similar NMR spectra, which indicates that the chemical structures of these three CDs can be identified as non-conjugated polymers consisting of the product of the condensation of CA (TA) and EDA. Yang et al. thought that the polymer was highly branched, as an excess amount of EDA was employed in the reaction.28 Furthermore, a certain degree of carbonization produced some conjugated fragments in the entangled polymer chains. The carbonization degree is strongly dependent on the reaction conditions. TEM and HR TEM images of the CDs are presented in Fig. 2F, and have a uniform dispersion without apparent aggregation and particle diameters of 2–6 nm. The XRD pattern exhibits a broad diffraction peak at 25 °C corresponding to 0.34 nm, indicating a highly dispersed arrangement of carbon atoms. The Raman spectra also show the presence of a disordered and graphitic band. The chemical shift from 7 to 9 ppm proves the existence of sp2 C in the 1H NMR spectrum (Fig. 2G). In the 13C NMR spectrum (Fig. 2H), signals from 30 to 45 ppm, which are assigned to sp3 carbon atoms, and signals from 100 to 185 ppm, which are indicative of sp2 carbon, can be observed. Moreover, the X-ray photoelectron spectra also show the presence of sp2 C, sp3 C, and oxygenated C. The FTIR spectra show the presence of OH, COOH, and NH2 groups. However, the defined chemical structure remains unclear, which results in poor reproducibility from batch to batch.
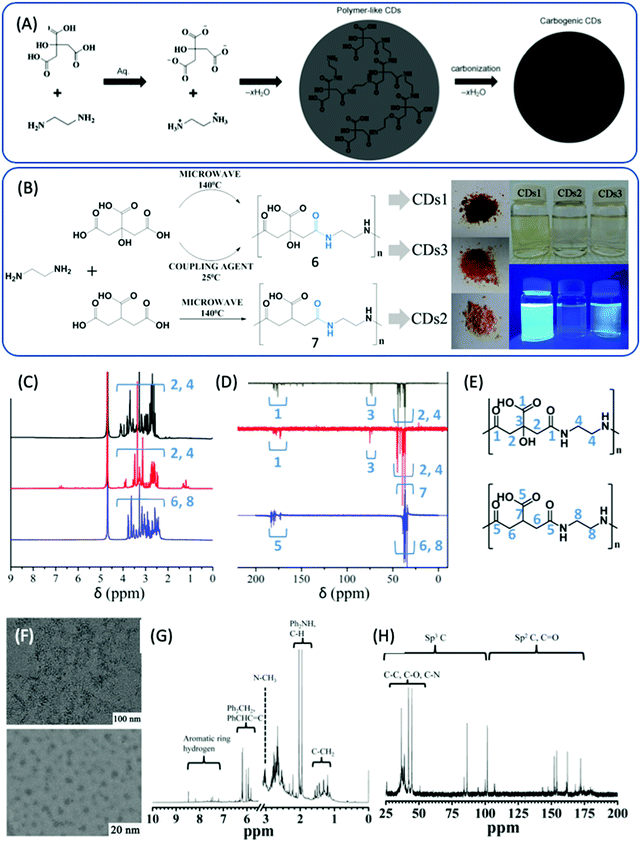 | ||
| Fig. 2 (A) The schematic graph of the formation process of CDs from CA and EDA.28 (B) The reaction of EDA and CA and TA under different conditions to produce three types of CDs. (C) 1H NMR and (D) 13C {1H} (APT) NMR of CDs1 (black), CDs2 (blue), and CDs3 (red). (E) Chain isomers for the signal attribution of the top (CDs1, CDs3) and bottom (CDs2).30 (F) Typical TEM (top) and HR-TEM (bottom) images of CDs. (G) 1H NMR and (H) 13C NMR spectra of CDs.28 | ||
Polymer CDs with blue emission were obtained in the studies by Yang16,31,32 and Vallan, and a cross-link-enhanced emission (CEE) effect for the generation of emission without conjugated units was proposed.33–37 Vallan et al. carried out density function theoretical (DFT) calculations on dimer (n = 2) and decamer (n = 10) chain configurations (Fig. 3A and B), which exhibited highly intricate structures due to the rigid entanglement of the chain as a result of intramolecular hydrogen bonding (HB). This limited the vibration and/or rotation, and enhanced the radiative relaxation process. Fig. 3C and D display the HOMO and LUMO of the dimer, respectively. The amide unit (–CONH–) primarily contributed to the HOMO, while the LUMO was attributed to the carboxylic groups (–COOH). The photoinduced charge transfer between these spatially separated groups in the entangled chain can be identified as the origin of fluorescence phenomena in the polymer CDs. This provides an explanation for the fluorescence origin of the polymer dots.
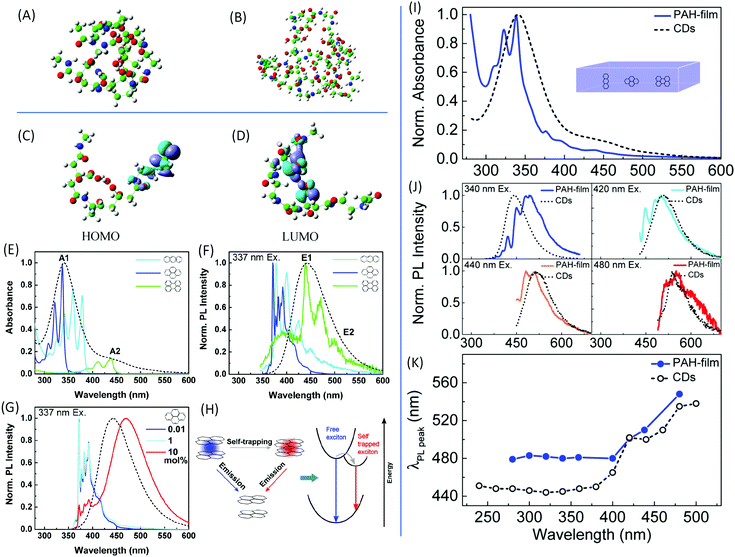 | ||
Fig. 3 DFT calculations of the optimized molecular structures of the (A) two-dimer chain and (B) one-decamer chain. (C) HOMO and (D) LUMO involved in the fluorescence phenomenon.30 (E) UV-vis absorption and (F) normalized PL emission spectra upon excitation at 337 nm of anthracene (light blue), pyrene (dark blue), and perylene (green) dispersed in the PMMA matrix with concentrations of 0.01 mol%, as well as of CDs in aqueous solution (black dashed line). (G) Normalized PL spectra of pyrene in PMMA film excited at 337 nm with different pyrene concentrations. (H) Scheme of the exciton self-trapping process in a pyrene molecule pair: a free exciton (blue spot) that may be self-trapped on a molecule pair as a self-trapped exciton (red spot), causing the reduction of energy mobility. (I) Normalized absorption spectra of a PMMA film containing a blend of PAHs (blue) with a molecular ratio of 10![[thin space (1/6-em)]](https://www.rsc.org/images/entities/char_2009.gif) : :![[thin space (1/6-em)]](https://www.rsc.org/images/entities/char_2009.gif) 10 10![[thin space (1/6-em)]](https://www.rsc.org/images/entities/char_2009.gif) : :![[thin space (1/6-em)]](https://www.rsc.org/images/entities/char_2009.gif) 1 1![[thin space (1/6-em)]](https://www.rsc.org/images/entities/char_2009.gif) : :![[thin space (1/6-em)]](https://www.rsc.org/images/entities/char_2009.gif) 20 anthracene/pyrene/perylene/PMMA monomer unit, and of the CDs in aqueous solution (black dashed line). (J) Normalized PL spectra of the same samples excited at different wavelengths with the CDs’ PL spectra (black dashed line) as references. (K) PL peak wavelength as a function of the excitation wavelength of the same samples as in (I) and (J).39 20 anthracene/pyrene/perylene/PMMA monomer unit, and of the CDs in aqueous solution (black dashed line). (J) Normalized PL spectra of the same samples excited at different wavelengths with the CDs’ PL spectra (black dashed line) as references. (K) PL peak wavelength as a function of the excitation wavelength of the same samples as in (I) and (J).39 | ||
In general, the formation of CDs does not stop in the stage of polymer dots; they are formed in the further carbonization process. CD nanoparticles are treated as having a carbon core with surface groups; thus, they may contain multichromophoric units.38 The core is composed of an sp2 hybridized carbon domain embedded in an sp3 hybridized matrix, which is the source of the main absorption feature in the UV region. To mimic the CDs, Fu et al. chose three basic polycyclic aromatic hydrocarbons (PAHs), anthracene (3 rings), pyrene (4 rings), and perylene (5 rings), to represent the sp2 domain.39 Poly(methyl methacrylate) (PMMA) was employed to simulate the sp3 domain; 0.01 mol% of PMMA monomer units was added into the PMMA film. The absorption and PL spectra, together with those of the CDs, are presented in Fig. 3E and F. The absorbances of pyrene and anthracene are located at the main absorption peak A1, while that of perylene coincides with the absorption shoulder A2. PL from the films demonstrates that the perylene emission overlapped with the maximum emission of the CDs, while the emissions from anthracene and pyrene appeared at a shorter wavelength. The concentration of PAHs in the film also affected the absorption and emission (Fig. 3G). Additionally, PAH molecules could not reproduce the excitation-dependent emission. Based on these results, the CDs cannot be directly mimicked by a single molecule. The film contained a fabricated monomer unit with a molecular molar ratio of 10![[thin space (1/6-em)]](https://www.rsc.org/images/entities/char_2009.gif) :
:![[thin space (1/6-em)]](https://www.rsc.org/images/entities/char_2009.gif) 10
10![[thin space (1/6-em)]](https://www.rsc.org/images/entities/char_2009.gif) :
:![[thin space (1/6-em)]](https://www.rsc.org/images/entities/char_2009.gif) 1
1![[thin space (1/6-em)]](https://www.rsc.org/images/entities/char_2009.gif) :
:![[thin space (1/6-em)]](https://www.rsc.org/images/entities/char_2009.gif) 20 anthracene/pyrene/perylene/PMM. The mimic absorption, PL emission, and excitation-dependent emission are exhibited in Fig. 3I–K. Although the spectrum in Fig. 3I does not fully match the spectrum of the CDs, it confirms that CDs comprise small PAHs embedded in an sp3 hybridized carbon matrix. The large Stokes shift is due to the exciton self-trapping in the stacked PAH molecules (Fig. 3H). These results successfully demonstrate that the core of the CDs is composed of a few kinds of sp2 domains embedded in the sp3 matrix.
20 anthracene/pyrene/perylene/PMM. The mimic absorption, PL emission, and excitation-dependent emission are exhibited in Fig. 3I–K. Although the spectrum in Fig. 3I does not fully match the spectrum of the CDs, it confirms that CDs comprise small PAHs embedded in an sp3 hybridized carbon matrix. The large Stokes shift is due to the exciton self-trapping in the stacked PAH molecules (Fig. 3H). These results successfully demonstrate that the core of the CDs is composed of a few kinds of sp2 domains embedded in the sp3 matrix.
Because the CDs were prepared from CA and EDA, the amine took part in the reaction and formed a product that contained heteroatoms in addition to the C, H, and O. Thus, it has been proposed that the blue emission may not be associated with the simple PAH, and is instead associated with citrazinic acid or other 2-pyridone-based molecules, since these molecules can be produced in the common reaction between CA and amine.40,41 Song et al. analyzed the small fluorescent molecules (1,2,3,5-tetrahydro-5-oxo-imidazo[1,2-a]pyridine-7-carboxylic acid, IPCA) that can be produced from CA and EDA at a low temperature (140 °C), and clarified their precise chemical structure (Fig. 4A).24 IPCA showed a strong blue PL emission at 440 nm and two absorption bands at 240 nm and 350 nm, which are similar to those of CDs (Fig. 4B). This implies that IPCA can considerably contribute to the absorbance and PL in CDs. The PL lifetime of IPCA was found to be about 14.06 ns, and its single exponential PL intensity decay tendency indicated a simple PL center (Fig. 4C). In addition, –OH, CQO, C–N (CQN), –NH, and –CH groups were also confirmed by the IR spectra (Fig. 4D). The molecular mass of IPCA is 181. In the mass spectrum, the molecular ion (m/z) is 180 (Fig. 4E), and the 1H and 13C NMR spectra also disclosed the chemical structure (Fig. 4F and G). IPCA was also synthesized by refluxing CA and EDA at ambient pressure, indicating that IPCA is a critical PL center of CDs.
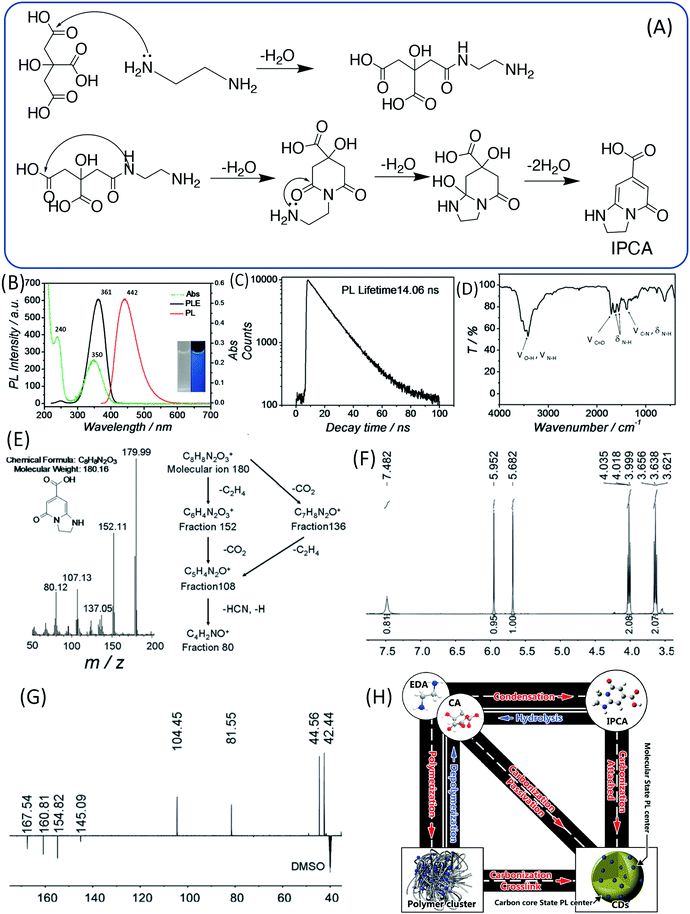 | ||
| Fig. 4 (A) The assumed process of forming the molecule (IPCA) from CA and EDA. (B) UV-vis absorption, PL emission and excitation spectra of IPCA; inset: photographs of IPCA solution under visible and UV light. (C) Time-resolved PL lifetime decay, (D) FTIR, (E) mass spectrum, (F) 1H NMR, and (G) DEPTQ 13C NMR spectra of IPCA. (H) A schematic of the relationship between different products in the one-pot hydrothermal system of CA and EDA.24 | ||
In sum, the entire reaction may include the following steps: (i) polymer aggregate nanoparticles are formed by the condensation of CA and EDA in the hydrothermal reaction; (ii) polymer nanoparticles are further carbonized to form an amorphous matrix; and (iii) at the same time, partial polymer units could form IPCA as a conjugated domain, and the fluorophore is embedded in the matrix (Fig. 4H).
4. CA and EDA derivatives
Song et al. also pointed out that EDA derivatives are employed in the synthesis of CDs, and that IPCA derivatives are also produced in the corresponding CDs (Fig. 5A). Alkyl chains or other groups took the place of one hydrogen on the amine, and similar IPCA derivatives were produced similarly. Et-CDs and Ac-CDs with respective PL QY values of 77% and 46% were obtained via the same reaction process. The NMR results imply that the products have basic IPCA structures and exhibit similar optical properties. If the propane diamine (PrDA) was employed to take the position of EDA, PPCA would be observed in the reaction; the mass and NMR spectra disclosed the chemical structure, which exhibits strong blue emission with a PL QY of 73% (Fig. 5B and C).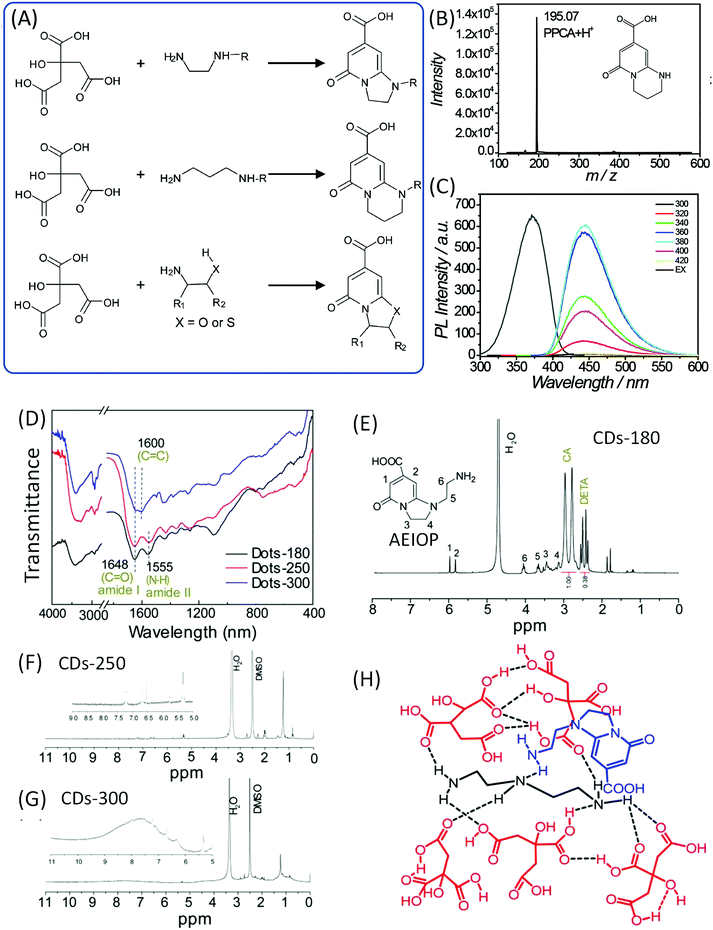 | ||
| Fig. 5 (A) The reaction of CA with EDA derivatives to produce the corresponding fluorophores. (B) The mass spectrum and (C) PL excitation and emission spectra at different excitation wavelengths of PPCA.24 (D) FTIR and (E–G) 1H NMR of CDs prepared from CA and DETA at different temperatures. (H) The possible chemical structure of a supramolecular nanocluster in CDots-180, which is composed of AEIOP coupled with DETA@5CA. The dashed lines indicate hydrogen bonds.42 | ||
Liu et al. investigated the CA and diethylenetriamine (DETA) reaction system to produce CDs at different reaction temperatures (180, 250, and 300 °C).42,43 FTIR spectra (Fig. 5D) confirmed the presence of amide groups (1648 cm−1 stretching of the amide and 1555 cm−1 in-plane bending). XPS spectra indicated the existence of amide carbonyl (288.0 eV in C 1s), pyridinic N (398.9 eV), pyrrolic N (399.8 eV), and carbonyl O (531.5 eV). The value of m/z = 224.1 was observed in the LC-MS analysis. 1H NMR spectra showed the signals at 6.0–9.0 ppm for aromatic hydrogen, and 1.5–2.0 ppm for aliphatic hydrogen. The high reaction temperature resulted in further condensation and carbonization (broadened peaks), and the peaks at 6.0–10.0 ppm indicated the presence of aromatic carboxylic acid and/or phenol (Fig. 5E–G). This spectral evidence proved that 1-(2-aminoethyl)-5-oxo-1,2,3,5-tetrahydroimidazo[1,2-a]-pyridine-7-carboxylic acid (AEIOP) was formed in the reaction (inset of Fig. 5E). The authors also proposed the chemical structure of CDs (Fig. 5H).
5. CA and cysteamine (CAm) or L-cysteine (Cys)
The –OH group in the EA was replaced by –NH2 to obtain EDA. Cysteamine is a similar molecule to EDA in that the –SH takes the –OH position. Shi et al. investigated N,S-doped CDs prepared from CA and CAm and Cys, which could be treated as a derivative of CAm.44,45 They found that N,S-doped CDs also exhibit strong blue fluorescence under UV excitation and excitation-dependent emission. 5-Oxo-3,5-dihydro-2H-thiazolo[3,2-a] pyridine-7-carboxylic acid (TPCA) is the main ingredient and actual fluorescence origin of N,S-CDs, which are typical strongly fluorescent citric acid-based CDs with a remarkable QY. TPCA can be directly produced from CA and CAm at relatively low temperatures (Fig. 6A). When CA reacted with Cys, 5-oxo-3,5-dihydro-2H-thiazolo[3,2-a]pyridine-3,7-dicarboxylic acid (TPDCA) was formed first, and TPCA was then formed via dehydration (Fig. 6A and B). Kasprzyl et al. reported the reaction of CA with Cys at 100 °C to synthesize highly fluorescent TPDCA (QY = 62%) (Fig. 6C and D), the chemical structure of which was confirmed by NMR and ESI-MS.46 The NMR and MS spectra also showed that the N,S-doped CDs have similar chemical structures to TPCA (Fig. 6E–G). The N,S-doped CDs also exhibit similar optical properties including absorption, fluorescence, and pH-dependent emission, as well as photobleaching phenomena. Based on the obtained data, Kasprzyl et al. believed that the organics might be the main ingredient when the reaction temperature is lower than 200 °C. The PL QY will be reduced with the further increase of the reaction temperature due to the loss of organic fluorophores during carbonization.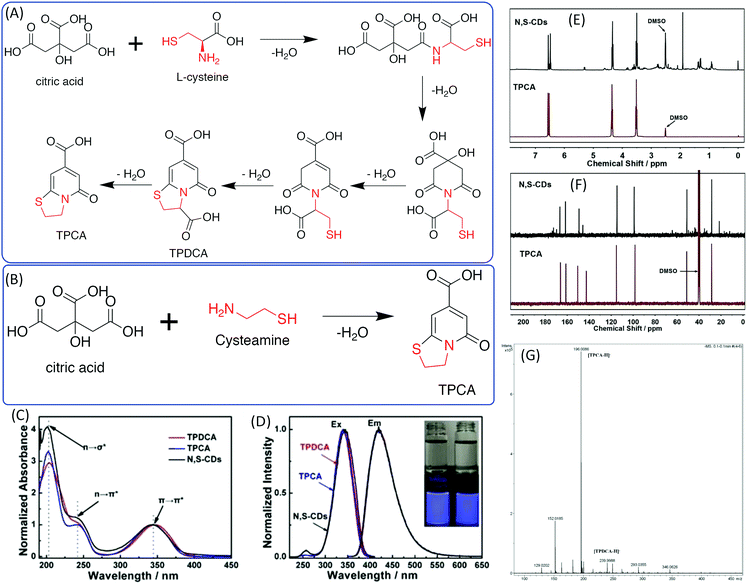 | ||
| Fig. 6 (A) The synthesis approaches and chemical structures of TPDCA and TPCA. (a) Synthesis of TPDCA by heating a powder mixture of citric acid and L-cysteine, and (b) synthesis of TPCA by heating TPDCA powder to decarboxylate. (B) Synthesis of TPCA by heating a powder mixture of citric acid and cysteamine.44 (C) UV-vis spectra and (D) PL excitation and emission spectra of TPDCA, TPCA, and N,S-CDs; inset: photos of TPDCA (left) and TPCA (right) solutions under daylight (top) and under 365 nm UV light (bottom). (E) 1H-NMR comparison of TPCA and N,S-CDs. (F) 13C-NMR comparison of TPCA and N,S-CDs. (G) High-resolution MS spectrum of N,S-CDs.46 | ||
Based on the literature, highly fluorescent molecules could be synthesized from CA and α,β-amines, β-amino alcohols, and β-amino thiols. Kasprzyk et al. proposed the reaction in Scheme 3.47 The fluorescent CDs were synthesized from CA as the carbon source and diamines as the nitrogen source. The authors provided detailed NMR and MS analyses of the small fluorophores from CA and α,β-amines, β-amino alcohols, and β-amino thiols. For example, fluorophore 9b (Y = NH) was synthesized from CA and o-phenylenediamine. Its HSQC NMR spectra and ESI-MS/MS are presented in Fig. 8, which further confirms its chemical structure. Recently, Yuan et al. confirmed that blue and green emissive CDs can be obtained from CA and diaminonaphthalene (DAN), and have a high PL QY (>70%) due to the extension of the conjugation length.48
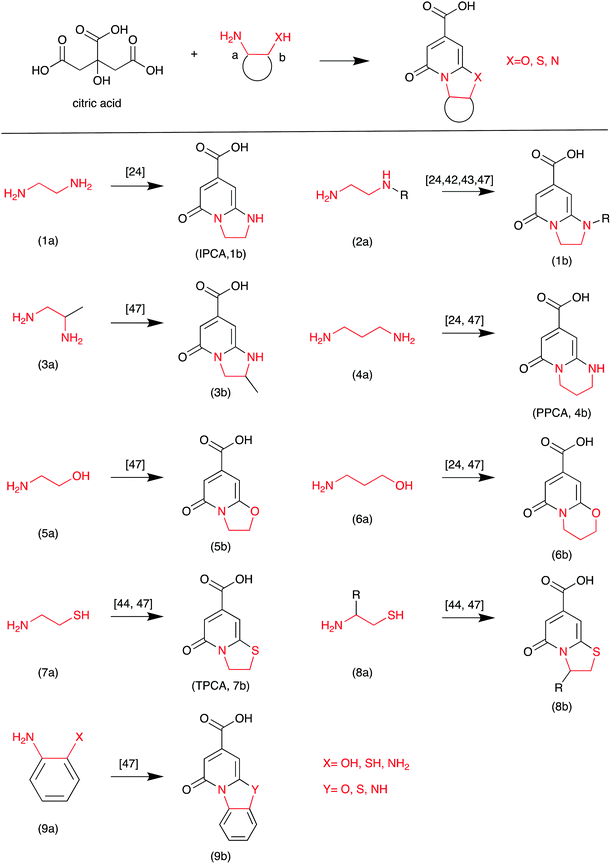 | ||
| Scheme 3 The CA and EDA derivative reaction.47 | ||
6. CA and urea/thiourea
Beyond the EDA and its derivatives, urea and its derivatives are other common nitrogen sources for CDs. Blue-emissive CDs were obtained from CA and EDA derivatives; however, not only blue-emissive, but also multiple-colored emissive CDs were synthesized from CA and urea by varying the reaction conditions, e.g., the ratio of CA to urea and the reaction temperature (Fig. 7A).49–51 Li et al. investigated the reaction system of CA and urea,52 and proposed a process similar to that of the CA and EDA system. The CA and urea polymerized to form polymer nanoparticles, and then carbonized to form the sp2 domain in the amorphous sp3 matrix. To understand the chemical structure of the fluorophores of CDs, Strauss et al. examined the reaction of CA with urea via the microwave method.53 They found two kinds of CDs; the closed reaction system produced a blue solution, whereas the open reaction produced a light yellow solution. The former exhibited narrow excitation-independent blue emission, and the latter displayed excitation-dependent blue-green emission. During the reaction, urea could decompose and release various amine species. While these amines could be released in the open system, they could not in the closed system. The NMR spectra confirmed the presence of carbons stemming from carboxylates and amides, and the aromatic carbon atoms attached to strong electron-withdrawing groups. Zholobak et al. thermalized CA and urea in different molar ratios without any solvents, as urea can melt at temperatures greater than 133 °C.54 They also found that the blue emission turned into green emission when the molar ratio of CA to urea was greater than 1![[thin space (1/6-em)]](https://www.rsc.org/images/entities/char_2009.gif) :
:![[thin space (1/6-em)]](https://www.rsc.org/images/entities/char_2009.gif) 3. They hypothesized that the origin of the blue-emissive fluorophore was citrazinic acid,23,41 and that the green fluorophore was a result of the formation of citrazinic amide.54 However, they did not provide detailed evidence for the chemical structure. Kasprzyk et al.55 obtained two kinds of CDs with green and blue emission from open and closed systems. Ammonia produced in the reaction could be released from the open system, and the ammonia concentration in the reaction system has a critical influence on the emission of CDs. The authors further carried out ESI-MS and NMR experiments to disclose the chemical structure of the fluorophores for these CDs. They ascertained that the blue fluorophore in the CDs was the citrazinic acid produced from CA and ammonia. The green fluorophore was 4-hydroxy-1H-pyrrolo[3,4-c]pyridine-1,3,6(2H,5H)-trione (HPPT). The 1H–13C NMR and ESI-MS/MS spectra are presented in Fig. 7B and C. The authors also proposed the two formation mechanisms presented in Fig. 7D. One possible reaction route is that the citrazinic acid or amide was first formed by the reaction of CA with NH3. The isocyanic acid, which was produced from the decomposition of urea, was then added at position 3 of the pyridine ring. Finally, the imide ring was closed to form HPPT. Another possible reaction route is the formation of an intermolecular amide between citrazinic acid and urea. Intramolecular condensation and cyclization then occurred with the exclusion of ammonia. Therefore, the CA and urea reaction system is similar to the CD and EDA reaction system, and the formation of CDs contains a few steps such as the formation of polymer nanoparticles and carbonization. The difference is that the fluorophore was HPPT.
3. They hypothesized that the origin of the blue-emissive fluorophore was citrazinic acid,23,41 and that the green fluorophore was a result of the formation of citrazinic amide.54 However, they did not provide detailed evidence for the chemical structure. Kasprzyk et al.55 obtained two kinds of CDs with green and blue emission from open and closed systems. Ammonia produced in the reaction could be released from the open system, and the ammonia concentration in the reaction system has a critical influence on the emission of CDs. The authors further carried out ESI-MS and NMR experiments to disclose the chemical structure of the fluorophores for these CDs. They ascertained that the blue fluorophore in the CDs was the citrazinic acid produced from CA and ammonia. The green fluorophore was 4-hydroxy-1H-pyrrolo[3,4-c]pyridine-1,3,6(2H,5H)-trione (HPPT). The 1H–13C NMR and ESI-MS/MS spectra are presented in Fig. 7B and C. The authors also proposed the two formation mechanisms presented in Fig. 7D. One possible reaction route is that the citrazinic acid or amide was first formed by the reaction of CA with NH3. The isocyanic acid, which was produced from the decomposition of urea, was then added at position 3 of the pyridine ring. Finally, the imide ring was closed to form HPPT. Another possible reaction route is the formation of an intermolecular amide between citrazinic acid and urea. Intramolecular condensation and cyclization then occurred with the exclusion of ammonia. Therefore, the CA and urea reaction system is similar to the CD and EDA reaction system, and the formation of CDs contains a few steps such as the formation of polymer nanoparticles and carbonization. The difference is that the fluorophore was HPPT.
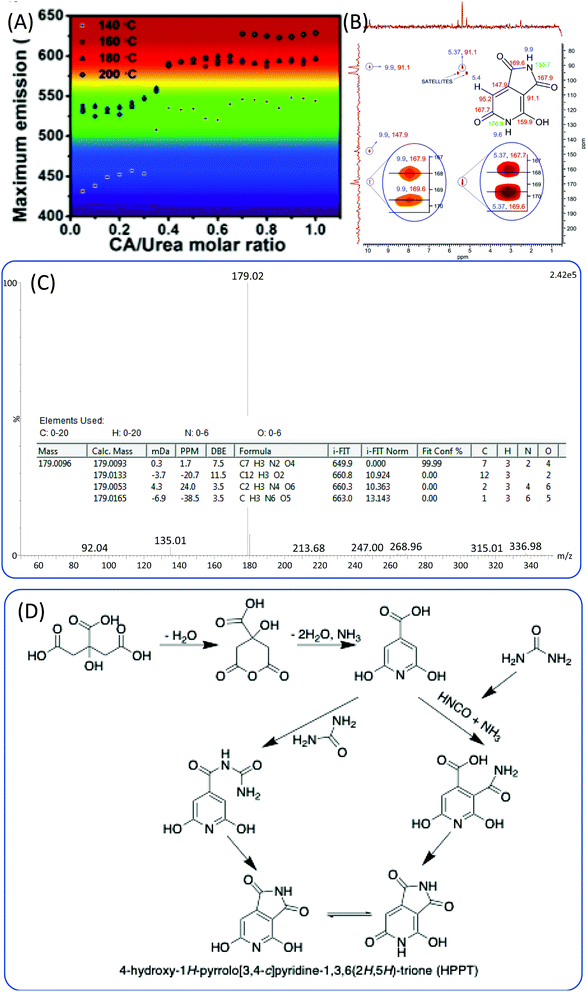 | ||
| Fig. 7 (A) The maximum emission of CDs prepared from CA and urea under various reaction conditions.49 (B) Heteronuclear multiple bond coherence (HMBC) 1H–13C NMR spectrum of HPPT and chemical structure of HPPT with NMR assignments (ppm). (C) High-resolution mass spectrum of HPPT showing a molecular ion peak with m/z (ESI−) = 179, and indicating the molecular formula C7H4N2O4. (D) Possible mechanism of HPPT formation.55 | ||
To briefly summarize Table 1, which presents the characteristics of the CDs prepared from CA, the general reaction route begins with the polymerization of CA and amines to produce the polymer nanoparticles. Meanwhile, the fluorophores of citrazinic acid derivatives such as IPCA are formed between CA and RNH2. With the extension of the reaction temperature and time, the aromatization generates conjugated molecules which work as fluorophores in the CDs. These conjugated molecules are further aggregated to enhance the rigidity of the nanoparticles and form the sp2 nanodomain via intermolecular interaction, such as π–π stacking and H-bonding.40,56 Thus, it forms typical CD structures with an sp2 nanodomain embedded into the amorphous sp3 matrix, which is composed of non-conjugated molecules, cross-linked polymers, or amorphous carbon materials. The main fluorophores of CDs are the citrazinic acid derivatives (Scheme 1).57Table 1 summarizes all the reactants and the corresponding explanations. Beyond CA, various non-conjugated molecules such as sugars,58 proteins,59 amino acids,60,61 and other biomasses14 are extensively used for the synthesis of CDs. However, the systematic investigation of these species in the formation process is rarely reported, and thus will be a potential research hotspot in the future.
| Reactants | Reaction conditions | PL emission | Main product | Explanation | Ref. |
|---|---|---|---|---|---|
| CA and NH3 | Reflux at 120–130 °C | Blue | Citrazinic acid | Citrazinic acid | 20–22 |
| CA and ethanolamine (EA) | Heat to 180–300 °C | Blue | No solid at 180 °C | FTIR proves the amidation of CA and EA | 25 and 47 |
| Blue | N-doped CDs at 230 °C | Amidation/imidization of CA and EA | |||
| Excitation-dependent emission | N-doped CDs at 300 °C | Carbonized nanoparticles | |||
| CA and EA | Heat to 130–170 °C | No emission | Polymer nanoparticles at 130 °C | 26 | |
| Weak blue emission | Shrunken polymer nanoparticles and aromatization at 150 °C | ||||
| Blue | Carbonized nanoparticles formed in the shrunken polymer nanoparticles at 170 °C for 1 minute, CDs formed at 170 °C for 10 minutes | ||||
| CA and EA | Reflux at 180 °C for 1 hour | Blue | N-doped CDs | Discovered the fluorophore; molecules 3–5 in Fig. 1 | 27 |
| CA and ethylenediamine (EDA) | Hydrothermal at 200 °C for 5 hours | Blue | N-doped CDs | The formation of CDs follows the cross-linked polymer and then carbogenic nanoparticles. A cross-link-enhanced emission (CEE) mechanism was proposed for the highly efficient fluorescence | 28 and 47 |
| CA and EDA | Microwave at 140 °C for 3 minutes | Blue | N-doped CDs | H-bond-induced amide and carboxylic group assembly contributed to the HOMO and LUMO. The photoinduced charge transfer between these groups thus constitutes the origin of the strong blue fluorescence emission | 30 |
| CA and EDA | In the presence of a coupling agent (diisopropyl carbodiimide) at room temperature | Blue | Polymer nanoparticles | ||
| Tricarballylic acid and EDA | Microwave at 140 °C for 3 minutes | Blue | N-doped CDs | ||
| CA and EDA | Hydrothermal at 140–300 °C for 10 hours | Blue | N-doped CDs | Provided the detailed formation process, cross-linked polymer, formation of the conjugated molecule IPCA, and further carbonization to form CDs. Assigned the IPCA as the fluorophore of CDs | 24 and 47 |
| CA and EDA derivatives such as Et-EDA, Ac-EDA, and PDA | Hydrothermal at 140 °C for 10 hours | Blue | Confirm the IPCA derivatives as fluorophores, such as Et-/Ac-IPCA, PPCA in Scheme 3 | 24,47 | |
| CA and DETA | Hydrothermal at 180–300 °C for 10 hours | Blue | N-doped CDs | Assigned AEIOP as the fluorophore of CDs (Scheme 3) | 42 |
| CA and CAm/L-cysteine | Hydrothermal at 200 °C for 3 hours | Blue | S,N-doped CDs | Assigned TPCA and TPDCA as fluorophores of CDs (Scheme 3) | 44, 46 and 47 |
| CA and propanol diamine (PoDA) | Hydrothermal at 180 °C for 1 hour | Blue | N-doped CDs | Assigned PPCA as the fluorophore of CDs (Scheme 3) | 47 |
| CA and o-aminophenol/o-aminothiophenol/o-phenylenediamine (o-PDA) | Hydrothermal at 180 °C for 1 hour | Blue | N-doped CDs | Assigned molecule 9b as the fluorophore of CDs (Scheme 3) | 47 |
| CA and diaminonaphthalene (DAN) | Solvothermal at 200 °C for 1–9 hours in ethanol/H2SO4 | Blue-red | N-doped CDs | DAN could be considered as the smallest sp2 domain with a unique amino-substituted rigid carbon skeleton structure, which concomitantly acts as a building block to form an intact sp2 cluster that is N-doped in the large rigid π-conjugated structure, and highly surface-passivated with the amino at edge sites | 48 |
| CA and urea | Hydrothermal at 130–240 °C for 6 hours | Blue-green | N-doped CDs | Excitation-independent emission at 440 nm at a low reaction temperature | 52 |
| Excitation-dependent emission at a high reaction temperature. The surface state decided the emission | |||||
| CA and urea | Microwave in closed and open systems | Blue and green | N-doped CDs | Citrazinic acid and derivatives for fluorophores of blue-emissive CDs | 55 |
| HPPT for green-emissive CDs | |||||
| p-PDA | Solvothermal at 180 °C for 12 hours in ethanol | Red | N-doped CDs | 62 | |
| m-PDA | Blue | ||||
| o-PDA | Green | ||||
| p-PDA | Hydrothermal in organic solution at 200 °C for 5 hours | Red | N-doped CDs | Formed oligomers of PDA in the longitudinal direction, and polymerization in the transverse direction. The red emission of CDs originated from molecular states | 64 |
| p-PDA | Hydrothermal in acidic aqueous solution at 200 °C for 2 hours | Red | N-doped CDs | First, the formation of the dimer of PDA, and further polymerization in the longitudinal and transverse directions. DFT calculation indicates that polymerization in the transverse direction is preferred | 67 |
| p-PDA-NR2 | Solvothermal in DMF at 200 °C for 12 hours | Red | N-doped CDs | Deamination reaction in the solvothermal process | 68 |
| DAP | Hydrothermal at 250–380 °C for 16–48 hours | Tuneable emission from blue to NIR | C3N | DAP polymerized in the longitudinal and transverse directions to form 2D C3N | 76 |
| o-DHB | Solvothermal in hydrazine ethanol solution at 160 °C for 12 hours | Blue-yellow | N-doped CDs | Benzoquinone was formed by the oxidation of DHB. The cross-linking and carbonization happened between DHB and benzoquinone to obtain the CDs | 79 and 81 |
| m-DHB | Green-yellow | ||||
| p-DHB | Blue-red | ||||
| Dopamine and o-PDA | Hydrothermal in acidic solution at 200 °C for 8 hours | NIR | N-doped CDs | Dopamine cross-linked with o-PDA; oxidative acid may promote the oxidation of dopamine and/or DPA | 82 and 83 |
| m-DHB | Solvothermal in ethanol at 200 °C | Green and red | CDs | CDs in the triangular shape. Green and red emissions for 4 and 7 hours of reaction time, respectively | 84 |
| Naphthalenediol (DHN) or DHB and oxidant (K2S2O8 or anthraquinone, etc.) | Solvothermal in ethanol at 180 °C for 4 hours | Blue to red | CDs | The emission of CDs can be adjusted by tuning the ratio of phenol to the oxidant. Part of the phenol can be oxidized into quinone | 80 |
| 1,3-DHN and KIO3 | Solvothermal in ethanol at 180 °C for 4 hours | Red | CDs | Cross-link and dehydration | 85 |
| Phloroglucinol | Solvothermal in ethanol at 180 °C for 2–24 hours | Blue to red | Triangular CDs | Blue emission for a reaction time of 9 h; green emission for a reaction time of 24 h; yellow emission for a reaction time of 2 h in H2SO4–ethanol; red emission for a reaction time of 5 h in H2SO4–ethanol | 86 |
Conjugated molecule-based CDs
1. Phenyldiamines and derivatives
In 2015, Lin et al.62 reported the formation of red-, green-, and blue-emissive CDs from p-, o-, and m-phenylenediamines (PDAs) in ethanol via a solvothermal route (Fig. 8A). This promoted the research of CDs to enter another era. Ding et al. synthesized and separated a series of color emissive CDs from urea and p-PDA via a hydrothermal method followed by the column chromatography technique.63 The presence of various surface functional groups (OH, NH2, C–O, and COOH) was proven by FTIR spectra. The authors emphasized that the surface defects produced by the oxidation are one of the critical factors that result in a narrow bandgap for red emission. Multiple-color emissive CDs can also be prepared from p-PDA in different kinds of solvents.64,65 The emission peak can be shifted from 540 nm to 614 nm. In this reaction, there is only one reactant, p-PDA, which has one type of functional group (–NH2). The authors proposed that the p-PDA was first polymerized in the reaction, and carbon materials were then formed by further coupling (Fig. 8B). Although they did not provide the NMR or MS results, p-PDA polymerization reactions have been reported by other scholars, and the findings have matched their explanation.66 Based on the investigation of the solvent effect, the red emission of CDs originates from molecular states. Tan et al. calculated the formation of tetramers of o-PDA, and found that the fully protonated bi-poly(p-PDA) tended to be coupled in transverse growth (−1406.07 kJ mol−1) to form a planar structure, rather than longitudinal growth (−616.25 kJ mol−1) (Fig. 8C).67 Very recently, Jia et al. used N,N-dialkyl-p-PDA (alkyl = methyl, ethyl, and propyl) as a single reactant in DMF to produce red-emissive CDs with a PL QY of 86.0%.68 The reaction process is presented in Fig. 8D. The corresponding Raman spectrum exhibits a sharp graphitic band. Unlike previously reported CDs, there is no indication of –NH2 or –OH groups in the FTIR spectra of the CDs (Fig. 8E). In the downfield of the 1H and 13C-NMR spectra (Fig. 8F and G), the peaks appearing in the ranges of 6.5–8 and 110–150 ppm are classified as signals of aromatic hydrogen and carbon, respectively, confirming the presence of a π-conjugated structure. In the high field of the 1H and 13C-NMR spectra, peaks appearing in the range of 1–4 ppm and <60 ppm are assigned to aliphatic hydrogen and carbon, respectively. Theoretical calculations were carried out on the optical properties of CD–X with different surface groups (X = 0, –NH2, –NMe2, –NEt2 and –NPr2). CD-0 exhibited fluorescence emission (λem) at 559 nm. Pronounced increases in the red-shift in λem were observed for CD–NH2 (583 nm), –NMe2 (614 nm), –NEt2 (620 nm), and –NPr2 (623 nm). The –NR2 passivation led to a longer λem than that of –NH2, which is in good agreement with the experimental λem. These results indicate that the red bandgap emissions of CD–NMe2, –NEt2, and –NPr2 originated from the rigid π-conjugated skeleton structure.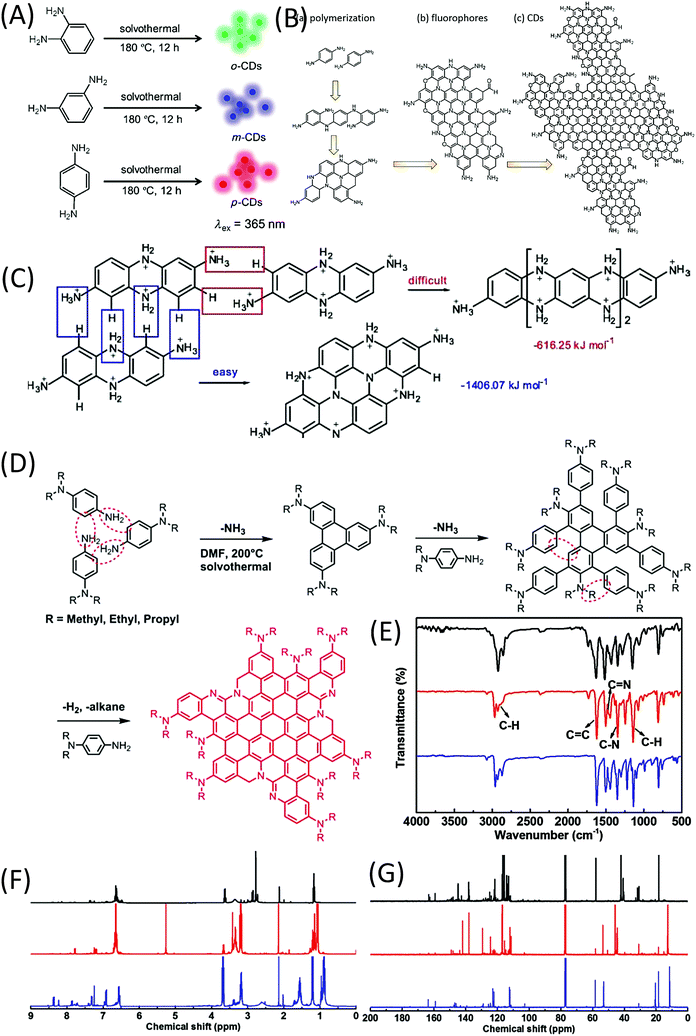 | ||
| Fig. 8 (A) Preparation of RGB PL CDs from three different phenylenediamine isomers (o-PDA, m-PDA, and p-PDA).62 (B) Illustration of the formation process of CDs based on the polymerization of PPD. (a) Polymerization of PPD, (b) formation of nitrogen-containing fluorophores, and (c) possible structure of CDs.64 (C) Formation energies of longitudinal and transverse growths of a dimer of p-PDA.67 (D) Synthesis of CD–NMe2, –NEt2, and –NPr2via solvothermal treatment of N,N-dimethyl-, N,N-diethyl-, and N,N-dipropyl-p-PD, respectively. (E) FTIR, (F) 1H NMR, and (G) 13C NMR spectra of CD–NMe2 (black), –NEt2 (red), and –NPr2 (blue).68 | ||
o-Phenylenediamine (o-PDA) is another aromatic amine that acts as a reactant for CDs with green, yellow, and red emission.69–73 Generally, o-PDA is polymerized to form the dimer, trimer, and oligomers (Fig. 9A).70,74,75 These oligomers are carbonized and produce emissive CDs. Yang et al. began with the dimer of o-PDA (2,3-diaminophenazine, DAP) and treated it with a simple hydrothermal method to form C3N.76 The DAP molecules can be polymerized both horizontally and vertically (Fig. 9B(a)). The peaks in the MALDI-TOFMS spectra (Fig. 9B(b)) located at m/z = 211.103, 415.143 (or 419.695), 625.268 (or 625.268), and 825.263 are attributed to the protonated monomer, dimer, trimer, and tetramer, respectively. The lighter fragments were polymerized to heavier fragments with the increase of reaction time, while the DAP was completely consumed after 5 h. Theoretical analysis suggests that the horizontal and vertical polymerization that form C–N bonds are thermodynamically more favorable than other polymerization types. The 15N NMR spectrum (Fig. 9C) of the C3N sheet exhibits three singlet peaks, indicating a relative chemical shift. The peaks located at d = −360.03 and −323.87 ppm can be attributed to the N in the primary amine group and the parahelium group at the edges of the C3N sheets. The peak at −261.62 ppm is assigned to aromatic nitrogen (C3N). The 13C NMR spectrum of C3N is displayed in Fig. 9D, and exhibits four singlet peaks at 141.2, 133.2, 130.1, and 116.4 ppm. The peak located at 116.4 ppm may be attributed to the inner carbon atoms. The peaks located at 141.2 and 130.1 ppm can be attributed to the zigzag-edge carbon atoms, as shown in the schematic diagram. The peak located at 133.2 may be assigned to the zigzag-edge carbon atoms with the amino groups. The size dependence of the bandgap was utilized to tune the PL of C3N QDs over the entire visible range (400–660 nm) (Fig. 9E, curves 1–6) up to the IR region (curves 7–10). C3N QDs have a large quantum yield (QY > 0.8) and a relatively long (12.8 ns) lifetime.
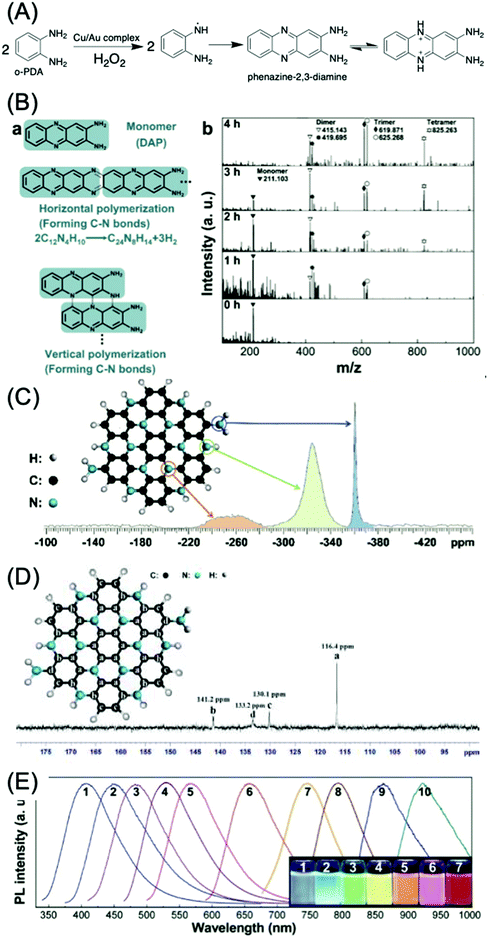 | ||
| Fig. 9 (A) Mechanism of the catalytic reaction of an o-PDA molecule by the Cu/Au complex.75 (B) Polymerization of DAP. (a) Scheme for horizontal and vertical polymerization of DAP forming C–N bonds. The polymerization advances via the abstraction of H from C–H and N–H bonds, followed by the formation of C–N bonds. (b) MALDI-TOFMS spectra of products with different polymerization times (from 0 to 4 h, 623 K, 2.0 × 10⁻³ M DAP). The peaks in the MALDI-TOFMS spectrum at m/z = 211.103, 415.143 (or 419.695), 625.268 (or 625.268), and 825.263 are attributed to the protonated monomer, dimer, trimer, and tetramer, respectively. The lighter fragments are polymerized to heavier fragments as time advances. (C) 15N-NMR spectrum of a mixture of single-layer and multilayer C3N sheets. The assignment of the peaks to specific N atoms in the C3N crystal is indicated. (D) 13C-NMR spectrum of a mixture of single-layer and multilayer C3N sheets. (E) PL spectra of different-sized C3N QDs (sizes: 1.8, 2.0, 3.0, 3.3, 4.0, and 5.5 nm; for curves 1–6, larger QDs yield IR PL (curves 7–10)); inset: digital photographs of C3N QD aqueous solutions irradiated using a 100 W mercury lamp (samples 1–7).76 | ||
m-Phenylenediamine (m-PDA), another isomer of PDA, can also be used to generate emissive CDs.62,77,78 Zhu et al. proposed the presence of a quinoid structure (N![[double bond, length as m-dash]](https://www.rsc.org/images/entities/char_e001.gif) Q
Q![[double bond, length as m-dash]](https://www.rsc.org/images/entities/char_e001.gif) N) and benzenoid (N–B–N) in the emissive CDs, which requires further evidence for confirmation.
N) and benzenoid (N–B–N) in the emissive CDs, which requires further evidence for confirmation.
2. Phenol and derivatives
Dihydroxybenzene (DHB) and its derivatives were also employed as the reactants for multiple-color emissive CDs. Three DHB isomers (o-, m-, and p-DHB) and hydrazine were used as reactants for the synthesis of N-doped CDs.79–81 The reaction was considered to produce benzoquinone, and further dehydration, cross-linking, and carbonization occurred in the reaction to form CDs with different color emissions (Fig. 10A–F). Dopamine, as a catechol derivative, was used to synthesize near-IR emissive CDs together with o-phenylenediamine.82,83 Catechol and o-PDA can generate white-emissive CDs that contain three emissive CDs (blue, green, and red light). Pure catechol, pure o-PDA, and a mixture of the two produce blue, green, and red emission, respectively.69 Yuan et al. reported that triangular-shaped, red-emissive CDs can be synthesized from m-DHB via a simple solvothermal route (Fig. 10G).84 In the 1H NMR spectra (Fig. 10H), except for the obvious aromatic hydrogen signals observed in the range of 7–8 ppm, active –H signals from the –OH groups with broad peaks were detected, as indicated by a black arrow. Moreover, 13C NMR spectra (methanol-d4, ppm) of the CDs (Fig. 10I) further confirm the functionalization of electron-donating –OH groups at the edge sites. The resonance signals in the range of 160–180 ppm are indicative of the aromatic carbon atoms bonded with –OH groups at the edge sites. The numerous signals observed in the range of 120–140 ppm in the 13C NMR spectra are attributed to sp2 carbon atoms, further demonstrating the formation of intact sp2 domains. Similarly, 1,3-dihydroxynaphthalene can also be used as a source for red-emissive CDs with the aid of KIO3 (Fig. 10J).85 Beyond m-DHB, phloroglucinol is also a promising reactant for CDs. Yuan et al. reported CDs that were synthesized from phloroglucinol via a solvothermal route (Fig. 10K).86 The TEM images showed that the CDs were in a typical triangular shape. The triangle size of CDs can be tuned by the reaction conditions. The most promising emission exhibited a relatively narrow full width at half maximum (FWHM) of 29–30 nm, indicating the high color purity of the CDs. Due to the conjugated structure of these CDs, DFT theoretical calculation was carried out to obtain the HOMO, LUMO, and bandgap information of a triangular conjugated structure consisting of 4, 10, and 19 fused benzene rings with electron-donating –OH and electron-withdrawing –COOH groups. Fig. 11 presents the LUMO, HOMO, and calculated PL spectra of triangular CDs containing 19 fused rings and different functional groups. Their corresponding electron cloud density distributions were around the entire molecular structure, indicating a higher degree of delocalization and uniform distribution across the whole molecular structure. The surface group played a critical role in the color purity and emission position. The electron-donating hydroxyl groups at the edge sites exhibited highly delocalized charges and outstanding structural stability, and thus dramatically reduced electron–phonon coupling, which was responsible for the high color-purity excitonic emission. The electron-withdrawing carboxyl groups on sp2-hybridized carbons can induce significant local distortions, and simultaneously act as surface defects that can trap carriers, which ultimately results in the dramatically increased FWHM of the PL spectra of CQDs.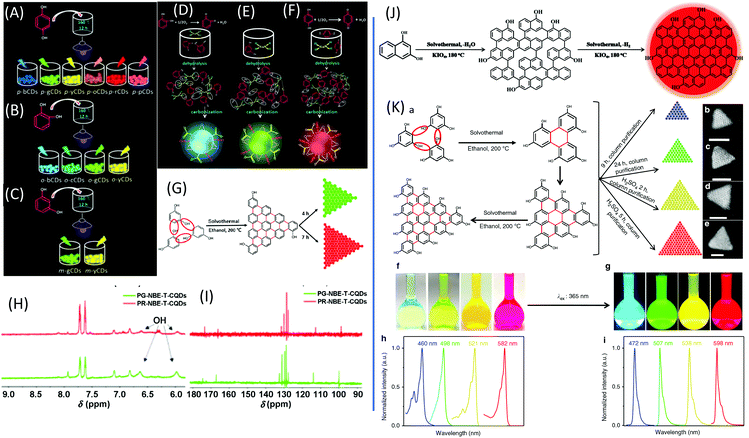 | ||
| Fig. 10 (A–C) Schematic routes of multiple-color emission CDs from p-, o-, and m-DHB. (D–F) Schematics of the growth processes and structural models of o-CDs, m-CDs, and p-CDs.79 (G) The green- and red-emissive CDs prepared from resorcinol via solvothermal treatment. (H) 1H NMR and (I) 13C NMR spectra of green- and red-emissive CDs prepared via route G.84 (J) The red emissive CDs prepared from 1,3-dihydroxynaphthalene and KIO4via the solvothermal route.85 (K) Design and synthesis of narrow bandwidth emission triangular CQDs. (a) Synthesis route of triangular CDs via the solvothermal treatment of PG triangulogen. The typical aberration-corrected HAADF-STEM images of (b) B-, (c) G-, (d) Y-, and (e) R-CDs. Scale bars = 2 nm. (f) Photographs of the CD ethanol solution under daylight and (g) fluorescence images under UV light (excited at 365 nm). The normalized (h) UV-vis absorption and (i) PL spectra of B-, G-, Y-, and R-CDs.86 | ||
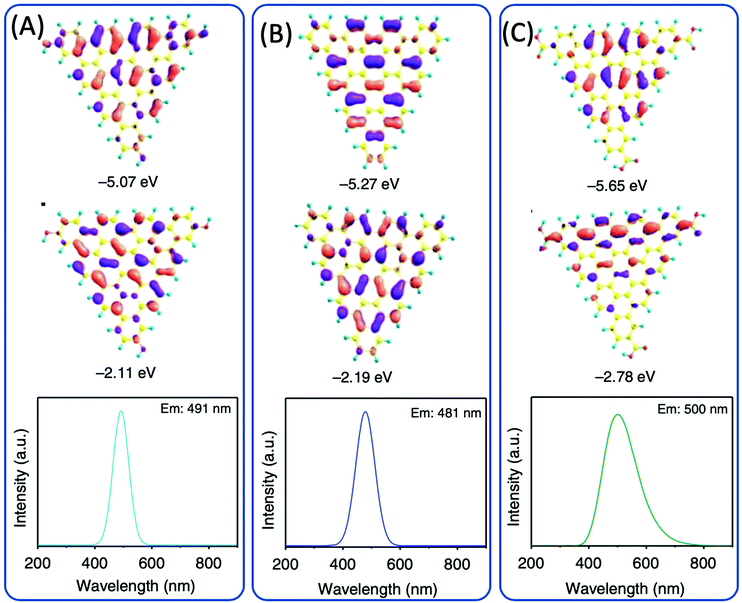 | ||
| Fig. 11 DFT calculations of the triangular structure model CDs consisting of 19 fused benzene rings (A) functionalized with electron-donating –OH groups and (B) without functionalization and (C) electron-withdrawing –COOH groups. The calculated HOMO (top), LUMO (middle), and PL spectra (bottom).86 | ||
CDs are prepared with an aromatic precursor mainly via coupling, condensation polymerization, and carbonization to form fused rings or an sp2 domain. The fluorophore contributes to the π electron delocalization of the conjugated domain. Thus, an effective conjugation size and electron density distribution play critical roles in the emission position and FWHM.
Conclusions and outlook
With the development of CDs, the understanding of the formation and PL emission of CDs has become increasingly more detailed and clearer. As one of the common carbon sources, citric acid can react with a variety of amines to form citrazinic acid, and with further cyclization and aromatization can produce a conjugated sp2 domain that enhances the chemical stability and photostability of CDs. Additionally, citrazinic acid and its derivatives are the main contributors to fluorescence in CDs. They are treated as the fluorophores of blue-emissive CDs. Furthermore, red-emissive CDs may be generated from aromatic molecules such as phenylenediamines and dihydroxybenzene. Intermolecular coupling promotes the formation of a planar aromatic structure. These conjugated structures exhibit superior chemical stability and photostability. The delocalized π electron results in an increasingly smaller bandgap. Thus, the optical properties can be tuned by the conjugation size of the CDs.Although a series of studies has been carried out for the investigation of the formation of CDs, the formation mechanism is still not fully clear. In the citric acid system, citrazinic acid and its derivatives are the main contributors to blue emission; green-, yellow-, and red-emissive CDs can also be produced from citric acid and urea. However, full understanding remains a great challenge because of the many kinds of intermediates produced from urea decomposition. The aromatic system was developed in the past 3–5 years, and thus more research into the formation process is required. In sum, the following questions remain to be clarified.
(1) As is known, CDs have been treated as having a carbon core with an sp2 domain and surface functional groups. What are the carbonization and aromatization of these non-conjugated molecules?
(2) Citrazinic acid and its derivatives are thought to be the fluorophores of CDs. What are fluorophores from other non-conjugated molecules, such as carbohydrates?
(3) Does the solvent take part in the reaction? What is the solvent effect on the formation of CDs?
(4) The aromatic molecules are treated with a coupling reaction between the molecules. What is the detailed reaction mechanism? How can the coupling reaction between aromatic molecules be tuned and regulated?
(5) Can we finely regulate the reaction process to realize quantum confinement for the carbon materials?
Conflicts of interest
There are no conflicts to declare.Acknowledgements
This work was financially supported by the Beijing Municipal High Level Innovative Team Building Program (No. IDHT20180504), the Beijing Outstanding Young Scientists Program (No. BJJWZYJH01201910005017), the National Natural Science Foundation of China (No. 21805004, 21671011, 21872001, and 51801006), the Beijing Natural Science Foundation (No. KZ201710005002 and 2192005), the China Postdoctoral Science Foundation (No. 2018M641133), the Beijing Postdoctoral Research Foundation (No. 2018-ZZ-021), and the Chaoyang District Postdoctoral Research Foundation (No. 2018-ZZ-026).Notes and references
- X. Xu, R. Ray, Y. Gu, H. J. Ploehn, L. Gearheart, K. Raker and W. A. Scrivens, J. Am. Chem. Soc., 2004, 126, 12736–12737 CrossRef CAS.
- B. Yao, H. Huang, Y. Liu and Z. Kang, Trends Chem., 2019, 1, 235–246 CrossRef.
- J. Shen, Y. Zhu, X. Yang and C. Li, Chem. Commun., 2012, 48, 3686–3699 RSC.
- H. Li, Z. Kang, Y. Liu and S.-T. Lee, J. Mater. Chem., 2012, 22, 24230 RSC.
- K. Hola, Y. Zhang, Y. Wang, E. P. Giannelis, R. Zboril and A. L. Rogach, Nano Today, 2014, 9, 590–603 CrossRef CAS.
- X. M. Li, M. C. Rui, J. Z. Song, Z. H. Shen and H. B. Zeng, Adv. Funct. Mater., 2015, 25, 4929–4947 CrossRef CAS.
- X. T. Zheng, A. Ananthanarayanan, K. Q. Luo and P. Chen, Small, 2015, 11, 1620–1636 CrossRef CAS.
- G. E. LeCroy, S.-T. Yang, F. Yang, Y. Liu, K. A. S. Fernando, C. E. Bunker, Y. Hu, P. G. Luo and Y.-P. Sun, Coord. Chem. Rev., 2016, 320–321, 66–81 CrossRef CAS.
- A. B. Bourlinos, A. Stassinopoulos, D. Anglos, R. Zboril, M. Karakassides and E. P. Giannelis, Small, 2008, 4, 455–458 CrossRef CAS.
- A. B. Bourlinos, A. Stassinopoulos, D. Anglos, R. Zboril, V. Georgakilas and E. P. Giannelis, Chem. Mater., 2008, 20, 4539–4541 CrossRef CAS.
- D. Shan, J. T. Hsieh, X. Bai and J. Yang, Adv. Healthcare Mater., 2018, 7, 1800532 CrossRef.
- S. Zhu, X. Zhao, Y. Song, S. Lu and B. Yang, Nano Today, 2016, 11, 128–132 CrossRef CAS.
- S. N. Baker and G. A. Baker, Angew. Chem., Int. Ed., 2010, 49, 6726–6744 CrossRef CAS.
- X. Zhang, M. Jiang, N. Niu, Z. Chen, S. Li, S. Liu and J. Li, ChemSusChem, 2018, 11, 11–24 CrossRef.
- M. K. Barman and A. Patra, J. Photochem. Photobiol., C, 2018, 37, 1–22 CrossRef CAS.
- S. Zhu, Y. Song, X. Zhao, J. Shao, J. Zhang and B. Yang, Nano Res., 2015, 8, 355–381 CrossRef CAS.
- F. Yuan, S. Li, Z. Fan, X. Meng, L. Fan and S. Yang, Nano Today, 2016, 11, 565–586 CrossRef CAS.
- J. Zhang and S.-H. Yu, Mater. Today, 2016, 19, 382–393 CrossRef CAS.
- P. Tian, L. Tang, K. S. Teng and S. P. Lau, Mater. Today Chem., 2018, 10, 221–258 CrossRef CAS.
- A. Behrmann and A. W. Hofmann, Ber. Dtsch. Chem. Ges., 1884, 17, 2681–2699 CrossRef.
- W. J. Sell and T. H. Easterfield, J. Chem. Soc., Trans., 1893, 63, 1035–1051 RSC.
- C. J. Reckmeier, J. Schneider, Y. Xiong, J. Häusler, P. Kasák, W. Schnick and A. L. Rogach, Chem. Mater., 2017, 29, 10352–10361 CrossRef CAS.
- J. Schneider, C. J. Reckmeier, Y. Xiong, M. von Seckendorff, A. S. Susha, P. Kasák and A. L. Rogach, J. Phys. Chem. C, 2017, 121, 2014–2022 CrossRef CAS.
- Y. Song, S. Zhu, S. Zhang, Y. Fu, L. Wang, X. Zhao and B. Yang, J. Mater. Chem. C, 2015, 3, 5976–5984 RSC.
- M. J. Krysmann, A. Kelarakis, P. Dallas and E. P. Giannelis, J. Am. Chem. Soc., 2012, 134, 747–750 CrossRef CAS.
- Y. Hu, J. Yang, J. Tian and J.-S. Yu, J. Mater. Chem. B, 2015, 3, 5608–5614 RSC.
- A. Das, V. Gude, D. Roy, T. Chatterjee, C. K. De and P. K. Mandal, J. Phys. Chem. C, 2017, 121, 9634–9641 CrossRef CAS.
- S. Zhu, Q. Meng, L. Wang, J. Zhang, Y. Song, H. Jin, K. Zhang, H. Sun, H. Wang and B. Yang, Angew. Chem., Int. Ed., 2013, 52, 3953–3957 CrossRef CAS.
- D. Qu, M. Zheng, L. Zhang, H. Zhao, Z. Xie, X. Jing, R. E. Haddad, H. Fan and Z. Sun, Sci. Rep., 2014, 4, 5294 CrossRef CAS.
- L. Vallan, E. P. Urriolabeitia, F. Ruiperez, J. M. Matxain, R. Canton-Vitoria, N. Tagmatarchis, A. M. Benito and W. K. Maser, J. Am. Chem. Soc., 2018, 140, 12862–12869 CrossRef CAS.
- S. Zhu, J. Zhang, L. Wang, Y. Song, G. Zhang, H. Wang and B. Yang, Chem. Commun., 2012, 48, 10889–10891 RSC.
- S. Tao, Y. Song, S. Zhu, J. Shao and B. Yang, Polymer, 2017, 116, 472–478 CrossRef CAS.
- E. Zhao, J. W. Y. Lam, L. Meng, Y. Hong, H. Deng, G. Bai, X. Huang, J. Hao and B. Z. Tang, Macromolecules, 2014, 48, 64–71 CrossRef.
- S. Zhu, Y. Song, J. Shao, X. Zhao and B. Yang, Angew. Chem., Int. Ed., 2015, 54, 14626–14637 CrossRef CAS.
- R. Ye, Y. Liu, H. Zhang, H. Su, Y. Zhang, L. Xu, R. Hu, R. T. K. Kwok, K. S. Wong, J. W. Y. Lam, W. A. Goddard and B. Z. Tang, Polym. Chem., 2017, 8, 1722–1727 RSC.
- T. Han, H. Deng, Z. Qiu, Z. Zhao, H. Zhang, H. Zou, N. L. C. Leung, G. Shan, M. R. J. Elsegood, J. W. Y. Lam and B. Z. Tang, J. Am. Chem. Soc., 2018, 140, 5588–5598 CrossRef CAS.
- S. Zhu, L. Wang, N. Zhou, X. Zhao, Y. Song, S. Maharjan, J. Zhang, L. Lu, H. Wang and B. Yang, Chem. Commun., 2014, 50, 13845–13848 RSC.
- S. K. Das, Y. Liu, S. Yeom, D. Y. Kim and C. I. Richards, Nano Lett., 2014, 14, 620–625 CrossRef CAS.
- M. Fu, F. Ehrat, Y. Wang, K. Z. Milowska, C. Reckmeier, A. L. Rogach, J. K. Stolarczyk, A. S. Urban and J. Feldmann, Nano Lett., 2015, 15, 6030–6035 CrossRef CAS.
- F. Ehrat, S. Bhattacharyya, J. Schneider, A. Lof, R. Wyrwich, A. L. Rogach, J. K. Stolarczyk, A. S. Urban and J. Feldmann, Nano Lett., 2017, 17, 7710–7716 CrossRef CAS.
- A. Sharma, T. Gadly, S. Neogy, S. K. Ghosh and M. Kumbhakar, J. Phys. Chem. Lett., 2017, 8, 1044–1052 CrossRef CAS.
- X. Liu, H.-B. Li, L. Shi, X. Meng, Y. Wang, X. Chen, H. Xu, W. Zhang, X. Fang and T. Ding, J. Mater. Chem. C, 2017, 5, 10302–10312 RSC.
- Q. Fang, Y. Dong, Y. Chen, C.-H. Lu, Y. Chi, H.-H. Yang and T. Yu, Carbon, 2017, 118, 319–326 CrossRef CAS.
- L. Shi, J. H. Yang, H. B. Zeng, Y. M. Chen, S. C. Yang, C. Wu, H. Zeng, O. Yoshihito and Q. Zhang, Nanoscale, 2016, 8, 14374–14378 RSC.
- J. P. Kim, Z. Xie, M. Creer, Z. Liu and J. Yang, Chem. Sci., 2017, 8, 550–558 RSC.
- W. Kasprzyk, S. Bednarz and D. Bogdal, Chem. Commun., 2013, 49, 6445–6447 RSC.
- W. Kasprzyk, S. Bednarz, P. Żmudzki, M. Galica and D. Bogdał, RSC Adv., 2015, 5, 34795–34799 RSC.
- F. Yuan, Z. Wang, X. Li, Y. Li, Z. Tan, L. Fan and S. Yang, Adv. Mater., 2017, 29, 1604436 CrossRef.
- X. Miao, D. Qu, D. Yang, B. Nie, Y. Zhao, H. Fan and Z. Sun, Adv. Mater., 2018, 30, 1704740 CrossRef.
- K. Hola, M. Sudolska, S. Kalytchuk, D. Nachtigallova, A. L. Rogach, M. Otyepka and R. Zbořil, ACS Nano, 2017, 11, 12402–12410 CrossRef CAS.
- T. Hu, Z. Wen, C. Wang, T. Thomas, C. Wang, Q. Song and M. Yang, Nanoscale Adv., 2019, 1, 1413–1420 RSC.
- X. Li, S. Zhang, S. A. Kulinich, Y. Liu and H. Zeng, Sci. Rep., 2014, 4, 04976 CrossRef CAS.
- V. Strauss, J. T. Margraf, C. Dolle, B. Butz, T. J. Nacken, J. Walter, W. Bauer, W. Peukert, E. Spiecker, T. Clark and D. M. Guldi, J. Am. Chem. Soc., 2014, 136, 17308–17316 CrossRef CAS.
- N. M. Zholobak, A. L. Popov, A. B. Shcherbakov, N. R. Popova, M. M. Guzyk, V. P. Antonovich, A. V. Yegorova, Y. V. Scrypynets, I. I. Leonenko, A. Y. Baranchikov and V. K. Ivanov, Beilstein J. Nanotechnol., 2016, 7, 1905–1917 CrossRef CAS.
- W. Kasprzyk, T. Swiergosz, S. Bednarz, K. Walas, N. V. Bashmakova and D. Bogdal, Nanoscale, 2018, 10, 13889–13894 RSC.
- A. P. Demchenko and M. O. Dekaliuk, Nanoscale, 2016, 8, 14057–14069 RSC.
- M. Shamsipur, A. Barati, A. A. Taherpour and M. Jamshidi, J. Phys. Chem. Lett., 2018, 9, 4189–4198 CrossRef CAS.
- H. Peng and J. Travas-Sejdic, Chem. Mater., 2009, 21, 5563–5565 CrossRef CAS.
- Z. Zhang, J. Hao, J. Zhang, B. Zhang and J. Tang, RSC Adv., 2012, 2, 8599 RSC.
- J. Jiang, Y. He, S. Li and H. Cui, Chem. Commun., 2012, 48, 9634–9636 RSC.
- F. Arcudi, L. Dordevic and M. Prato, Angew. Chem., Int. Ed., 2016, 55, 2107–2112 CrossRef CAS PubMed.
- K. Jiang, S. Sun, L. Zhang, Y. Lu, A. Wu, C. Cai and H. Lin, Angew. Chem., Int. Ed., 2015, 54, 5360–5363 CrossRef CAS.
- H. Ding, S. B. Yu, J. S. Wei and H. M. Xiong, ACS Nano, 2016, 10, 484–491 CrossRef CAS.
- T. Zhang, J. Zhu, Y. Zhai, H. Wang, X. Bai, B. Dong, H. Wang and H. Song, Nanoscale, 2017, 9, 13042–13051 RSC.
- H. Wang, C. Sun, X. Chen, Y. Zhang, V. L. Colvin, Q. Rice, J. Seo, S. Feng, S. Wang and W. W. Yu, Nanoscale, 2017, 9, 1909–1915 RSC.
- T. Plachy, M. Sedlacik, V. Pavlinek, Z. Morávková, M. Hajná and J. Stejskal, Carbon, 2013, 63, 187–195 CrossRef CAS.
- C. Tan, C. Zhou, X. Peng, H. Zhi, D. Wang, Q. Zhan and S. He, Nanoscale Res. Lett., 2018, 13, 272 CrossRef.
- H. Jia, Z. Wang, T. Yuan, F. Yuan, X. Li, Y. Li, Z. Tan, L. Fan and S. Yang, Adv. Sci., 2019, 6, 1900397 CrossRef.
- D. Qu, D. Yang, Y. Sun, X. Wang and Z. Sun, J. Phys. Chem. Lett., 2019, 10, 3849–3857 CrossRef CAS.
- L. Song, Y. Cui, C. Zhang, Z. Hu and X. Liu, RSC Adv., 2016, 6, 17704–17712 RSC.
- D. Bhattacharya, M. K. Mishra and G. De, J. Phys. Chem. C, 2017, 121, 28106–28116 CrossRef CAS.
- K. Jiang, X. Feng, X. Gao, Y. Wang, C. Cai, Z. Li and H. Lin, Nanomaterials, 2019, 9, 529 CrossRef CAS.
- H. Ding, J. S. Wei, P. Zhang, Z. Y. Zhou, Q. Y. Gao and H. M. Xiong, Small, 2018, 14, e1800612 CrossRef.
- M. Vedamalai, A. P. Periasamy, C. W. Wang, Y. T. Tseng, L. C. Ho, C. C. Shih and H. T. Chang, Nanoscale, 2014, 6, 13119–13125 RSC.
- Z. Yu, Y. Park, L. Chen, B. Zhao, Y. M. Jung and Q. Cong, ACS Appl. Mater. Interfaces, 2015, 7, 23472–23480 CrossRef CAS.
- S. Yang, W. Li, C. Ye, G. Wang, H. Tian, C. Zhu, P. He, G. Ding, X. Xie, Y. Liu, Y. Lifshitz, S. T. Lee, Z. Kang and M. Jiang, Adv. Mater., 2017, 29, 1605625 CrossRef.
- P. Zhu, K. Tan, Q. Chen, J. Xiong and L. Gao, Chem. Mater., 2019, 31, 4732–4742 CrossRef CAS.
- W. Zhou, J. Zhuang, W. Li, C. Hu, B. Lei and Y. Liu, J. Mater. Chem. C, 2017, 5, 8014–8021 RSC.
- Y. Wang, Q. Su and X. Yang, Chem. Commun., 2018, 54, 11312–11315 RSC.
- W. Zhu, X. Meng, H. Li, F. He, L. Wang, H. Xu, Y. Huang, W. Zhang, X. Fang and T. Ding, Opt. Mater., 2019, 88, 412–416 CrossRef CAS.
- J. Wang, C. Cheng, Y. Huang, B. Zheng, H. Yuan, L. Bo, M.-W. Zheng, S.-Y. Yang, Y. Guo and D. Xiao, J. Mater. Chem. C, 2014, 2, 5028–5035 RSC.
- S. Lu, L. Sui, J. Liu, S. Zhu, A. Chen, M. Jin and B. Yang, Adv. Mater., 2017, 29, 1603443 CrossRef.
- B. Wang, J. Li, Z. Tang, B. Yang and S. Lu, Sci. Bull., 2019, 64, 1285–1292 CrossRef CAS.
- F. Yuan, P. He, Z. Xi, X. Li, Y. Li, H. Zhong, L. Fan and S. Yang, Nano Res., 2019, 12, 1669–1674 CrossRef CAS.
- Z. Wang, F. Yuan, X. Li, Y. Li, H. Zhong, L. Fan and S. Yang, Adv. Mater., 2017, 29, 1702910 CrossRef.
- F. Yuan, T. Yuan, L. Sui, Z. Wang, Z. Xi, Y. Li, X. Li, L. Fan, Z. Tan, A. Chen, M. Jin and S. Yang, Nat. Commun., 2018, 9, 2249 CrossRef.
| This journal is © the Partner Organisations 2020 |

