DOI:
10.1039/D0NA00029A
(Paper)
Nanoscale Adv., 2020,
2, 1634-1645
Biogenic synthesis of a green tea stabilized PPy/SWCNT/CdS nanocomposite and its substantial applications, photocatalytic degradation and rheological behavior†
Received
10th January 2020
, Accepted 27th February 2020
First published on 27th February 2020
Abstract
A green tea leaf-derived cadmium sulfide quantum dot-based system containing different weight percentages of single-walled carbon nanotubes (SWCNTs) and polypyrrole, named PSC, was designed via a green method. The photocatalytic degradation of Ponceau BS dye (λmax 505 nm) in the presence of PSC was measured. PSC with the highest weight percentage of SWCNTs (7-PSC) showed maximum photocatalytic activity, with 94.6% dye degradation in 55 minutes of irradiation time. This significant enhancement was due to the synergism in the intrinsic properties of the parent components. Alongside this, the rheological behavior of the prepared nanomaterial PSC was examined at constant (100 s−1) and varying shear rate from 0 to 500 s−1 at a fixed temperature of 25 °C for a specified volume percentage of 0.1% using Castrol class: 15W-40 engine oil as a base fluid. The objective of lowering the viscosity of engine oil by 98.9% (initial: 0.221000 Pa s, final: 0.0022 Pa s.) was achieved by chartering/mixing the prepared PSC nanomaterial into the engine oil. A comparative study of the experimental and simulation outputs implied the high precision of the modeling via a neural network with minute 0.373 average % errors.
Introduction
In line with current estimates, more than 1 billion people globally do not have access to the most basic amenities of life: clean water to drink, pure air to inhale, and fertile soil to cultivate. The rapid development of economic and industrial technologies has given rise to environmental catastrophes and energy shortages. Due to this, there is the forecast of major health misfortunes and even the death of approximately 14![[thin space (1/6-em)]](https://www.rsc.org/images/entities/char_2009.gif) 000 people per day.1 A deal was made in the Paris climate agreement signed in 2017 to control the global warming temperature to 1.5 °C between 2030 and 2050.2 According to the Nature Climate Change Report, the race against time to alleviate climatic changes has begun. To date, countless efforts have been taken to clean the environment and control global warming.2,3 One idea to achieve this is to use nanomaterials that are activated by sunlight and ultraviolet rays, called photocatalysts. Just recently, Saeed et al. designed an Ag-coated alumina nanomaterial, where the deposition of Ag on Al2O3 increased the photocatalytic degradation of methylene blue from 35 to 95%.4 Saeed et al. also synthesized a CoFe2O4 nanomaterial using green route and investigated it in the catalytic degradation of organic dyes in aqueous medium.5 Table S1† gives an account of some more recently published works on the photocatalytic degradation of organic dyes by nanomaterials. However, such materials are unfortunately sensitive towards only ultraviolet light due to their large band gaps (ca. 3.2 eV for TiO2 anatase and 3.0 eV for rutile), which makes up only 3–4% of solar radiation.6,7 Therefore, it is paramount to develop some new photocatalytic materials that have excellent response to visible light.
000 people per day.1 A deal was made in the Paris climate agreement signed in 2017 to control the global warming temperature to 1.5 °C between 2030 and 2050.2 According to the Nature Climate Change Report, the race against time to alleviate climatic changes has begun. To date, countless efforts have been taken to clean the environment and control global warming.2,3 One idea to achieve this is to use nanomaterials that are activated by sunlight and ultraviolet rays, called photocatalysts. Just recently, Saeed et al. designed an Ag-coated alumina nanomaterial, where the deposition of Ag on Al2O3 increased the photocatalytic degradation of methylene blue from 35 to 95%.4 Saeed et al. also synthesized a CoFe2O4 nanomaterial using green route and investigated it in the catalytic degradation of organic dyes in aqueous medium.5 Table S1† gives an account of some more recently published works on the photocatalytic degradation of organic dyes by nanomaterials. However, such materials are unfortunately sensitive towards only ultraviolet light due to their large band gaps (ca. 3.2 eV for TiO2 anatase and 3.0 eV for rutile), which makes up only 3–4% of solar radiation.6,7 Therefore, it is paramount to develop some new photocatalytic materials that have excellent response to visible light.
Cadmium sulfide quantum dots (CdS QDs) are visible light-propelling photocatalysts that have a band gap of 2.42 eV. These can be synthesized via several physical, chemical and biological methods.8–10 However, CdS QDs prepared by conventional methods are intricate and expensive, involve the use of hazardous chemicals, have slow degradation rates and require multiple preparatory steps.11 It has been noted that the photocatalytic activity and stability of CdS can be improved using mesoporous silica and alumina,12–16 but these inorganic compounds (used as the matrix) obstruct the path of light from reaching the CdS QDs. Thus, poor quantum efficiency of CdS as a photocatalyst remains a problem. Other problems associated with current CdS photocatalysts, such as a wide energy band gap, considerably-low utilization efficiency of visible light from solar energy and the high recombination rate of photogenerated e− and h+ pairs severely limit their practical application. Therefore, the need to develop next-generation CdS-based photocatalysts with high visible-light efficiency, low cost, and excellent stability has become imperative.
Since the development of an environmentally benign method for the preparation of nanoparticles is the need of the hour, biological systems (bacteria, fungi, algae and plant extracts) have been reported as remarkable amplifiers. Green tea leaf extract solely originating from Camellia sinensis contains polyphenols, amino acids, caffeine, vitamins, minerals and antioxidants. It is contemplated that these chemical constituents of C. sinensis are beneficial for the preparation of CdS QDs via a biogenic route using green tea extract-based surfactants. Green tea leaf extract acts as a natural surfactant, contributing to homogeneity through the slow rate of its chemical reactions, acting as a stabilizing agent to control the particle size of CdS QDs.17 Such CdS QDs exhibit advantages over chemically synthesized CdS QDs, such as lower toxicity, outstanding quantum capture, high luminescence emission, biodegradability, cost-effectiveness and biocompatibility. One of the biggest advantages of a biogenic route is that organic biomolecules from plant extracts act as stabilizing agents, influencing the particle size of CdS QDs.18 Green tea is reported to have very good anti-oxidant properties, due to it containing organic water-soluble polyphenols – catechins. There are four different types of catechins present in green tea; (−)-epicatechin (EC), (−)-epicatechin-3-gallate (ECG), (−)-epigallocatechin (EGC), and (−)-epigallocatechin-3-gallate (EGCG).19 Among all the catechins present in green tea, studies have revealed that EGCG has the strongest activity.20 This main component, EGCG reacts voluntarily with reactive oxygen species (ROS),21 and thus, it has been found to disperse SWCNTs in water/non-water media as it can easily donate an electron or hydrogen atom. The combination of SWCNTs with EGCG shows stronger anti-oxidant properties towards ROS. Therefore, it is clear that green tea aids the proper dispersion of SWCNTs.19,22
Recently, carbon nanotubes (CNTs) have gained significant attention in the synthesis of nanocomposites with semiconductors.23–26 A literature survey shows that CNTs have three major features. First, they act as an oxidizing agent that induces efficient charge transfer and slows the charge recombination. Second, they act as a photosensitizer that expands the range of the photocatalyst for visible light absorption and increases the use of visible light efficiency. Moreover, the presence of CNTs also hampers the photocorrosion of CdS QDs.15,27
On the contrary, polypyrrole (PPy), is a well-explored conducting polymer that has many applications due to its easy synthesis, high electrical conductivity, excellent electrochemical activity, strong binding or tethering sites for sequential reactions, and high stability. PPy-based nanocomposite materials have been successfully developed for application in the field of wastewater treatment, such as PPy–TiO2,28 AgCl/PPy,29 and PPy/Bi2O2CO3.30
Another problematic area is soil contamination by engine oils coming out of vehicle servicing center areas, where the quality of soil degrades due to the continuous accumulation of frittered engine oil at and around these sites. Therefore, less use of hydrocarbon contaminants that subsequently pollute the environment, i.e. frittered engine oil, has become necessary.31 Lowering the viscosity of engine oils is of significant concern; low viscosity oil pulls less power from engines, decreases frictional drag and sludge formation, cuts fuel consumption, and ultimately, lowers the emissions of CO2, NOx, and other greenhouse gases in the environment. Extensive rheological investigations have been carried out on carbon nanotubes. Table S2† gives a summary of the current literature reported in this field. Although plenty of work has been reported on the preparation, characterization, and applications of binary nanocomposites with PPy, CNTs, and CdS as parent compounds, there has been no focus on exploring the biogenic/green preparation, characterization and applications of ternary nanocomposite materials that combine the above parent compounds together and their significance in terms of photocatalytic degradation and rheology investigation.
Herein, we employed a biogenic/green route to synthesize CdS QDs using Camellia sinensis and fabricated SWCNTs with these CdS in a PPy matrix to form ternary nanocomposites, namely 1-PSC, 5-PSC, and 7-PSC, with varying wt% of SWCNTs. The prepared nanocomposites were fully characterized and the photodegradation efficiency of PPy/CdS, 1-PSC, 5-PSC, and 7- PSC were checked towards PBS dye (λmax 505 nm) in the presence of visible light irradiation. Maximum degradation was achieved in the case of the 7-PSC photocatalyst, which was found to be 94.6% in 55 min of irradiation. Also, by analyzing the repercussions of using a fixed shear rate (100 s−1) and changing the shear rate (0–500 s−1) on the viscosity index of engine oil, the viscosity was reportedly found to diminish by 98.9% on incorporating the 7-PSC nanocomposite in Castrol class: 15W-40, which is a comparatively higher reduction than in previously reported studies. A new correlation is proposed by interpreting experimental and theoretical models, with an average percentage error of 0.373%. The viscosity of the nanofluid (NF) was found to decrease remarkably when the shear rate was varied up to 25 s−1, attributed to the shear-thinning behavior of the NF, while at a shear rate of >25 s−1 it manifested Newtonian behavior. Thus, the developed nanocomposite, PSC, can be concluded to be a remarkable material that has the ability to eradicate environmental pollution and global warming to some extent and, thus, may improve the living standards of people.
Results and discussion
(i) X-ray diffraction studies (XRD)
Fig. 1A–C displays the XRD patterns of 1-PSC, 5-PSC, and 7-PSC nanocomposites. In these patterns, the characteristic peaks of the SWCNTs can be seen at 2θ angles of 25.6° and 42.7°, corresponding to diffractions from the (002) and (100) planes, respectively. The presence of CdS QDs was confirmed from the peaks centered at 26.4°, 43°, and 52°, corresponding to the (111), (220), and (311) crystal planes, respectively.32–34 A mixture of broad and minor peaks exhibited in the 2θ range of 20–31° proves that the successful impregnation of PPy in the nanocomposite has taken place. The shape and intensity of the peaks signify that the PPy matrix has reduced the crystallinity and increased the amorphous nature of the PSC.34,35
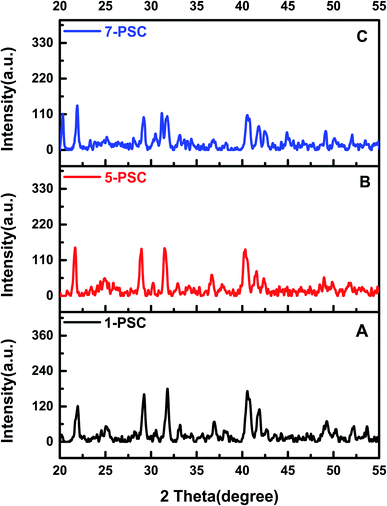 |
| | Fig. 1 XRD patterns of 1-PSC (A), 5-PSC (B), and 7-PSC (C). | |
The average particle size can be calculated using the Scherrer equation:
| | D = 0.9λ/β![[thin space (1/6-em)]](https://www.rsc.org/images/entities/char_2009.gif) cos cos![[thin space (1/6-em)]](https://www.rsc.org/images/entities/char_2009.gif) θ θ | (1) |
where
D is the crystallite size,
β is the full-width at half maximum (FWHM),
θ = the Bragg angle, and λ is the wavelength of CuKα.
The average particle size of the PSC nanocomposite was calculated to be 5.2 nm (Table S3†).
(ii) Morphological studies of the hybrid nanocomposite using SEM, EDX, and TEM analysis
Fig. 2A–C show the SEM micrographs of the 1-PSC, 5-PSC, and 7-PSC nanocomposites at resolutions of 10, 1, and 5 μm, respectively. The figure shows the complete surface interrelation of the nanomaterial, where threads of SWCNTs appear to be surrounded by spherical-shaped CdS QDs enwrapped in PPy.36,37 The latter shows that the interactions between PPy and the SWCNTs are more dominant than the van der Waals interactions between the SWCNTs, leading to the formation of bonds with PPy.36,37 CdS QDs are uniformly bound to the surface of the SWCNTs, illustrating that the chemical bonding between the CdS and SWCNTs would be advantageous for charge transfer, which is discussed further in a previous paper.32
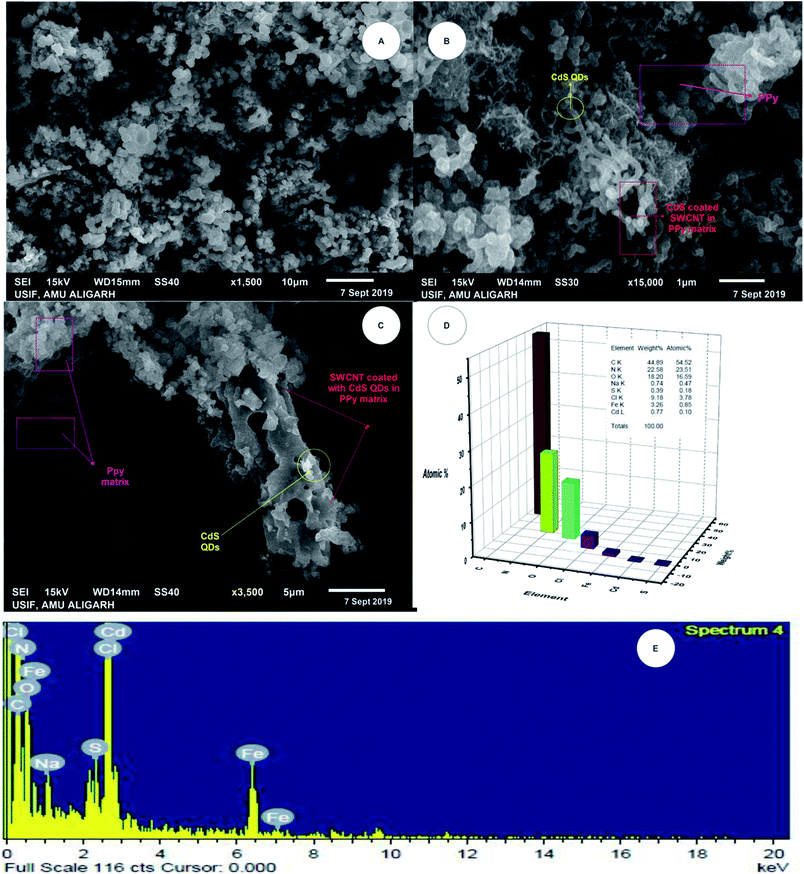 |
| | Fig. 2 SEM micrographs of (A) 1-PSC, (B) 5-PSC, and (C) 7-PSC. (D and E) EDX analysis. | |
Fig. 2D and E show 3D energy dispersive X-ray spectroscopy (EDX) images, giving a complete account of all of the elements present in the nanocomposite material. Peaks for carbon, sulfur, nitrogen, and cadmium are observable in the PSC EDX curve, with Fig. 2D and E, confirming the formation of the ternary nanocomposite. Fig. 3 shows the transmission electron microscopy (TEM) micrographs of the PSC nanocomposite at different magnifications, with a nearly uniform distribution of CdS QDs on the walls and surface of the SWCNTs. A comparative study of the TEM and scanning electron microscopy (SEM) micrographs concluded that the CdS QDs are tightly stacked on the surface of the SWCNTs (diameter: 2.3 nm, length: 5 nm) in a PPy matrix.
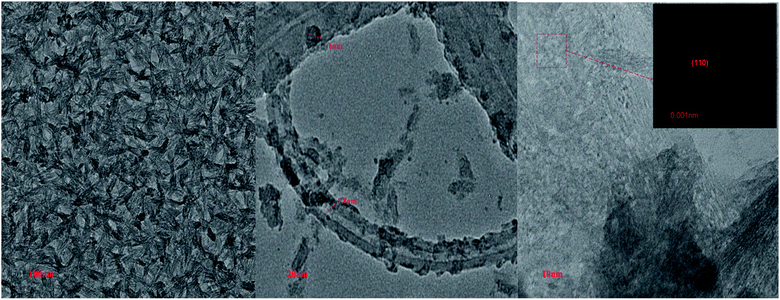 |
| | Fig. 3 TEM micrographs of the PSC nanocomposites at resolutions of 100 nm, 20 nm, and 10 nm. | |
(iii) Detection of functional groups by FTIR spectroscopy
Fig. 4 shows the FTIR spectra of the 7-PSC, 5-PSC, 1-PSC, and SWCNT nanocomposites. The broad absorption band at 3401 cm−1 corresponds to the O–H stretch. The peak at around 1620 and 1550 cm−1 in the SWCNT spectrum correlates with C![[double bond, length as m-dash]](https://www.rsc.org/images/entities/char_e001.gif) C bond vibration (nanotube structures overlapped by carbonyl peaks).37,38 The intensity of these two bands is greater in the nanocomposite samples, indicating the presence of PPy. There are also peaks at 1452 cm−1 (C–N vibrational stretch), 1314 and 1305 cm−1 (
C bond vibration (nanotube structures overlapped by carbonyl peaks).37,38 The intensity of these two bands is greater in the nanocomposite samples, indicating the presence of PPy. There are also peaks at 1452 cm−1 (C–N vibrational stretch), 1314 and 1305 cm−1 (![[double bond, length as m-dash]](https://www.rsc.org/images/entities/char_e001.gif) C–H and C–N in-plane bending), 1173 cm−1 (pyrrole ring vibrations), 1046 cm−1 (C–H or C–N in-plane deformation), 922 cm−1 (C–H out-of-plane deformation vibrations of the ring) and 790 cm−1 (C–H out-of-plane ring deformation).38,39 The weak peaks near 1102, 650, and 605 cm−1 confirm the presence of CdS.34,37 However, with an increase in the wt% of SWCNTs, a slight blue-shift in the FTIR peaks is observed. These shifts in the peak positions may arise due to the rich synergetic interactions between the SWCNTs, CdS, and PPy.34,38
C–H and C–N in-plane bending), 1173 cm−1 (pyrrole ring vibrations), 1046 cm−1 (C–H or C–N in-plane deformation), 922 cm−1 (C–H out-of-plane deformation vibrations of the ring) and 790 cm−1 (C–H out-of-plane ring deformation).38,39 The weak peaks near 1102, 650, and 605 cm−1 confirm the presence of CdS.34,37 However, with an increase in the wt% of SWCNTs, a slight blue-shift in the FTIR peaks is observed. These shifts in the peak positions may arise due to the rich synergetic interactions between the SWCNTs, CdS, and PPy.34,38
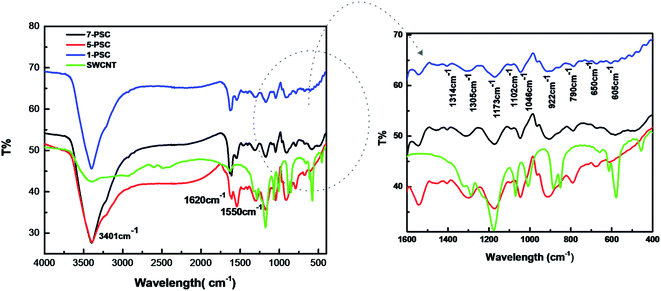 |
| | Fig. 4 FTIR spectra of SWCNTs, 1-PSC, 5-PSC, and 7-PSC. | |
(iv) Study of the photocatalysis and kinetics of photodegradation
The photodegradation activities of PPy/CdS and 1-PSC, 5-PSC, 7-PSC were studied by investigating the decay of PBS dye (λmax 505 nm) in the presence of visible light irradiation. The photodegradation was examined by determining the absorbance of the degraded aliquots, and the results of the UV visible spectra of the samples of PBS dye degraded by the polymer nanocomposites 1-PSC, 5-PSC and 7-PSC are presented (Fig. 5A–C). A continuous decrease in the absorbance of the aliquots indicates the decay of the PBS dye. When the dye solution was irradiated in the absence of a photocatalyst, no decay was observed, confirming that visible light alone cannot degrade the dye. However, upon adding the photocatalyst PC to the solution of the PBS dye in demineralized water (DMW), considerable degradation was observed. The maximum degradation was attained in the case of the 7-PSC photocatalyst, found to be 94.6% in 55 min of irradiation.
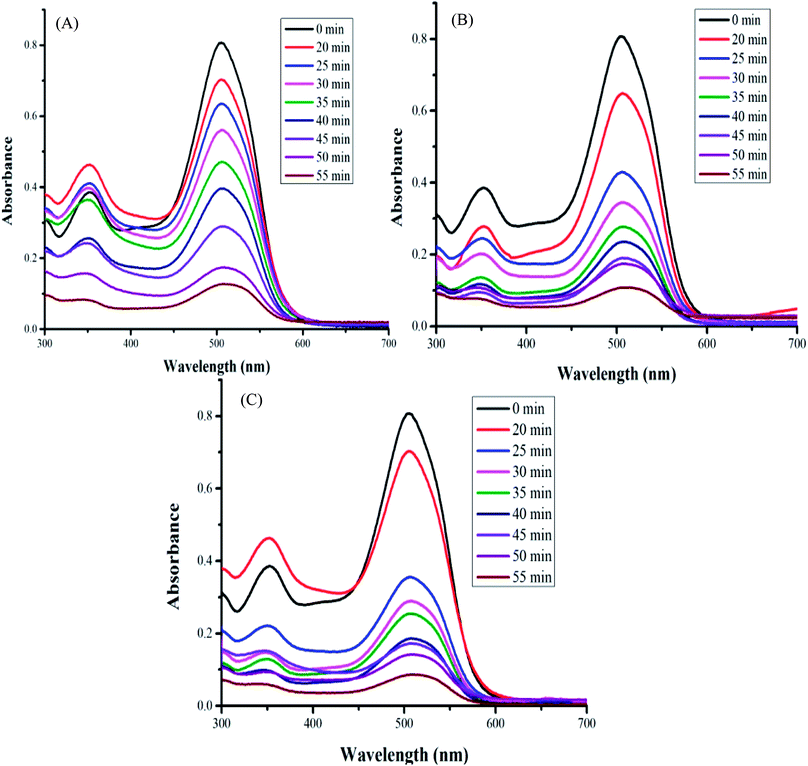 |
| | Fig. 5 UV visible spectra of the samples of PBS dye degraded by the polymer nanocomposites (A) 1-PSC, (B) 5-PSC, and (C) 7-PSC. | |
The Langmuir–Hinshelwood model of pseudo-first-order kinetics was used to gain insight into the reaction kinetics.4,5 The rate of reaction according to the Langmuir–Hinshelwood mechanism upon the interaction of dye and photocatalyst is represented by:
| | | Rate = kr × X* × [H2O2] | (2) |
where
k is the rate constant and
X* represents the adsorption of dye on the photocatalyst, where a higher concentration of H
2O
2 can be neglected and the reaction becomes:
Using the Langmuir–Hinshelwood model, the kinetics of the photodegradation process can be presented by calculating the rate constant of the pseudo first order reaction using the following formula:
| |  | (4) |
where
k is the first-order rate constant,
C0 is the initial concentration,
Ct is the concentration of the PBS dye at a given time (
t). The
Kapp values of the photodegradation were calculated from the first-order kinetics, and the results reported the highest rate of decay in the case of 7-PSC. The rate constants of the photocatalyst were found to be 0.0616, 0.0502, 0.0439, 0.0109 and 0.00018 min
−1 for 7-PSC, 5-PSC, 3-PSC, PC and the blank test, respectively.
Fig. 6A and B represent the kinetics of the photodegradation (
Ct/
C0) and the rate constant curves of the different photocatalysts. The results imply that the highest photodegradation of PBS dye was obtained in the presence of the nanocomposite with a maximum wt% of SWCNTs,
i.e. 7-PSC.
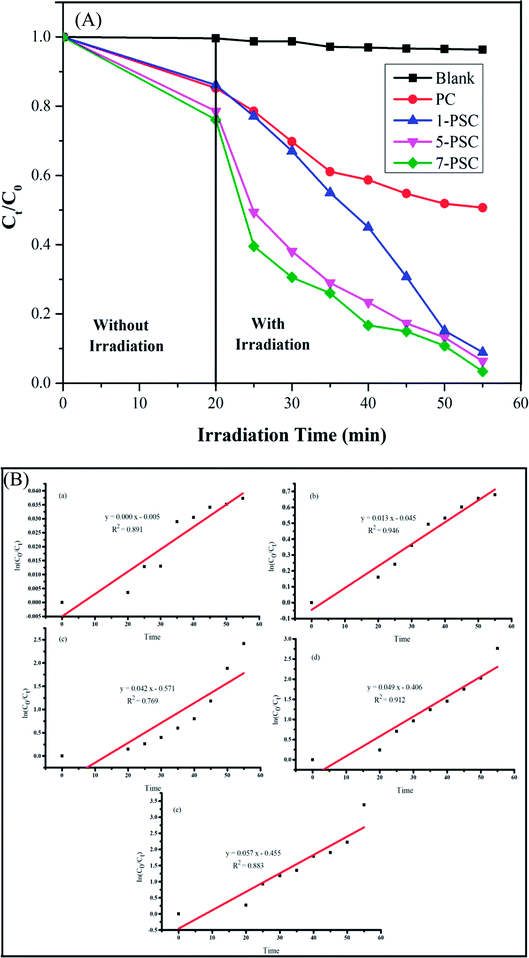 |
| | Fig. 6 (A) Percentage photodegradation of PBS dye in aqueous solution over the blank, PC, 1-PSC, 5-PSC, and 7-PSC nanocomposites in the presence and absence of visible light illumination. (B) The rate constants of the curve of the different photocatalysts against PBS dye: (a) blank test, (b) PC, (c) 1-PSC, (d) 5-PSC, and (e) 7-PSC. | |
(v) The probable mechanism of the photodegradation of the PBS dye
In order to develop an idea of the mechanism and kinetics of the photodegradation, the positions of the valence band (VB) and conduction band (CB) edge potentials of the composites were studied. The VB and CB edge potentials of the CdS and PPy were calculated using eqn (5) and (6):where X is the electronegativity of the constituent atoms, Eg is the band gap energy, and Ec is the energy of free electrons, i.e. 4.5 eV.
The EVB and ECB values of the Cods were found to be 1.89 and −0.41 eV and those of PPy were calculated to be 1.15 and −1.05 eV, respectively, matching those reported in previous literature.40–42 A feasible mechanism of the photocatalytic decay of the PBS dye in the presence of 7-PSC is presented in Fig. 7. Upon irradiating the PC nanocomposite with visible light, the electron from the HOMO of the PPy transfers to the LUMO and, due to the higher conduction potential of the PPy, the e− suddenly moves to the CB of the CdS, thus increasing the transfer rate of e− by diminishing the recombination rate of e− and h+via the synergism of the CdS QDs and PPy. However, the photocatalytic activity was found to be lower in PPy/CdS. In order to enhance its activity, the PPy/CdS nanocomposite was further doped with SWCNTs to minimize the recombination behavior of the photogenerated e− and h+. In the present study, 7-PSC was found to be more effective in photodegradation. Immediately after irradiating the 7-PSC photocatalyst with visible light, an e− shifts from the HOMO to the LUMO of the PPy and thereafter shifts to the CB of CdS because of the higher HOMO potential of PPy than that of CdS. The CB potentials of the PPy and CdS are quite ample for the oxidation and have enough potential to generate superoxide radicals (O2/˙O2− = −0.33 eV vs. NHE)43 therefore, the e− reacts with atmospheric O2 to form ˙O2− (superoxide radicals) and the electron from the CB of the CdS drifts over the surface of the SWCNTs via interfacial contact of CdS, eventually elevating the rate of e− transfer by minimizing the recombination rate. At the same moment, h+ generated in the VB of CdS migrates to the LUMO of PPy due to the lower positive edge band potential of PPy. Later, these generated h+ react with H2O molecules and produce H+ and ˙OH free radicals. For the generation of H2O2 (O2/H2O2 = 0.685 eV vs. NHE)43 the photocatalyst has sufficient band potential to generate H2O2, which then subsequently generates ˙OH radicals. Therefore, the ROS generated in the complete procedure react with the PBS dye and degrade it into simple and non-toxic products.4 The reactions that are proposed to take place in the degradation of the PBS dye are:
| | | PSC + hν → PC (e−/h+), SWCNTs (e−) | (7) |
| | | H2O2 + e− → −OH + ˙OH | (11) |
| | | h+/˙O2−/˙OH + PBS dye → degradation product | (12) |
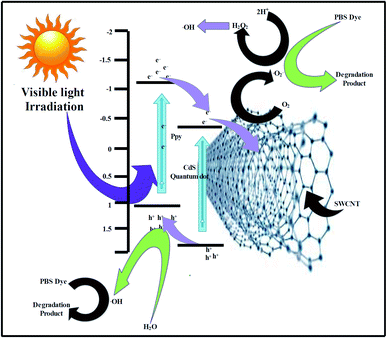 |
| | Fig. 7 A probable mechanism of the photodegradation of PBS dye using the PSC nanomaterial. | |
Additionally, the photocatalytic activity of the photocatalyst 7-PSC was confirmed from its photoluminescence intensity (PL), which is directly related to the recombination rate of the e− and h+ pairs generated upon the irradiation of visible light. The PL spectra of the photocatalyst are presented in Fig. 8 where it can be observed that the photoluminescence of photocatalyst 7-PSC is low and in that of PPy is high. 7-PSC has the lowest PL intensity among the photocatalysts due to it having the lowest recombination rate of the e− and h+ pairs, which results in the photocatalyst having the highest activity. The high PL intensity of PPy is due to its higher recombination rate leading to lower photocatalytic activity.
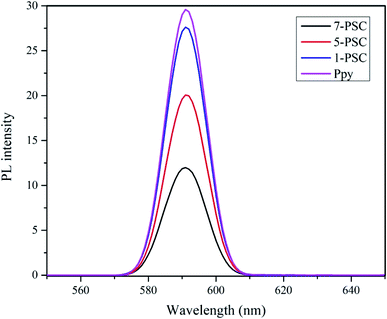 |
| | Fig. 8 Photoluminescence spectra of the various photocatalysts. | |
(vi) Study of scavengers
To confirm the formation of the reactive species accountable for the photodegradation of the dye, various scavengers were used in the photocatalytic experiment. Isopropyl alcohol (IPA), ammonium oxalate (AO) and p-benzoquinone (p-BQ) were used as trapping agents to quench ˙OH, h+, and ˙O2−, respectively. The effects of various scavengers on the photocatalytic activity upon their addition in aqueous solutions of the dye are shown in Fig. 9. The addition of IPA, AO and p-BQ lowers the rate constant values so it can be concluded that all reactive species, as discussed in the photocatalytic mechanism, are accountable, but holes and superoxide radicals are found to be the prime reactive species in the mechanism of the photodegradation of the PBS dye.
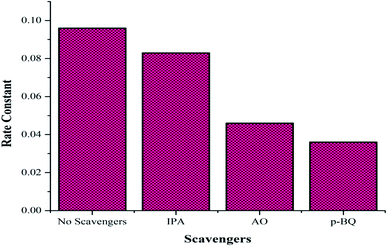 |
| | Fig. 9 Effect of the various scavengers on the photocatalytic activity. | |
(vii) Rheology investigations
This section describes the monitoring of the effect of the use of constant (100 s−1) and changing shear rates (0–500 s−1) on the viscosity of the NF at a temperature of 25 °C. Initially, the viscosity of pure engine oil, Castrol class: 15W-40, used as a base fluid (bf) and measured using an Anton Paar Series rheometer, was reported to be 0.221 Pa s.19 The viscosity index data of the nanocomposite 7-PSC in engine oil was collected and studied with respect to the shear rate. Fig. 10 depicts the viscosity verses time graph at a constant shear rate of 100 s−1. The graph reports a decrease in viscosity up to 65 s and after that it remained constant. A trial was carried out to develop a hypothetical model of the variation in viscosity with respect to time, represented by eqn (10)–(14):| | η = η° + A1![[thin space (1/6-em)]](https://www.rsc.org/images/entities/char_2009.gif) e−(x−xo)/t2 e−(x−xo)/t2 | (13) |
where,η = viscosity (Pa s), T = time (s).
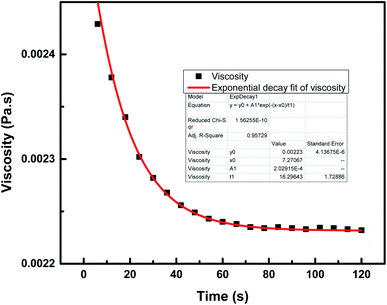 |
| | Fig. 10 Viscosity variation of 7-PSC in 15W-40 engine oil (base fluid) with time at a constant shear rate of 100 s−1. | |
The relationship between the experimental and hypothetical models was determined (Fig. 11), with an average percentage error of 0.373%. As observed in Fig. 12, there was a dramatic decline in the viscosity of the NF with an increase in the shear rate (up to 25 s−1). This inverse proportionality of viscosity with lower shear rate is due to the ‘shear thinning’/‘non-Newtonian’ behavior of the NF. From Fig. 12, it can be seen from the shear rate values, i.e. up to 25 s−1, that the NF retained its shear thinning behavior,44,45 which might be as a result of the interaction of CNT aggregates in the suspension. The liquid around the CNT aggregates becomes dormant or immobile. As a result, the NF viscosity became dense. With an increase in the shear rate, the aggregates were found to break down into smaller or primary structures. It can be said that some of the immobilized liquid might have been released, causing a decline in the viscosity and subsequent shear thinning of the NF. At a shear rate of >90 s−1, there was no change in the NF viscosity index, which might be because all of the solvated layers are removed at higher shear rates, i.e. >90 s−1.44 Therefore, it can be concluded that at a high shear rate there are negligible changes in the viscosity of the NF, thus indicating Newtonian behavior (Fig. 13) in the NF at a shear rate of >90 s−1.44,45
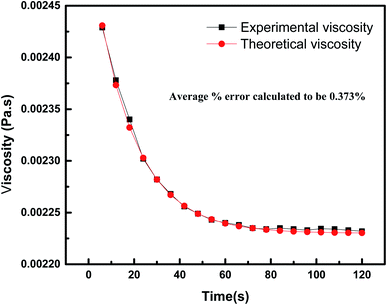 |
| | Fig. 11 Comparison between the experimental and theoretical values of the viscosities of 7-PSC at a constant shear rate. | |
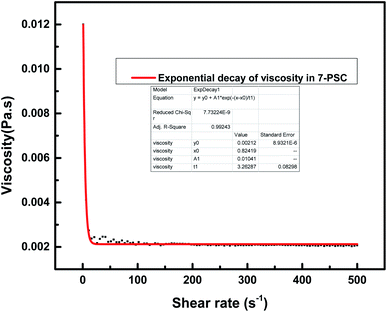 |
| | Fig. 12 Effect of shear rate on the viscosity of the 7-PSC nanocomposite dispersed in 15W-40 engine oil. | |
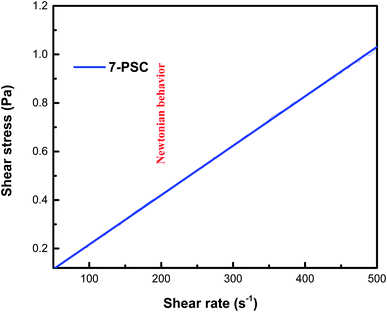 |
| | Fig. 13 Newtonian behavior of the 7-PSC/engine oil nanofluid. | |
Conclusions
The work reports the fabrication of PPy-coated SWCNT and CdS-based ternary nanocomposites via a biogenic/green approach, designated as 1-PSC, 5-PSC and 7-PSC, with different wt% of SWCNTs, and their characterization via various instrumental techniques. The fabricated nanomaterials exhibit excellent photocatalytic activity by effectively degrading PBS dye. The rate constants of the photocatalysts were found to be 0.0616, 0.0502, 0.0439, 0.0109, and 0.00018 min−1 for 7-PSC, 5-PSC, 3-PSC, (PC) and the blank test, respectively. The PSC with the highest weight% of SWCNTs (7-PSC) showed maximum photocatalytic activity with 94.6% dye degradation in 55 minutes of irradiation time. The superior photocatalytic effects of the composite can be attributed to the electron-sink function of the SWCNTs, which may slow the recombination rate of photogenerated e− and h+, thus facilitating the separation of charge carriers. Besides this, the nano material 7-PSC was investigated in terms of its rheological responses at constant (100 s−1) and changing (ranging from 0 to 500 s−1) shear rate, using Castrol class: 15W-40 engine oil as a base fluid. The objective of lowering the viscosity of engine oil by 98.9% was achieved by dispersing the prepared 7-PSC into the engine oil, overcoming the two major challenges of the transport industry: increasing fuel costs and stringent emission standards. The correlation between the experimental and simulation results showed high precision with minute 0.373 average % errors. On the whole, this study reveals good strategies for the preparation of nanomaterials with top-hole activity towards the eradication of environmental pollution. Thus, the developed nanocomposite, PSC, can be concluded to be a remarkable material that has the ability to eradicate environmental pollution and global warming to some extent and, therefore, to possibly promote the living standards of people.
Experimental section
(i) Materials
SWCNTs (diameter, <8 nm; length, 10–30 μm), cadmium sulfate (CdSO4, 99.99% purity), pyrrole and sodium sulfide (Na2S, 98% purity) were purchased from Sigma-Aldrich (India). Green tea (Lipton) was picked from the Indian market for preparing the CdS QDs. The experimental material used for photocatalytic degradation was Ponceau BS dye (Sigma-Aldrich). Castrol engine oil, class: 15W-40 was used as a base fluid to study the rheology. Double distilled water was used in synthesis. All chemical reagents were of analytical grade.
(ii) Modification of the SWCNTs
SWCNTs (1 g) were added into a mixed solution of concentrated nitric acid and sulfuric acid (ratio: 1![[thin space (1/6-em)]](https://www.rsc.org/images/entities/char_2009.gif) :
:![[thin space (1/6-em)]](https://www.rsc.org/images/entities/char_2009.gif) 3) and sonicated for 1 h at room temperature. The resultant was washed many times with DMW until the pH value of the supernatant became 4.00, which was then centrifuged (1300 rpm), and later dried at 65 °C. This functionalization or modification step was used to add several functional groups, including hydroxyl, carboxyl, and carbonyl groups, on the SWCNT surface.9,46
3) and sonicated for 1 h at room temperature. The resultant was washed many times with DMW until the pH value of the supernatant became 4.00, which was then centrifuged (1300 rpm), and later dried at 65 °C. This functionalization or modification step was used to add several functional groups, including hydroxyl, carboxyl, and carbonyl groups, on the SWCNT surface.9,46
(iii) Preparation of green tea (Camellia sinensis) leaf extract
Crushed C. sinensis leaves (3 g) in methanol (30 mL) were incubated for 1 d. The extract obtained was filtered through Whatman (grade number 1) filter paper and stored at 4 °C for further use.
(iv) Biogenic/green preparation of CdS quantum dots
The CdS QDs were prepared in two steps. 0.025 M CdSO4 (2 mL) was mixed with the extract obtained from the green tea (30 mL) and incubated for 3 d in the absence of light (step-I). 0.025 M Na2S (0.5 mL) was added to the above solution and incubated for another 4 d (step-II). The resultant solution of CdS QDs was bright yellow in color, and was further centrifuged (13![[thin space (1/6-em)]](https://www.rsc.org/images/entities/char_2009.gif) 000 rpm, 10 min). Contaminants were removed from the CdS QDs by washing the solid three times with DMW. Finally, the pellet was evaporated for further characterization studies.18,47 The steps for preparing the CdS QDs are shown in Scheme 1.
000 rpm, 10 min). Contaminants were removed from the CdS QDs by washing the solid three times with DMW. Finally, the pellet was evaporated for further characterization studies.18,47 The steps for preparing the CdS QDs are shown in Scheme 1.
 |
| | Scheme 1 Representation of the experimental steps involved in C. sinensis extract-mediated green CdS QD synthesis. | |
(v) Preparation of PPy/CdS (PC) and PPy/SWCNT/CdS (PSC)
PC was prepared through the in situ polymerization of PPy using ferric chloride with green tea extracted CdS quantum dots.48 The preparation of ternary nanocomposites (PPy/SWCNT/CdS, PSC) followed similar steps. Varying amounts (0.01, 0.05, and 0.07 mg) of SWCNTs were dispersed in water (250 mL) via sonication for 10 min. The above prepared PC solution was then added to an aqueous solution of SWCNTs, sonicated (2 h) at 80 °C and then dried overnight.9 Finally, the required ternary nanocomposites were obtained, PPy/SWCNT/CdS, named 1-PSC, 5- PSC and 7-PSC.
(vi) Materials characterization
Powder X-ray diffraction (XRD) patterns were obtained with a Rigaku X-ray powder diffractometer (PW-1148/89, Netherlands) using Cu Kα radiation (λ = 0.15418 nm). SEM and EDX mapping images were recorded using an LEO 435-VF microscope, to give an idea of surface morphology. The internal framework of the nanocomposite particles was characterized by TEM using a Jeol H-7500 spectrometer. FTIR spectra were acquired using a PerkinElmer spectrophotometer (Model Spectrum-BX, USA) in the wavelength range of 4000–400 nm.
(vii) Photocatalytic degradation measurements
The photocatalytic degradation ability of the prepared nanocomposites was tested by checking the degradation of PBS dye (λmax 505 nm) in aqueous solution under a UV-light source. The photocatalytic performance of prepared powder was performed in a photochemical reactor made from Pyrex glass using a 500 W medium pressure tungsten lamp as a UV light source. During the entire experimental setup, the temperature of the aqueous solution of dye was stabilized at around (2 ± 0.5 °C) by circulating refrigerated water to prevent it from heating up as a result of the irradiation from the UV-lamp (IR and short wavelength). An appropriate amount of the photocatalyst (0.2 g) was used per 200 mL of the dye solution in the reactor. Before irradiation, the suspension was sonicated in the dark for 20 min so that the dye underwent complete adsorption on the surface of the photocatalyst to obtain adsorption–desorption equilibrium. Therefore, loss of dye was taken into account due to adsorption on the surface of the catalyst. The zero time reading was obtained from a blank solution kept in the dark, but otherwise treated similarly to the irradiated solutions. The degradation efficacy of the designed nanocomposites was evaluated by quantifying the change in the absorbance of the dye using a PerkinElmer spectrophotometer in accordance with the Beer–Lambert law.40 The degradation percentage of the dye was calculated using eqn (18):| | | Degradation% = (Co − Ct)/Co × 100 | (18) |
where Co is the initial concentration and Ct is the concentration at a particular time (t).
(viii) Measurements of rheological activity
The above-synthesized PSC nanocomposite powder was dispersed in Castrol class: 15W-40 engine oil via sonication (30 min) to form the NF. To study the changes in viscosity of the NF, a rheological investigation was carried out using an Anton Paar series rheometer (MCR10 2SN81270415FW 3.70), initially at a constant rate and then at changing shear rates at T = 25 °C.19 The measuring plate was filled with NF (0.15 mL), and its viscosity was measured. The interdependence or proper dispersion of the bf and nanocomposite play major roles in the rheological investigation of the NF.36
List of abbreviations (in alphabetical order)
| bf | Base fluid |
|
C. sinensis
|
Camellia sinensis (green tea) |
| CdS-QD | Cadmium sulfide quantum dots |
| CNT | Carbon nanotubes |
| CB | Conduction band |
| HOMO | Highest occupied molecular orbital |
| LUMO | Lowest occupied molecular orbital |
| NF | Nanofluid |
| PBS dye | Ponceau BS dye |
| PC | Polypyrrole/CdS (or PPy/CdS) |
| PSC | PPy/SWCNT/CdS |
| ROS | Reactive oxygen species |
| SWCNT | Single-walled carbon nanotubes |
Conflicts of interest
There are no conflicts of interest between the authors.
Acknowledgements
The authors gladly thank the instrumental facilities provided by the Chairman, Department of Chemistry, A.M.U. and USIF (University Sophisticated Instruments Facility), A.M.U., Aligarh. One of the authors (Yashfeen Khan) is obliged to thank the University Grants Commission (UGC), Government of India, for financial aid. The authors also wish to thank the anonymous reviewers and editor for their fruitful suggestions and enlightening comments.
References
- S. Bolisetty, M. Peydayesh and R. Mezzenga, Chem. Soc. Rev., 2019, 48, 409–724 RSC.
- Y. Robiou du Pont, M. L. Jeffery, J. Gütschow, J. Rogelj, P. Christoff and M. Meinshausen, Nat. Clim. Change, 2016, 7, 38 CrossRef.
- M. R. Awual, J. Mol. Liq., 2019, 284, 502–510 CrossRef CAS.
- M. Saeed, M. Muneer, N. Akram, N. Afzal and M. Hamayun, Chem. Eng. Res. Des., 2019, 148, 218–226 CrossRef CAS.
- M. Saeed, A. Mansha, M. Hamayun, A. Ahmad, A. Ulhaq and M. Ashfaq, Z. Phys. Chem., 2017, 232, 359–371 Search PubMed.
- X. Yuan, D. Floresyona, P. H. Aubert, T. T. Bui, S. Remita, S. Ghosh, F. Brisset, F. Goubard and H. Remita, Appl. Catal., B, 2019, 242, 284–292 CrossRef CAS.
- T. Peng, P. Zeng, D. Ke, X. Liu and X. Zhang, Energy Fuels, 2011, 25, 2203–2210 CrossRef CAS.
- X. Yang, X. Yang, T. Wang, B. Wang, Q. Chen, Y. Wang and D. Liu, New J. Chem., 2020, 44, 64–71 RSC.
- B. I. Robel, B. A. Bunker and P. V. Kamat, Adv. Mater., 2005, 17, 2458–2463 CrossRef.
- R. Lakshmipathy, N. C. Sarada, K. Chidambaram and S. K. Pasha, Int. J. Nanomed., 2015, 10, 183–188 CAS.
- N. Ahmad, S. Sultana, S. Sabir and M. Z. Khan, J. Photochem. Photobiol., A, 2020, 386, 112129 CrossRef.
- Y. Kwang and H. Park, Energy Environ. Sci., 2011, 4, 685–694 RSC.
- T. Hirai, K. Suzuki and I. Komasawa, J. Colloid Interface Sci., 2001, 244, 262–265 CrossRef CAS.
- H. Kato and A. Kudo, J. Phys. Chem. B, 2002, 106, 5029–5034 CrossRef CAS.
- M. K. Arora, A. S. K. Sinha and S. N. Upadhyay, Ind. Eng. Chem. Res., 1998, 37, 1310–1316 CrossRef CAS.
- S. M. Gupta and M. Tripathi, High Energy Chem., 2012, 46, 1–9 CrossRef CAS.
- A. S. Reddy, C. Chen, S. C. Baker, C. Chen, J. Jean, C. Fan, H. Chen and J. Wang, Mater. Lett., 2009, 63, 1227–1230 CrossRef CAS.
- C. S. De Castro, M. L. Davies, M. Gnanamangai and P. Sudhagar, ACS Appl. Nano Mater., 2018, 1, 1683–1693 CrossRef.
- Y. Khan, A. Siddiqui and A. Ahmad, ACS Omega, 2019, 4, 16956–16962 CrossRef CAS PubMed.
- Y. Chen, Y. D. Lee, H. Vedala, B. L. Allen and A. Star, ACS Nano, 2010, 4, 6854–6862 CrossRef CAS PubMed.
- H. Sies, Exp. Physiol., 1996, 82, 291–295 CrossRef PubMed.
- A. J. Uddin, A. Watanabe, Y. Gotoh, T. Saito and M. Yumura, Text. Res. J., 2016, 82, 911–919 CrossRef.
- K. Woan, G. Pyrgiotakis and W. Sigmund, Adv. Mater., 2009, 21, 2233–2239 CrossRef CAS.
- N. Fermi and L. Equilibration, ACS Nano, 2007, 1, 13–21 CrossRef PubMed.
- K. O. Vieira, J. Bettini, J. L. Ferrari and M. A. Schiavon, Mater. Chem. Phys., 2015, 149, 405–412 CrossRef.
- S. Ravindran, S. Chaudhary, B. Colburn, M. Ozkan and C. S. Ozkan, Nano Lett., 2003, 3, 447–453 CrossRef CAS.
- S. Y. Madani, F. Shabani, M. V. Dwek and A. M. Seifalian, Int. J. Nanomed., 2013, 8, 941–950 Search PubMed.
- F. Gao, X. Hou, A. Wang, G. Chu, W. Wu, J. Chen and H. Zou, Particuology, 2016, 26, 73–78 CrossRef CAS.
- S. Gu, B. Li, C. Zhao, Y. Xu, X. Qian and G. Chen, J. Alloys Compd., 2011, 509, 5677–5682 CrossRef CAS.
- Q. Wang, L. Zheng, Y. Chen, J. Fan, H. Huang and B. Su, J. Alloys Compd., 2015, 637, 127–132 CrossRef CAS.
- N. S. Bonal, B. R. Paramkusam and P. K. Basudhar, J. Hazard. Mater., 2018, 351, 54–62 CrossRef CAS PubMed.
- T. Peng, P. Zeng, D. Ke, X. Liu and X. Zhang, Energy Fuels, 2011, 25, 2203–2210 CrossRef CAS.
- D. Cai, L. Wang, W. Han, L. Li, Y. Zhang, J. Li, D. Chen and H. Tu, J. Mater. Chem. A, 2019, 7, 806–815 RSC.
- G. S. Manohari and M. D. Sweetlin, J. Nanosci. Nanotechnol., 2019, 5, 727–729 Search PubMed.
-
J. Xu, T. Lin and Y. Du, in Earth and Environmental Science, IOP Conference Series, 2018, vol. 108, p. 022040 Search PubMed.
- H. S. Kim, J.-H. Kim, S. Ramesh and Y. Haldorai, RSC Adv., 2017, 7, 36833–36843 RSC.
- Z. Tavakoli, M. Seifi and M. Bagher, Optik, 2018, 158, 882–892 CrossRef.
- M. A. Salam, A. Y. Obaid and R. M. El-shishtawy, RSC Adv., 2017, 7, 16878–16884 RSC.
- C. Sun, X. Li, Z. Cai and F. Ge, Electrochim. Acta, 2019, 296, 617–626 CrossRef CAS.
- N. Ahmad, S. Sultana, G. Kumar, M. Zuhaib and S. Sabir, J. Environ. Chem. Eng., 2019, 7, 102804 CrossRef CAS.
- N. Khatoon, A. Mishra and H. Alam, BioNanoSci., 2015, 5, 65–74 CrossRef.
- N. Khatoon, T. Ahmad, R. Phula and M. Sardar, New J. Chem., 2017, 41, 2055–2061 RSC.
- B. M. Pirzada, R. K. Kunchala and B. S. Naidu, ACS Omega, 2019, 4, 2618–2629 CrossRef CAS PubMed.
- A. Asadi, S. Aberoumand, A. Moradikazerouni, F. Pourfattah, G. Żyła, P. Estellé, O. Mahian, S. Wongwises, H. M. Nguyen and A. Arabkoohsar, Powder Technol., 2019, 352, 209–226 CrossRef CAS.
- A. Asadi, Energy Convers. Manage., 2018, 175, 1–10 CrossRef CAS.
- L. Ma, H. Sun, Y. Zhang and Y. Lin, Nanotechnology, 2008, 19, 115709 CrossRef PubMed.
- B. Raj, S. Dwivedi, A. A. Al-khedhairy and J. Musarrat, Colloids Surf., B, 2011, 85, 207–213 CrossRef PubMed.
- M. Omastova, M. Trchova, J. Kova and J. Stejskal, Synth. Met., 2003, 138, 447–455 CrossRef CAS.
Footnote |
| † Electronic supplementary information (ESI) available. See DOI: 10.1039/d0na00029a |
|
| This journal is © The Royal Society of Chemistry 2020 |
 Open Access Article
 a,
Anees
Ahmad
*a,
Nafees
Ahmad
a,
Faraz Rasheed
Mir
b and
Gerhard
Schories
b
a,
Anees
Ahmad
*a,
Nafees
Ahmad
a,
Faraz Rasheed
Mir
b and
Gerhard
Schories
b
![[thin space (1/6-em)]](https://www.rsc.org/images/entities/char_2009.gif) 000 people per day.1 A deal was made in the Paris climate agreement signed in 2017 to control the global warming temperature to 1.5 °C between 2030 and 2050.2 According to the Nature Climate Change Report, the race against time to alleviate climatic changes has begun. To date, countless efforts have been taken to clean the environment and control global warming.2,3 One idea to achieve this is to use nanomaterials that are activated by sunlight and ultraviolet rays, called photocatalysts. Just recently, Saeed et al. designed an Ag-coated alumina nanomaterial, where the deposition of Ag on Al2O3 increased the photocatalytic degradation of methylene blue from 35 to 95%.4 Saeed et al. also synthesized a CoFe2O4 nanomaterial using green route and investigated it in the catalytic degradation of organic dyes in aqueous medium.5 Table S1† gives an account of some more recently published works on the photocatalytic degradation of organic dyes by nanomaterials. However, such materials are unfortunately sensitive towards only ultraviolet light due to their large band gaps (ca. 3.2 eV for TiO2 anatase and 3.0 eV for rutile), which makes up only 3–4% of solar radiation.6,7 Therefore, it is paramount to develop some new photocatalytic materials that have excellent response to visible light.
000 people per day.1 A deal was made in the Paris climate agreement signed in 2017 to control the global warming temperature to 1.5 °C between 2030 and 2050.2 According to the Nature Climate Change Report, the race against time to alleviate climatic changes has begun. To date, countless efforts have been taken to clean the environment and control global warming.2,3 One idea to achieve this is to use nanomaterials that are activated by sunlight and ultraviolet rays, called photocatalysts. Just recently, Saeed et al. designed an Ag-coated alumina nanomaterial, where the deposition of Ag on Al2O3 increased the photocatalytic degradation of methylene blue from 35 to 95%.4 Saeed et al. also synthesized a CoFe2O4 nanomaterial using green route and investigated it in the catalytic degradation of organic dyes in aqueous medium.5 Table S1† gives an account of some more recently published works on the photocatalytic degradation of organic dyes by nanomaterials. However, such materials are unfortunately sensitive towards only ultraviolet light due to their large band gaps (ca. 3.2 eV for TiO2 anatase and 3.0 eV for rutile), which makes up only 3–4% of solar radiation.6,7 Therefore, it is paramount to develop some new photocatalytic materials that have excellent response to visible light.
![[thin space (1/6-em)]](https://www.rsc.org/images/entities/char_2009.gif) cos
cos![[thin space (1/6-em)]](https://www.rsc.org/images/entities/char_2009.gif) θ
θ![[double bond, length as m-dash]](https://www.rsc.org/images/entities/char_e001.gif) C bond vibration (nanotube structures overlapped by carbonyl peaks).37,38 The intensity of these two bands is greater in the nanocomposite samples, indicating the presence of PPy. There are also peaks at 1452 cm−1 (C–N vibrational stretch), 1314 and 1305 cm−1 (
C bond vibration (nanotube structures overlapped by carbonyl peaks).37,38 The intensity of these two bands is greater in the nanocomposite samples, indicating the presence of PPy. There are also peaks at 1452 cm−1 (C–N vibrational stretch), 1314 and 1305 cm−1 (![[double bond, length as m-dash]](https://www.rsc.org/images/entities/char_e001.gif) C–H and C–N in-plane bending), 1173 cm−1 (pyrrole ring vibrations), 1046 cm−1 (C–H or C–N in-plane deformation), 922 cm−1 (C–H out-of-plane deformation vibrations of the ring) and 790 cm−1 (C–H out-of-plane ring deformation).38,39 The weak peaks near 1102, 650, and 605 cm−1 confirm the presence of CdS.34,37 However, with an increase in the wt% of SWCNTs, a slight blue-shift in the FTIR peaks is observed. These shifts in the peak positions may arise due to the rich synergetic interactions between the SWCNTs, CdS, and PPy.34,38
C–H and C–N in-plane bending), 1173 cm−1 (pyrrole ring vibrations), 1046 cm−1 (C–H or C–N in-plane deformation), 922 cm−1 (C–H out-of-plane deformation vibrations of the ring) and 790 cm−1 (C–H out-of-plane ring deformation).38,39 The weak peaks near 1102, 650, and 605 cm−1 confirm the presence of CdS.34,37 However, with an increase in the wt% of SWCNTs, a slight blue-shift in the FTIR peaks is observed. These shifts in the peak positions may arise due to the rich synergetic interactions between the SWCNTs, CdS, and PPy.34,38


![[thin space (1/6-em)]](https://www.rsc.org/images/entities/char_2009.gif) e−(x−xo)/t2
e−(x−xo)/t2


![[thin space (1/6-em)]](https://www.rsc.org/images/entities/char_2009.gif) :
:![[thin space (1/6-em)]](https://www.rsc.org/images/entities/char_2009.gif) 3) and sonicated for 1 h at room temperature. The resultant was washed many times with DMW until the pH value of the supernatant became 4.00, which was then centrifuged (1300 rpm), and later dried at 65 °C. This functionalization or modification step was used to add several functional groups, including hydroxyl, carboxyl, and carbonyl groups, on the SWCNT surface.9,46
3) and sonicated for 1 h at room temperature. The resultant was washed many times with DMW until the pH value of the supernatant became 4.00, which was then centrifuged (1300 rpm), and later dried at 65 °C. This functionalization or modification step was used to add several functional groups, including hydroxyl, carboxyl, and carbonyl groups, on the SWCNT surface.9,46
![[thin space (1/6-em)]](https://www.rsc.org/images/entities/char_2009.gif) 000 rpm, 10 min). Contaminants were removed from the CdS QDs by washing the solid three times with DMW. Finally, the pellet was evaporated for further characterization studies.18,47 The steps for preparing the CdS QDs are shown in Scheme 1.
000 rpm, 10 min). Contaminants were removed from the CdS QDs by washing the solid three times with DMW. Finally, the pellet was evaporated for further characterization studies.18,47 The steps for preparing the CdS QDs are shown in Scheme 1.


