
 Open Access Article
 This Open Access Article is licensed under a
 Creative Commons Attribution 3.0 Unported Licence
Tumbling with a limp: local asymmetry in water's hydrogen bond network and its consequences
Hossam
Elgabarty
 *a and
Thomas D.
Kühne
ab
*a and
Thomas D.
Kühne
ab
aDynamics of Condensed Matter and Center for Sustainable Systems Design, Chair of Theoretical Chemistry, University of Paderborn, Warburger Str. 100, D-33098, Paderborn, Germany. E-mail: hossam.elgabarty@upb.de
bPaderborn Center for Parallel Computing and Institute for Lightweight Design, University of Paderborn, Warburger Str. 100, D-33098, Paderborn, Germany
First published on 7th April 2020
Abstract
Ab initio molecular dynamics simulations of liquid water under equilibrium ambient conditions, together with a novel energy decomposition analysis, have recently shown that a substantial fraction of water molecules exhibit a significant asymmetry between the strengths of the two donor and/or the two acceptor interactions. We refer to this recently unraveled aspect as the “local asymmetry in the hydrogen bond network”. We discuss how this novel aspect was first revealed, and provide metrics that can be consistently employed on simulated water trajectories to quantify this local heterogeneity in the hydrogen bond network and its dynamics. We then discuss the static aspects of the asymmetry, pertaining to the frozen geometry of liquid water at any given instant of time and the distribution of hydrogen bond strengths therein, and also its dynamic characteristics pertaining to how fast this asymmetry decays and the kinds of molecular motions responsible for this decay. Following this we discuss the spectroscopic manifestations of this asymmetry, from ultrafast X-ray absorption spectra to infrared spectroscopy and down to the much slower terahertz regime. Finally, we discuss the implications of these findings in a broad context and their relation to the current notions about the structure and dynamics of liquid water.
1 Introduction
The many remarkable properties exhibited by liquid water remain the subject of intensive ongoing research. While the exceptional nature of many of these properties warrant investigation in their own right, it is also clear that a better understanding of the molecular basis of the properties of liquid water is of paramount relevance to biology, chemistry, materials science, and geology, just to name a few disciplines.1,2 It is currently recognized that water is no-longer merely the background against which many reactions, and most biochemical reactions, are taking place. Water is just as important as any of the key (bio)chemical players on any stage.3,4 Shortcomings in our understanding of liquid water are, ipso facto, limitations to our understanding of the chemistry in aqueous or humid environments. Despite of intensive efforts, many fundamental details are unknown and many questions remain heavily debated. It is remarkable that we basically do not understand exactly how microwaves heat water,5 nor how heat dispersion through the HB network actually works. Similarly, the microscopic mechanism underlying water's dielectric function in the low frequency region has been under constant debate, so is the basic tetrahedral structure of water, which has been challenged based on some interpretations of water's thermodynamic and spectroscopic characteristics.6At the heart of the properties of liquid water is its dynamic hydrogen bond (HB) network with its fluctuating local tetrahedral geometry and collective behaviour. In fact, the remarkable properties of water and also its so-called anomalies can ultimately be traced back in one way or another to this dynamic network when combined with the small molecular size and molecular polarity.7,8 Because of this, characterizing individual HB dynamics and localized motional modes is far from sufficient for a full understanding of the complexities of the underlying dynamical processes. The collective and emergent nature of the ensuing properties simply prohibits such a naive reductionist view. As a drastic example of this, it is enough to recognize that while it is true that water without HBs would have been a gas under ambient conditions, it is also true that without the HB cooperativity, water would have been a very viscous liquid that would hardly be similar to the matrix of life that we know. This is because the average HB energy in liquid water is an order of magnitude higher than thermal fluctuations at room temperature9 and it is only through the collective motion that water flows as it does. It is also because of these cooperative modes that the dynamics of water remains a difficult problem for analytical theory that cannot be adequately handled by molecular hydrodynamic theory or continuum-model-based theories, which is why atomistic computer simulations are usually required to interpret experimental findings. Indeed, simulations have provided insights that were crucial for the interpretation of some of the most important spectroscopic investigations of water.10–12
In this article, we are going to review some of our efforts in unraveling a particular aspect of water's HB network, which is the local asymmetry in the strengths of HBs donated or accepted from/to a water molecule in bulk liquid water under ambient conditions.9,13–19 While it is well known that the HB strength in water or in ice exhibits a broad distribution trivially due to thermal fluctuations, the novel and non-trivial aspect that was revealed is that in liquid water (but not in hexagonal ice), thermal motion leads to a significant population of molecules, where the strength of the two donor or acceptor interactions has an extreme disparity with as much as 25% of the molecules having one donor (acceptor) interaction that is more than six times stronger than the other donor (acceptor) interaction and a significant population having both kinds of interactions highly asymmetric. This interesting feature of water's HB network was revealed using ab initio molecular dynamics (AIMD) simulations20,21 combined with a condensed phase energy decomposition analysis based on absolutely localized molecular orbitals (ALMO-EDA).13,17 The strength of this method is that it permits a rigorous quantification of the amount of charge-transfer by locating the variationally lowest energy state without charge-transfer.9 Thereby, the issues of under/overestimation of charge-transfer and contamination due to charge overlap effects are circumvented.22 The decomposition of the collective interaction energy in the condensed phase into physically meaningful components revealed this significant instantaneous asymmetry within the strength of the local donor–acceptor contacts.
In the following sections of this review we will discuss how this novel aspect was first revealed, its static aspects pertaining to the frozen geometry of liquid water at any given instant of time, and its dynamic characteristics pertaining to how fast this asymmetry decays and the kinds of molecular motions that bring about such decay. Following this we discuss the consequences of this asymmetry, in particular how it shows up or influences different kinds of spectroscopy from ultrafast X-ray absorption (XA) spectra to line shapes in infrared (IR) spectroscopy and down to the much slower terahertz (THz) regime. Finally, we discuss the implications of these findings in a broad context and in particular, their relation to the current notions about the structure and dynamics of liquid water.
2 ALMO-EDA and the discovery of the instantaneous asymmetry in liquid water's hydrogen bond network
2.1 ALMO-EDA: energy decomposition analysis based on absolutely localized molecular orbitals
Intermolecular bonding is the end result of a complicated interplay of multipolar electrostatic interactions, polarization effects, geometric distortions, Pauli repulsion, and charge-transfer interactions (also known as covalent, delocalization, or donor–acceptor orbital interactions).22 The goal of an electron-decomposition analysis (EDA) is to isolate these physically relevant components from the total energy of an interacting system composed of several subunits. In the case of liquid water the subunits are of course the individual water molecules, and the total energy is, for example, that obtained from an ab initio calculation (wave function-based or density functional-based) for a system composed of many interacting water molecules. In this case, what is of interest to us is bulk liquid water as simulated using periodic boundary conditions.The EDA method based on ALMOs has the key advantage that it permits the calculation of the energy lowering associated with the electron transfer due to hydrogen bonding, using a self-consistent approach that includes cooperativity effects, which are essential for a correct description of the HB network. The ALMO-EDA method works by separating the total interaction energy (ΔETOT) into molecular frozen density (ΔEFRZ), molecular polarization (ΔEPOL), and pair-wise charge-transfer (ΔECT) terms, i.e.
 | (1) |
Most importantly for the present context the RS perturbative occupied–virtual electron transfer can be further decomposed into forward and back-donation components for each pair (i,j) of molecules:
 | (2) |
 | ||
| Fig. 1 A derived linear model relating the orthogonal component of the 1H shielding tensor in water (σ⊥) to the stabilization energy due to charge-transfer (ΔECT). The shielding tensor component in the limit of a HB-free water molecule is denoted as σ∞⊥. Reproduced from ref. 17/CC BY. | ||
The elegance of ΔECT (and also ΔQCT, the fractional charge-transfer that is responsible for the ΔECT term) is that these metrics are solely based on the two-body delocalization-energy and charge-transfer components, which are readily computable for any given molecular configuration, and as such can be directly used to study static HB networks, as well as the HB rearrangement dynamics without incorporating any (arbitrary) geometry-based criterion of a HB.
2.2 Instantaneous asymmetry in the first coordination shell of liquid water
When the ALMO-EDA technique was used to analyze snapshots extracted from AIMD trajectories of liquid water, the fractional electron transfer through a HB turned out to be a few milli-electrons only, but nevertheless this contributes significantly to the total HB energy and is roughly equal to the contribution of the polarization term.9,24Fig. 2 depicts the average of the strongest five acceptor and donor contributions to the average delocalization energy of a molecule (ΔECT). Examination of the depicted pattern of charge-transfer interactions reveals that electron delocalization is dominated by two strong donor (acceptor) interactions that together are responsible for 93% of the delocalization energy of a single molecule. The third and the fourth strongest donor (acceptor) interactions contribute only 5% and correspond to back donation of electrons to (from) the remaining two first-shell neighbours. This is to say that a HB donor still weakly donates electrons to the unoccupied orbitals of the HB acceptor, and vice versa. The remaining 2% correspond to the delocalization energy to (from) the second and more distant coordination shells. | ||
| Fig. 2 Average contributions of the five strongest acceptor (ΔEN→C) and donor (ΔEC→N) interactions. The right-most column shows that higher-order delocalization does not significantly contribute to the overall binding (see also shaded areas in Fig. 5). Angular brackets within the axes labels denote averaging over all central water molecules and all AIMD snapshots. Reproduced from ref. 13. | ||
Comparison of the strengths of the first and second strongest donor–acceptor interactions (〈ΔECT〉 ∼25 and ∼12 kJ mol−1, respectively) with that of the water dimer (∼9 kJ mol−1) immediately suggests that each water molecule can be considered to form on average two donor and two acceptor bonds, in agreement with the usual tetrahedral structural picture of the coordination shell in liquid water. What is striking in Fig. 2, however, is the substantial difference in the strengths of the first and second strongest interactions, which implies that a large fraction of water molecules experience a significant asymmetry in their local environment. The same pattern is also clear when the energies of the two strongest donors or acceptors are plotted together, which is depicted in the bottom two panels of Fig. 6. In a simple-minded picture, where the strength of a HB directly correlates with its length, this instantaneous asymmetry would correspond to a structural picture where, due to thermal agitation, many water molecules are in distorted local tetrahedral environments. We will shortly scrutinize this simple geometric picture in more quantitative rigor, and anticipating the discussion, we assert that things are not that simple regarding the relation between HB strength and the geometry in the first coordination shell.
To characterize the aforementioned asymmetry of the two strongest donor or acceptor contacts of a molecule, a dimensionless asymmetry parameter
 | (3) |
 indicates that for 75% of the molecules either γA or γD is more than 0.5, which means that for the majority of molecules the strongest donor or acceptor contact is at least two times stronger than the second strongest. Furthermore, the peak in the region of high γ in Fig. 3 indicates the presence of molecules with significant asymmetry in HB strengths, for both donated and accepted HBs simultaneously. This is also clear from the line at
  , indicating that 25% of the molecules have the strongest interaction six times stronger than the second-strongest.
 | ||
Fig. 3 The normalized probability density function of the asymmetry parameters γA and γD, respectively. The probability of finding a molecule in a bin can be found by dividing the corresponding density value by the number of bins (that is, 400). The dashed black lines at  partition all molecules into four groups of equal sizes. Reproduced from ref. 13. partition all molecules into four groups of equal sizes. Reproduced from ref. 13. | ||
To understand the origin of this asymmetry, the geometry of donor–acceptor pairs involved in the first and second strongest interactions was compared. It was found that the strength of the interaction is greatly affected by the intermolecular HB distance R = d(OD − OA) and to a weaker extent by the HB angle β = ∠(ODOAH) (see Fig. 4 for a depiction of R and β), while the other geometric parameters have only a minor influence on ΔECT. The histograms of ΔECT, R, and β for the two strongest donor interactions are shown in Fig. 5. The strong overlap between all the histograms suggests that some second strongest interactions have the same energetic and geometric characteristics as the strongest contacts. This implies that the observed electronic asymmetry cannot be attributed to the presence of two distinct types of HBs – weak and strong. It is rather a result of continuous deformations of a typical HB. Another important conclusion that can be made from the distributions in Fig. 5 is that relatively small variations of the HB distance ΔR ∼ 0.2 Å and angle Δθ ∼ 5° to 10° entail remarkable changes in the strength and electronic structure of HBs. Specifically, the average intermolecular oxygen–oxygen distances for the strongest and second strongest interactions differ only by ΔR ∼ 0.2 Å and are not large enough to justify asymmetric models of liquid water. This is a sober reminder that with the highly non-linear relation between the HB strength and HB geometry, simple-minded projections of the features of one onto the another can be very misleading, and a high degree of asymmetry in the former does not imply a dramatic distortion in the latter. Furthermore, analysis of the structure of the molecular chains defined by the strongest bonds (that is, one donor and one acceptor for each molecule) shows that their directions are random and without any long-range order (e.g. rings, spirals or zig-zags) on the length scale of the simulation box (∼15 Å).
 | ||
| Fig. 4 Definition of HB distance R and angle β. | ||
 | ||
| Fig. 5 Energetic and geometric characteristics of the instantaneous asymmetry. The probability distribution of (a) HB strength, (b) intermolecular distance R and (c) HB angle β for the first (red) and second (blue) strongest donor interactions C–N. The filled areas show the contribution of configurations, for which back donation to a nearby donor is stronger than donation to the second strongest acceptor. Distributions for acceptor interactions N–C are almost identical and not shown. Reproduced from ref. 13. | ||
Because of the slow decay of the distribution tails in Fig. 5, a quantification of the concentration of single-donor and single-acceptor molecules was not attempted. Defining such configurations using a distance, angle or energy cutoff is an unavoidably arbitrary procedure. A quantitative analysis of the network, which was performed for the same molecular configurations as in Kühne et al.,27 shows that according to the commonly used geometric definitions of hydrogen bonds,28–30 the structure of water is distorted tetrahedral with only a small fraction of broken bonds.
Finally, with an asymmetry in liquid water that is due to thermal distortions, it is very interesting to compare this with the results of ALMO-EDA in hexagonal ice, which is generally regarded to be a solid with symmetric HBs. Such a comparison has been performed and indeed does provide further insight into the origin of the asymmetry in liquid water and its relation to the HB network structure.14Fig. 6 shows the joint distribution of the strengths of the two pairs of donor and acceptor HBs in ice. The ensuing two-dimensional distribution is characterized by the peak centered at −18.7 kJ mol−1, large deviation from the average values (σ = 7.1 kJ mol−1), and a small correlation coefficient of 0.1. Such a tiny correlation coefficient indicates that the two HBs are essentially independent of each other and the asymmetry in ice (points in the distribution that are significantly displaced from the diagonal line) arises trivially from the very broad distribution of HB strengths. As in the case of liquid water, this asymmetry is a result of thermal fluctuations around the average symmetric structure. The distribution of the strength of the donor interactions in liquid water exhibits a drastically different pattern with two pronounced features. In addition to a broad peak resembling the one for ice, there is a sharp peak in the region of high γD. The center of the first peak is shifted to lower energies (−12 kJ mol−1) and is somewhat broader than that of ice. The second peak indicates the presence of molecules with one intact and one broken donor HB (ΔEC→N > −1 kJ mol−1). To estimate the fraction of molecules responsible for the sharp asymmetric feature, we draw a somewhat arbitrary boundary at γD = 0.8 (dashed line in Fig. 6), which divides the distribution into the regions of ice-like configurations and highly asymmetric configurations. Fig. 6 shows that 26% (18%) of molecules in the liquid phase are characterized by γD > 0.8 (γA > 0.8) compared to 2% in ice.
 | ||
| Fig. 6 Distribution of molecules in ice and liquid water according to the strength of the first two strongest donor (ΔEC→N) and acceptor (ΔEN→C) interactions. The X or Y axis is assigned randomly, i.e. independently from the HB energies. The dashed white lines are the lines of the ideal symmetry γD = 0 and γA = 0. The dashed black lines correspond to γD = 0.8 and γA = 0.8, respectively. Reprinted with permission from ref. 14. Copyright 2014 American Chemical Society. | ||
In hexagonal ice, the uncorrelated thermal motion of molecules around their crystallographic sites broadens the range of HB energies, and thus creates a noticeable asymmetry in the donor and acceptor contacts of each water molecule. This is trivially a broad distribution without any particular correlation between the strengths of the pair of donor (or acceptor) interactions at any center. In water, while the majority of molecules still exhibit HB patterns similar to those in ice and retain a four-fold coordination with only moderately distorted tetrahedral configurations, there is a drastic difference in a large fraction of molecules with very weak HBs, which are elongated by as much as 0.5 Å and exhibit a wide range of angular distortions. A detailed analysis is given in ref. 14. These results imply that the traditional view of water as a four-fold coordinated nearly tetrahedral liquid is more appropriate than the recently proposed asymmetric model.6,28,31 However, the substantial fraction of molecules with broken HBs undoubtedly affects the physical properties and chemical behavior of liquid water. Starting from Section 3 we investigate some of the consequences of this aspect of liquid water.
2.3 Contrasting the asymmetry in donor versus acceptor interactions
Fig. 6 reveals an interesting difference between donor and acceptor interactions in liquid water. While the corresponding plots in ice are identical, they are rather different in liquid water. Thermal disorder affects the strengths of donor and acceptor interactions in a quantitatively different manner. First, while also significant, the fraction of molecules with broken acceptor bonds (18% with γD > 0.8) is lower than the corresponding fraction in γA (26%). Furthermore, the distribution of the acceptor interactions does not exhibit a high-γA peak, which would match the high-γD peak. This difference indicates that within the broken HBs, only the donor of electrons remains under-coordinated, while the acceptor (i.e., hydrogen atom) forms a HB with another donor that becomes overcoordinated. The existence of a significant fraction of overcoordinated donors is supported by the relatively large contribution of the third interaction shown in Fig. 2 and is consistent with the well-known fact that the distribution of electron acceptors around a water molecule is more disordered than that of the donors.32 This phenomenon is attributed to the existence of the so-called “negativity track” between the lone pairs of a water molecule, which facilitates the disordered motion of electron acceptors around the central donor.33,34 This asymmetry in donor versus acceptor interactions is also reminiscent of the asymmetry in solvation energy of anions and cations,35 and a possible relation between both phenomena.2.4 Dynamics of the asymmetry
The overlapping distributions in Fig. 5 suggest that, despite the difference in the strength of the donor–acceptor contacts, their nature is similar and that the strongest interacting pair can become the second strongest in the process of thermal motion and vice versa. To estimate the time scale of this process, it is necessary to examine how the average energies of the first two strongest interactions fluctuate in time. The instantaneous values at time t (solid lines in Fig. 7a) were calculated using the ALMO EDA terms for 3501 snapshots separated by 20 fs (448![[thin space (1/6-em)]](https://www.rsc.org/images/entities/char_2009.gif) 128 local configurations) by averaging over time origins τ separated by 100 fs and over all surviving triples:
128 local configurations) by averaging over time origins τ separated by 100 fs and over all surviving triples: | (4) |
 | ||
| Fig. 7 Relaxation of the instantaneous asymmetry. Time-dependence of the (a) average HB strength, (b) intermolecular distance R and (c) HB angle β for the first ΔEC→N1st (red) and second ΔEC→N2nd (blue) strongest donor interactions. The solid lines show the instantaneous values, whereas the dashed lines correspond to the time-average values. Time-dependent characteristics of acceptor interactions ΔEN→C are almost identical and not shown. Reproduced from ref. 13. | ||
Fig. 7a shows that the strength of the first two strongest interactions oscillates rapidly and that ∼80 fs after an arbitrarily chosen time origin, the strongest interaction becomes slightly weaker than the second strongest (note that first and second refer to their order at t = 0). The amplitude of the oscillations decreases and the strength of both interactions approaches the average value of ∼20 kJ mol−1 on the time scale of hundreds of femtoseconds. The decay of the oscillations indicates fast decorrelation of the time-separated instantaneous values because of the strong coupling of a selected pair of molecules with its surroundings. In other words, while the energy of a particular HB fluctuates around its average value, this bond has approximately equal chances of becoming weak or strong after a certain period of time independently of its strength at t = 0. This effect is due to the noise introduced by the environment and can be observed in ultrafast IR spectroscopy experiments.36 The time averages shown in Fig. 7 are physically meaningful and can be calculated accurately only for the time intervals that are shorter than the average lifetime of a HB.37 The small residual asymmetry that is still present after 500 fs (Fig. 7a) is an indication of the slow non-exponential relaxation behaviour that characterizes the kinetics of many processes in liquid water.29 Specifically, the non-exponential relaxation of the HB lifetime is due to the coupling between HB fluctuations and diffusion,29 and the non-exponential tail in Fig. 7a a likely manifestation of this process. At variance, the fast relaxation component in Fig. 7a is more correlated with HB stretch motions and closely matches the time scale of 170 fs found from the spectral diffusion of the OH stretch peak in IR spectroscopy.12,36,38
In addition to the instantaneous values of ΔEC→N(t) at time t, the dashed lines in Fig. 7a show the corresponding averages over a time interval of length t. These values were calculated by averaging over time origins τ, all snapshots lying in the time interval from τ to τ + t and over all surviving triples:
 | (5) |
The kinetics and mechanism of the asymmetry relaxation presented here are supported by data from ultrafast IR spectroscopy, which can directly observe the spectral diffusion of the OH stretch peak with a fast component that monoexponentially decays at 170 fs.12,38,39 In conclusion, it is important to point out that the dynamics of the asymmetry closely parallels the dynamics of the spectral diffusion of the OH stretch peak, with a fast component that is mostly associated with the intermolecular O–O stretch motion, and a longer time dynamics that is associated with the collective HB network restructuring.40
3 Electronic signature of the asymmetry: XA spectroscopy
The time behaviour described above implies that the instantaneous asymmetry can, in principle, be detected by X-ray spectroscopy, which has a temporal resolution of several femtoseconds and is highly sensitive to perturbations in the electronic structure of molecules.28 To identify possible relationships between the spectroscopic features and asymmetry, the X-ray absorption (XA) spectrum of liquid water was calculated at the oxygen K-edge using the half-core-hole transition potential formalism within all-electron density functional theory.41–43 Although the employed computational approach overestimates intensities in the post-edge part of the spectrum and underestimates the pre-edge peak and overall spectral width, it provides an accurate description of the core-level excitation processes and semi-quantitatively reproduces the main features of the experimentally measured spectra. The localized nature of the 1s core orbitals allows disentangling the spectral contributions from molecules with different asymmetry. To this end, all molecules were separated into four groups according to the asymmetry of their donor and acceptor environments, as shown in Fig. 3. As already mentioned, choosing boundaries at distributes all molecules into four groups of approximately equal sizes (that is, 25 ± 2%). Fig. 8 shows four XA spectra obtained by averaging the individual contributions of molecules in each group. It reveals that molecules in the symmetric environment exhibit pronounced post-edge peaks, whereas molecules with high asymmetry of their environment are characterized by the amplified absorption in the pre-edge region. Furthermore, the relationship between the asymmetry and absorption intensity is non-uniform: the pre-edge peak is dramatically increased in the spectrum for the 25% of molecules in the most asymmetric group
  , for which the strongest interaction is more than six times stronger than the second strongest. As a consequence, the pre-edge feature of the calculated XA is dominated by the contribution of molecules in the highly asymmetric environments (Fig. 8c). The pronounced pre-edge peak in the experimentally measured XA spectrum of liquid water has been interpreted as evidence for the so-called “rings and chains” structure, where ∼80% of molecules have two broken HBs.28,31 These results however suggest that this feature of the XA spectrum can be explained by the presence of a smaller fraction of water molecules with high instantaneous asymmetry. Although the employed XA modelling methodology does not allow a precise estimate of the size of this fraction, the result is consistent with that of recent theoretical studies at an even higher level of theory, which have demonstrated that the main features of the experimental XA spectra can be reproduced in simulations based on conventional nearly tetrahedral models.44,45
 | ||
| Fig. 8 XA spectra of liquid water. (a) Comparison of the calculated and experimental28 XA spectra. (b) Calculated XA spectra of the four groups of molecules separated according to the asymmetry of their donor (γD) and acceptor (γA) environments, as shown in the inset. (c) Contributions of the four groups into the total XA spectrum. The colour coding is shown in the inset above. Reproduced from ref. 13. | ||
Thus, the investigation of the relation between local inhomogeneities in the HB network and the XA spectrum revealed an interesting and important connection between relatively small geometric perturbations in the HB network and the large asymmetry in the electronic ground state, as well as the XA spectral signatures of the core-excitation processes. This helps to reconcile the two existing and seemingly opposite models of liquid water – the traditional symmetric and the more recently proposed asymmetric model.
4 Vibrational signature of the asymmetry: inhomogeneous broadening of the O–H stretch peak
On the one hand, the structural picture obtained from XA spectroscopy essentially corresponds to snapshots of the system that are frozen on the time scales of nuclear motion. Raman and IR spectroscopy, on the other hand, directly probe the resonance frequencies of the vibrational motions of the ionic cores of the atoms. Moreover, the intrinsic time resolution of time-resolved IR spectroscopy is about 50 fs.46 It is also well known that the strength of a HB is correlated with the frequency of the covalent OH bond stretch motion, with stronger HBs being associated with a red-shift in the frequency.47,48 In fact, it is mainly because of the disorder-induced inhomogeneities in HB strength that the line width of the OH stretch peak in the vibrational spectra of liquid water is much broader than that in the gas-phase, i.e. the OH stretch peaks are inhomogeneously broadened with some contribution from homogeneous broadening as well.10,12,47 Furthermore, there seems not to be a substantial extent of motional narrowing and thus the total linewidth is close to the inhomogeneous limit.47 Taken these features of the OH stretch peak together, one can immediately conclude that the instantaneous asymmetry might exhibit some observable effects within vibrational spectroscopy. In fact, it is tempting to say that vibrational spectroscopy and its lower frequency sibling, THz spectroscopy, are the natural techniques to probe any structural or dynamic manifestations of the local HB asymmetry.As already alluded to above, ALMO-EDA offers a powerful and consistent way to quantify the strength of HB interactions in liquid water, and hence to quantitatively establish the aforementioned relationships between the structure and dynamics of the HB network and its characteristics on the OH IR and Raman peaks, as obtained from linear, non-linear, and time-resolved techniques.10 Along these lines of reasoning, ALMO-EDA was used to investigate the relationship between the vibrational fluctuations of the OH stretching modes and the strength of the HB, as quantified using ΔECT (Fig. 9).18,49 The instantaneous fluctuations in the frequency of the OH modes were calculated using a wavelet-based time-series analysis.50,51
 | ||
| Fig. 9 Equilibrium distributions of OH stretch frequency versus HB strength, as quantified by the ΔECT terms (left) and the associated charge-transfer terms (ΔQCT in units of elementary charge, right). The frequencies of the OH modes were calculated using a wavelet-based time-series analysis.18,50,51 Reproduced from ref. 18/CC BY. | ||
The clear correlation in Fig. 9 indeed shows that ΔECT, taken as a measure of HB strength, linearly correlates with the frequency of the covalent OH stretch vibration. A linear regression yields
| ΔECT (kJ mol−1) = 0.0392 − 150.6ω (cm−1), | (6) |
Most importantly, the linear trend in Fig. 9 suggests a means to unravel the consequences of asymmetry on the inhomogeneously broadened OH stretch peak. In order to see how this is possible, let us now describe the two O–H stretch vibrations on a single water molecule as two coupled harmonic oscillators which we denote as O–H1 and O–H2, with the same mass m and restoring force constants k1 and k2 that are coupled by the intramolecular harmonic coupling constant k′ (see Fig. 10).
 | ||
| Fig. 10 Coupled harmonic oscillators with mass m and force constants k1, k2, and k′. Reprinted with permission from ref. 15. Copyright 2013 American Chemical Society. | ||
If k1 = k2, as would be the case for water in the gas phase, or for a symmetric HB environment in the condensed phase, then the coupled normal modes of the system ν1 = [1,1] and ν3 = [−1,1] are the familiar symmetric and asymmetric stretch modes. The energy splitting between the two eigenmodes is given by  (k1=3 is used to denote that k1 = k3 in this case). We can see in this case that both modes equally contribute to the two coupled normal modes, i.e. the two O–H stretch vibrations are perfectly and symmetrically coupled, and the hydrogen atoms move together with the same amplitude. Harmonic mode analysis on a water monomer in vacuum using DFT gives a splitting Δω13 = 104 cm−1 at 0 K (Fig. 11A).15 For comparison, CCSDT(T) calculations at the complete basis set limit yield Δω13 = 109.8 cm−1.52
 | ||
| Fig. 11 The symmetric (ν1) and asymmetric (ν3) stretching modes of a water molecule and their splitting frequency Δω13 = ω3 − ω1 (A) in vacuum at 0 K, (B) in vacuum at 300 K, (C) of the H-bond donor of a water dimer at 0 K, and (D) in liquid water at 300 K, respectively. See eqn (7) for the definition of fd. Reprinted with permission from ref. 15. Copyright 2013 American Chemical Society. | ||
However, when k1 ≠ k2, the two normal modes are  , with a splitting Δω13 ∝ (1 + δ2) where
  .15 The asymmetry in the restoring force leads to a decoupling of the two O–H stretch vibrations, and the degree of decoupling depends on the difference between k1 and k2. In fact, ab initio calculations reveal that the decoupling of the two O–H stretch modes in the HB donor of the water dimer is almost complete, each mode being roughly composed of 85% from one O–H stretch, with only a contribution of 15% from the other O–H being mixed in ref. 53. In this case, normal mode analysis shows, as expected, that the frequency splitting increases to 221 cm−1 (Fig. 11C).
The simple model of two coupled harmonic oscillators shows that one consequence of the local asymmetry in the HB environment is to decouple the two intramolecular O–H bond vibrations, as well as to increase the frequency splitting between the resultant symmetric and the asymmetric stretch modes. Indeed, it becomes possible to quantify the HB asymmetry with the degree of decoupling fd between the two O–H bond vibrations
 | (7) |
 | (8) |
 is the vibrational density of states of νk. It can be shown that for n = 2, this method is equivalent to a normal mode analysis performed on the thermally averaged Hessian matrix and generalized to anharmonic systems at finite temperatures, and that the zero-temperature limit yields the usual normal modes.54
With this procedure, the two normal modes of each water molecule, ν1 and ν3, were extracted from MD trajectories at finite temperatures. A splitting of 103 cm−1 was obtained from MD trajectories of a single water molecule in vacuum at 300 K (Fig. 11B). The essentially identical results obtained at 0 K (using the familiar normal mode analysis) and 300 K (from MD trajectories) not only validate this approach, but further indicate that temperature and anharmonicity effects alone have a negligible influence on the mode coupling. The average value of the parameter fd turns out to be 0.07, in clear contrast to the water dimer case with 〈fd〉 = 0.92, thus indicating an almost full decoupling between the two O–H stretch vibrations of the HB donor molecule, as already pointed out. Finally, in the case of liquid water at 300 K, 〈fd〉 turns out to be 0.82, with an average splitting of 137 cm−1 (Fig. 11D). In this case, the modes resemble those of the water dimer and, interestingly, also share similarities with the instantaneous normal modes of water molecules at water/vapor interfaces.55 Interestingly, it was found that for fd ≈ 1 and Δω13 > 400 cm−1, the dipole moment of water molecules shifts to a lower value by 0.25 D with respect to the fully symmetric case in bulk water. This resembles interfacial water molecules in water/vapor systems.16 By empirically fitting the data obtained from MD, it was also shown that the relation between fd and the frequency splitting is closely approximated by Δω13 = C(1 + fd2), where C is an empirical fitting parameter. This relation holds in the range fd = 0 until fd ≈ 0.8, after which, the highly asymmetric configurations of water exhibit a broader distribution in Δω13 and a skew towards higher frequency splitting. For the configurations, where a HB is totally broken, Δω13 increases up to more than 400 cm−1.
Although the asymmetry in HB strength seems to be the strongest factor in determining the frequency splitting, and hence, the inhomogeneous broadening of the O–H stretch peak in liquid water, other factors exhibit a role as well. In a later investigation the role of the intramolecular coupling between the two O–H stretch modes (k′) was scrutinized.16 It was found that k′ does modulate the frequency splitting, in a reverse fashion to fd, with the overall effect that the observed frequency splitting in liquid water is less than the value that is predicted solely based on the effect of fd. As a consequence, the instantaneous asymmetry of the local HB environment around a water molecule in bulk water was shown to account for the observed inhomogeneous broadening of the O–H stretch peak. While the role played by the finite-temperature distribution of HB strength in the inhomogeneous broadening of the O–H stretch peak is neither surprising nor a novel finding (see ref. 48 for instance), the new aspect here is that the distribution of HB strength is associated with the peculiar feature of mostly coming in pairs of strong–weak HBs, which are localized on the water molecules, a feature that is most clearly seen on the right side of Fig. 12 as fd approaches 1.
 | ||
| Fig. 12 The normalized joint distribution of vibrational descriptors fd and Δω13 for liquid water. 〈Δω13〉 as a function of fd is also shown. Error bars denote the standard deviation of 〈Δω13〉 for each value of fd with a bin size of 0.025. The continuous line has been obtained by fitting the data of 〈Δω13〉 with the expression 〈Δω13〉 ∝ 1 + fd2. Insets I–IV denote the vibrational spectra of the symmetric and asymmetric stretching modes ν1 and ν3 of the four representative regions in the (fd,Δω13) space. The corresponding vibrational spectra of ν1 and ν3 are the averages of the decomposed vibrational density of states of configurations within each region. Reprinted with permission from ref. 15. Copyright 2013 American Chemical Society. | ||
5 Enhancement of asymmetry under external electric fields
The study of water under electric fields is immensely interesting for several reasons. First, water does exist under moderately to substantially strong electric fields in a variety of natural settings, for example within biological membrane channels, in the vicinity of electrodes and ions in solution, and in cracks at crystal surfaces. The electric field intensity in some of these cases can be of the order of 109 V m−1.56–58 Another reason of interest for studying water under electric fields is that the electric field-induced anisotropy can give rise to new interesting features59–64 and can also enhance the equilibrium structural/dynamical features in a liquid, facilitating their study and hence providing new ways to understand the complexities of liquid state kinetics and thermodynamics.65 A good case for the latter is the long-established study of dielectric relaxation both experimentally and theoretically,66,67 and for the former, the discovery of non-vanishing rotational–translational cross-correlations in water under electric fields.59,64,68 External electric fields, both static and fluctuating, are known to induce a variety of field-induced anisotropies in liquid water.69,70 In the context of HB asymmetry, the significance of application of an external electric field lies in the possibility of exploiting these field-induced anisotropies to enhance the asymmetry, thus for instance to facilitate its experimental investigation. Naturally, in this case, the origin of the – possibly enhanced – anisotropy would not be the thermal fluctuations, but rather the external field itself.The effect of an electric field on the local HB asymmetry in water was investigated with AIMD using an intense electric field square pulse with an intensity of 4.3 × 10⁹ V m−1.19 The pulse strength was chosen such that it induces an ultrafast re-orientation of the water molecules on a sub-picosecond time scale. Under these conditions, it was shown that within 300 fs, the water molecules reach a steady-state average orientation angle of 37 degrees (〈cos(θ)〉 ≈ 0.8), where the angle is calculated between the molecular bisector and the direction of the external field. This ballistic re-orientation of the water molecules substantially increases the temperature of the system up to 650 K. Once the pulse is switched off, this orientational anisotropy decays exponentially and vanishes within 750 fs. The influence of the pulse on the asymmetry of the HB network is shown in Fig. 13, which depicts the joint probability distribution of the asymmetry parameters γA and γD at various times after the pulse. To distinguish the electric field induced effects from effects that are only due to the high temperature of the system (in particular the drop in the HB density), the joint probability distribution was compared to that found in a field-free microcanonical trajectory simulated at an average temperature of 650 K (right-most plot of Fig. 13). We see in Fig. 13 that immediately following the pulse, the probability distribution has its peak at the top right corner of the plot, where the molecules exhibit a high level of asymmetry simultaneously in the two asymmetry parameters. The asymmetry patterns in Fig. 13 are very distinct from the situation in liquid water under ambient conditions, where the largest population of molecules exhibits high asymmetry in one, but not in both asymmetry parameters. This is also distinctively different from the field-free situation in hexagonal ice, where the asymmetries in both parameters are uncorrelated.14 A comparison with field-free conditions shows that the electric field appreciably enhances the asymmetry. This enhanced asymmetry then gradually decays once the field is switched off, so that after 1 ps, the joint distribution has almost fully relaxed to the situation found in the high-temperature trajectory.
 | ||
| Fig. 13 Progression of the joint distribution of the dimensionless asymmetry parameters γA and γD after an intense ultrafast rectangular electric field pulse. Time t = 500 fs corresponds to the end of the pulse. | ||
The enhanced HB asymmetry under an electric field can be explained by the field-induced anisotropy in HB strength. It was found that the pulse leads to a strong anisotropy in the HB orientation along with the field-induced molecular re-orientation. Moreover, the better a HB is aligned with the field, the shorter it is. This arrangement makes charge-transfer through the HB more favorable as it corresponds to a lowering in the electric potential along the HB, and thus leads to an overall strengthening of the HB. These findings agree with the directional pair density distributions that were recently reported from simulations of water under electric fields.62–64 After the pulse, the HB orientational anisotropy decays on the same time scale as the molecular one. Consequently, it was found that the strongest acceptor or donor interaction is typically pointing along the field axis, while the weaker one is more-or-less in the orthogonal plane. The molecules that are simultaneously engaged in two HBs and exhibit a high degree of asymmetry (γ > 0.8) are those simultaneously donating (or accepting) one HB in parallel and another one in an orientation that is more-or-less orthogonal to the field.
6 Water under a single THz pulse: influence of asymmetry on molecular re-orientation
For a long time, one obstacle that has hindered a better understanding of water's HB network has been the absence of an experimental technique that directly probes this network. The pico- to sub-picosecond lifetimes of HBs37 are too short for the NMR and dielectric spectroscopy time window and are only indirectly accessible by time-resolved IR spectroscopy.71 The recent technological feasibility of intense THz laser pulses has lately changed this state of affairs, opening new possibilities for the direct coherent excitation and control of the intermolecular and collective HB modes in water.72–75Leveraging these experimental advances, we have recently investigated the (sub)picosecond pathways of energy transfer from a THz pulse to water, using a novel THz experimental setup (Fig. 14) in combination with MD simulations.76 So far, the physical nature of such fast relaxation processes within the HB network of water has been poorly understood and is heavily debated.67 Our study has elucidated that the energy of a single THz pulse with a frequency of 0.7 THz couples mostly to the rotational dynamics of the water molecules, with 85% of the energy going directly to rotational motions and only 15% of the energy being dumped into restricted molecular translational motion. After the pulse, the highly efficient ro-translational coupling in liquid water, together with the rigidity of the liberational potential (15–20 THz), leads to an increase of the molecular translational kinetic energy, which lasts for ∼1 ps and decays on the same time scale as the observed THz Kerr effect. Interestingly, THz spectroscopy can also shed some light on the local asymmetry of the HB network. When we examined the relation between field-induced molecular re-orientation and the asymmetry parameters γ, we found that the molecules with high asymmetry (γA/D > 0.8) are orientationally more labile than the molecules with low γ (γA/D < 0.2). The average angle between the molecular bisectors and the field axis is depicted in Fig. 15 for high- and low-γ, where γ was calculated at the time corresponding to the peak THz field intensity (108 V m−1), denoted as t = 0 on the x-axis. As expected from the lifetime of the asymmetry, the impact on the orientational dynamics can be observed for a few hundred femtoseconds before and after the point in time where γ is calculated. We believe that focusing on HB strengths and asymmetries in these strengths can be a more fruitful pathway than trying to identify geometric defects in the structure of water, and can help us in understanding the relationship between orientational relaxation of a single molecule and the collective relaxation, a problem which remains at the frontier in the studies of orientational relaxation.67,77
 | ||
| Fig. 14 Dynamic THz Kerr effect. An intense THz pump pulse is used to induce optical birefringence in water, which is monitored by an optical probe pulse that becomes elliptically polarized upon traversing through the medium.76,78 | ||
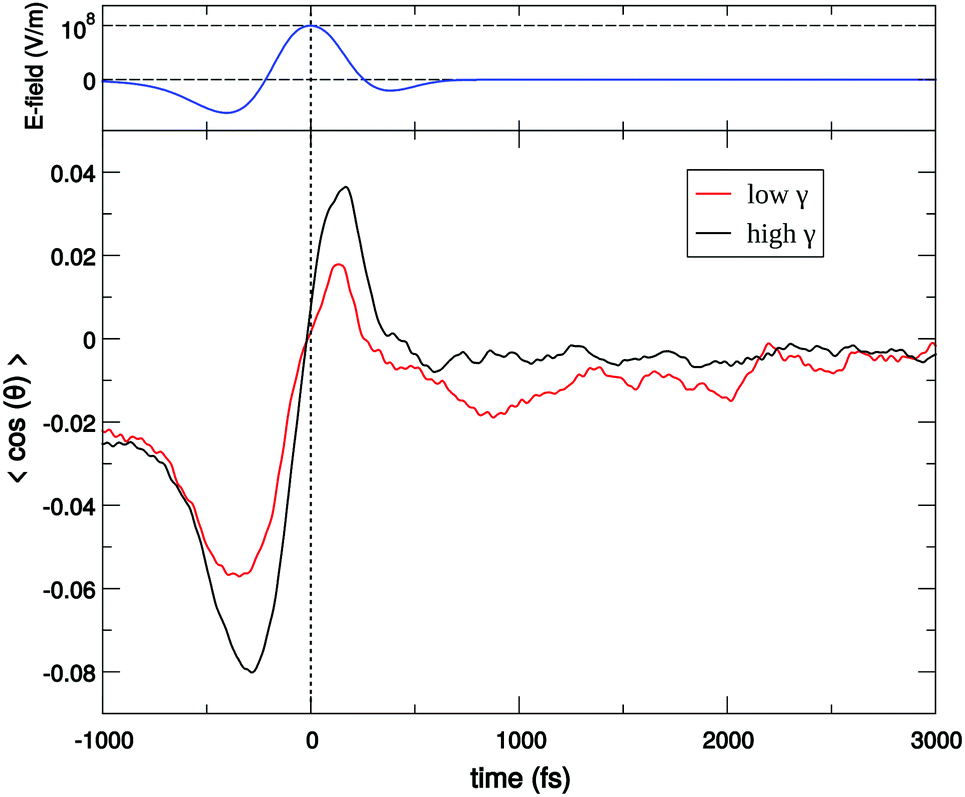 | ||
| Fig. 15 Dielectric alignment of water molecules with high (black) and low (red) asymmetry parameters under a single THz pulse. High-γ is defined as γ > 0.8, whereas low-γ corresponds to γ < 0.2. The average angle between the molecular bisector and the field axis is denoted as cosθ. The vertical dotted line marks the reference point in time at which γ was calculated and corresponds to the peak field in the THz pulse. The THz field profile is shown in the top panel. | ||
7 Conclusions
It is far from surprising that in the long-standing and ongoing debates regarding water structure and dynamics, questions about the structure and dynamics of the HB network are at the center of the stage, for example, in the invocation of various two-state models of liquid water to explain thermodynamic or spectroscopic observables (see for instance ref. 28 and 79–81), in the hypothesis of a small population of mobile fast re-orienting water molecules to explain dielectric relaxation,67,82,83 and in various hypotheses of local structural defects and their propagation.84,85 In all these cases, the core assumptions are fundamentally about the structure and dynamics of the HB network on different time scales, its ability to spatially and temporally sustain local defects, the lifetimes of these defects, and their spatial propagation through the network. This is to say that, as a means towards fruitful progress, a possible falsification of any of these hypotheses must be ultimately based on a better understanding of the dynamics of the HB network. In this regard, it is unfortunate that in many cases the indiscriminate use of descriptive words like “structure” and “heterogeneity” can lead to much confusion if not accompanied by clear operational definitions and a context under which these definitions are valid. The literature on water structure and dynamics is full of descriptions such as “enhanced structure”, “structure formation/breaking”, and “dynamic polymer”, just to name a few. Such explanations can be useful and insightful, but they also have the potential to quickly become mere issues of semantics and nothing more. We agree with previous criticisms that the indiscriminate use of descriptive words in the water literature has only led to much confusion.86In this article, we have discussed an aspect of the HB network that has been recently unraveled using a combination of AIMD together with ALMO-EDA.9 We have shown that in equilibrium liquid water, at any instance of time, a large population of water molecules have a high disparity between the strengths of the two HBs they are donating or the two HBs they are accepting, an aspect which we refer to as “local asymmetry in the HB network”. Here, the strength of the HB is quantified by the amount of charge-transfer from the HB-acceptor to the HB-donor and the associated energy lowering (ΔECT), and both quantities are obtained from ALMO-EDA. We have also shown that the extent of asymmetry can be quantified using the dimensionless asymmetry parameters γA (electron acceptor interactions) and γD (electron donor interactions), where γ runs from zero (fully symmetric HB environment with two equally strong HB interactions) to one (one HB is totally broken). Thus, we provide operationally defined metrics that can be consistently employed on simulated water trajectories to quantify the heterogeneity in the HB network and the dynamics of this heterogeneity.
The idea that there is a broad distribution of HB strengths in liquid water is neither novel nor surprising, and indeed our quantitative metrics of HB strength confirms this picture, but furthermore, the local asymmetry presents a stronger statement. It is neither necessary nor self-evident that a broad distribution of HB strengths implies a significant population of water molecules with a strong asymmetry in both asymmetry parameters simultaneously (75% of molecules with γA and/or γD greater than 0.5). This is particularly clear when comparing the picture in liquid water to that in hexagonal ice. But again, it is important to emphasize here that the picture we find is that of a continuous distribution of HB strengths rather than any kind of two-state picture. When we discuss the behavior of high- versus low-γ water molecules, it is meant to emphasize how the extremes of the distribution are behaving, an aspect which is particularly important given the significant abundance of molecules with high γ, but this is not to imply that water is a mixture of two kinds of molecules or HBs. The comparison with ice is once again illuminating in that it further corroborates that the high asymmetry in water is a consequence of an interplay of thermal disorder, the high connectivity and cooperativity of the HB network, and the diffusive aspect of HB dynamics.
Regarding the traditional tetrahedral structure of liquid water, it is trivial to realize that in a liquid system, what might be disordered on some short time scale becomes ordered when viewed over longer time scales, possibly just as it is no more – or less – profound to realize that a liquid below some relaxation time can be viewed as a solid glass and can similarly support transverse and longitudinal phonon modes.87–89 Keeping in mind the dynamics of the asymmetry and how it decays, the strength of donor–acceptor interactions we find suggests that each molecule in liquid water under ambient conditions forms, on average, two donor and two acceptor bonds. It is because of the very strong dependence of the HB energy on the local geometry (in particular the exponential dependence on the HB length) that even small thermal distortions in the tetrahedral HB network induce a significant asymmetry in the strength of the contacts causing one of the two donor (acceptor) interactions to become, at any instance of time, substantially stronger than the other. Thus, the instantaneous structure of water is strongly asymmetric only according to the electronic criteria, not the geometric one. Overall, the picture provided by ALMO-EDA does not warrant any departure from the traditional tetrahedral structure. With respect to the dynamics of the asymmetry, we have shown that it decays on a time scale of several hundred femtoseconds. Intermolecular vibrations (O–O stretch) and librations of OH groups of HBs are primarily responsible for the relaxation of the instantaneous asymmetry. The time scales, which we find, closely match those obtained from studying the time-dependence of the OH spectral diffusion. The long-time non-exponential tail of the relaxation seems to be related to the non-exponential behavior of HB kinetics, which can be traced back to the translational diffusional aspect of the kinetics.29
So what are the consequences of this asymmetry on the spectroscopic observables of liquid water? The challenge in figuring out the answer is that the causal relation between the HB energy (and its asymmetry), on the one hand, and the structure and dynamics of water (e.g. order parameters, power spectra, HB lengths and angles and their distributions), on the other hand, is very far from trivial. We know for instance that the removal of some of the HB partners in liquid water has the potential to slow down water rotations, as it breaks cooperativity, but the removal of all HBs, possibly by dispersion in non-polar solvents, can greatly speed up the rotation of water molecules.86,90–92 So what happens when a water molecule is simultaneously donating a strong and a weak HB? This is somewhat like a water molecule that is tumbling on one strong and one weak leg. It turns out that in XA spectroscopy, this results in a population of water molecules that give an amplified response in the pre-edge peaks. In the case of the vibrational O–H stretch peak, it turns out that the ensuing decoupling between the symmetric and antisymmetric normal modes can largely explain the observed inhomogeneous broadening, whereas in pulsed THz spectroscopy, it turns out that the molecules with high asymmetry are orientationally more “labile” on a time scale close to half a picosecond. Thus, we see that the manifestations are present on different time scales spanning several orders of magnitude. Hence, trying to answer the question posed in the beginning of this paragraph, this can only be considered as work in progress. There are many more properties of water where asymmetry can play an important role which remain to be investigated. Examples of the latter are attempts to explain the nature of energy dissipation processes,76 and more generally, of fast relaxation processes in water, aspects that are still poorly understood and intensely debated.67,82,83 Recent findings have also pointed towards an important role of intermolecular modes in vibrational energy relaxation, a role particularly played by strong HBs.38 It would also be very interesting to see how asymmetry might dictate certain energy dissipation pathways in this case.
We owe much of what we know about liquid water to interpretations of experimental findings that were founded on force field MD simulations.93–100 It is an intriguing question whether any of the existing interpretations would be significantly modified if a force field that captures the asymmetry aspect was employed. Recently, Naserifar and Goddard101 have published a work, where they describe the results of MD simulations of water using a new force field parametrized using a combination of DFT and CCSD(T) benchmark calculations. Interestingly, they find that each water molecule on average has two strong and two weak HBs (based on a distance criterion), and that the relaxation time between a strong and a week hydrogen bond is ∼100 fs. Despite our agreement with the criticism that has been raised against this work,102 these findings are intriguing and motivate further careful investigation and comparison with previous experimental and theoretical work.
Conflicts of interest
There are no conflicts to declare.Acknowledgements
H. E. would like to acknowledge funding from the Deutsche Forschungsgemeinschaft – DFG, for his temporary position as a principal investigator (Eigene Stelle). T. D. K. acknowledges funding from the European Research Council (ERC) under the European Union's Horizon 2020 research and innovation program (grant agreement no. 716142). The generous allocation of supercomputer time by the Paderborn Center for Parallel Computing (PC2) is kindly acknowledged.Notes and references
- Water a Comprehensive Treatise: The Physics and Physical Chemistry of Water, ed. F. Franks, Springer Science & Business Media, 1972, vol. 1 Search PubMed.
- D. S. Eisenberg and W. Kauzmann, The Structure and Properties of Water, Clarendon Press, Oxford, 2005 Search PubMed.
- M. Gerstein and M. Levitt, Sci. Am., 1998, 279, 100–105 CrossRef CAS PubMed.
- P. Ball, Chem. Rev., 2008, 108, 74–108 CrossRef CAS PubMed.
- P. Lunkenheimer, S. Emmert, R. Gulich, M. Köhler, M. Wolf, M. Schwab and A. Loidl, Phys. Rev. E, 2017, 96, 062607 CrossRef CAS PubMed.
- T. Tokushima, Y. Harada, O. Takahashi, Y. Senba, H. Ohashi, L. G. Pettersson, A. Nilsson and S. Shin, Chem. Phys. Lett., 2008, 460, 387–400 CrossRef CAS.
- J. L. Finney, Philos. Trans. R. Soc., B, 2004, 359, 1145–1165 CrossRef CAS PubMed.
- U. Kaatze, J. Mol. Liq., 2018, 259, 304–318 CrossRef CAS.
- R. Z. Khaliullin and T. D. Kühne, Phys. Chem. Chem. Phys., 2013, 15, 15746–15766 RSC.
- H. J. Bakker and J. L. Skinner, Chem. Rev., 2010, 110, 1498–1517 CrossRef CAS PubMed.
- A. K. Soper, Water: Fundamentals as the Basis for Understanding the Environment and Promoting Technology, IOS Press, 2014, vol. 187, pp. 151–171 Search PubMed.
- F. Perakis, L. D. Marco, A. Shalit, F. Tang, Z. R. Kann, T. D. Kühne, R. Torre, M. Bonn and Y. Nagata, Chem. Rev., 2016, 116, 7590–7607 CrossRef CAS PubMed.
- T. D. Kühne and R. Z. Khaliullin, Nat. Commun., 2013, 4, 1450 CrossRef PubMed.
- T. D. Kühne and R. Z. Khaliullin, J. Am. Chem. Soc., 2014, 136, 3395–3399 CrossRef PubMed.
- C. Zhang, R. Z. Khaliullin, D. Bovi, L. Guidoni and T. D. Kühne, J. Phys. Chem. Lett., 2013, 4, 3245–3250 CrossRef CAS.
- C. Zhang, L. Guidoni and T. D. Kühne, J. Mol. Liq., 2015, 205, 42–45 CrossRef CAS.
- H. Elgabarty, R. Z. Khaliullin and T. D. Kühne, Nat. Commun., 2015, 6, 8318 CrossRef CAS PubMed.
- D. Ojha, K. Karhan and T. D. Kühne, Sci. Rep., 2018, 8, 16888 CrossRef PubMed.
- H. Elgabarty, N. K. Kaliannan and T. D. Kühne, Sci. Rep., 2019, 9, 10002 CrossRef PubMed.
- T. D. Kühne, M. Krack, F. R. Mohamed and M. Parrinello, Phys. Rev. Lett., 2007, 98, 0664501 CrossRef PubMed.
- T. D. Kühne, Wiley Interdiscip. Rev.: Comput. Mol. Sci., 2014, 4, 391–406 Search PubMed.
- R. Z. Khaliullin, E. A. Cobar, R. C. Lochan, A. T. Bell and M. Head-Gordon, J. Phys. Chem. A, 2007, 111, 8753–8765 CrossRef CAS PubMed.
- R. Z. Khaliullin, A. T. Bell and M. Head-Gordon, J. Chem. Phys., 2008, 128, 184112 CrossRef PubMed.
- R. Z. Khaliullin, A. T. Bell and M. Head-Gordon, Chem. – Eur. J., 2009, 15, 851–855 CrossRef CAS PubMed.
- S. Scheiner, Hydrogen Bonding. A Theoretical Perspective, Oxford University Press, 1997 Search PubMed.
- S. J. Grabowski, Chem. Rev., 2011, 111, 2597–2625 CrossRef CAS PubMed.
- T. D. Kühne, M. Krack and M. Parrinello, J. Chem. Theory Comput., 2009, 5, 235–241 CrossRef PubMed.
- P. Wernet, D. Nordlund, U. Bergmann, M. Cavalleri, M. Odelius, H. Ogasawara, L. Å. Näslund, T. K. Hirsch, L. Ojamäe, P. Glatzel, L. G. M. Pettersson and A. Nilsson, Science, 2004, 304, 995–999 CrossRef CAS PubMed.
- A. Luzar and D. Chandler, Nature, 1996, 379, 55–57 CrossRef CAS.
- I.-F. W. Kuo, Science, 2004, 303, 658–660 CrossRef CAS PubMed.
- M. Odelius, M. Cavalleri, A. Nilsson and L. G. Pettersson, Phys. Rev. B: Condens. Matter Mater. Phys., 2006, 73, 024205 CrossRef.
- N. Agmon, Acc. Chem. Res., 2011, 45, 63–73 CrossRef PubMed.
- A. D. Becke and K. E. Edgecombe, J. Chem. Phys., 1990, 92, 5397–5403 CrossRef CAS.
- F. N. Keutsch and R. J. Saykally, Proc. Natl. Acad. Sci. U. S. A., 2001, 98, 10533–10540 CrossRef CAS PubMed.
- R. C. Remsing, T. T. Duignan, M. D. Baer, G. K. Schenter, C. J. Mundy and J. D. Weeks, J. Phys. Chem. B, 2018, 122, 3519–3527 CrossRef CAS PubMed.
- C. J. Fecko, Science, 2003, 301, 1698–1702 CrossRef CAS PubMed.
- A. Luzar, J. Chem. Phys., 2000, 113, 10663–10675 CrossRef CAS.
- K. Ramasesha, L. D. Marco, A. Mandal and A. Tokmakoff, Nat. Chem., 2013, 5, 935–940 CrossRef CAS PubMed.
- C. J. Fecko, J. J. Loparo, S. T. Roberts and A. Tokmakoff, J. Chem. Phys., 2005, 122, 054506 CrossRef PubMed.
- R. Rey, K. B. Møller and J. T. Hynes, J. Phys. Chem. A, 2002, 106, 11993–11996 CrossRef CAS.
- M. Iannuzzi and J. Hutter, Phys. Chem. Chem. Phys., 2007, 9, 1599 RSC.
- M. Iannuzzi, J. Chem. Phys., 2008, 128, 204506 CrossRef PubMed.
- P. Müller, K. Karhan, U. Gerstmann, W. G. Schmidt, M. Bauer and T. D. Kühne, J. Comput. Chem., 2019, 40, 712–716 CrossRef PubMed.
- W. Chen, X. Wu and R. Car, Phys. Rev. Lett., 2010, 105, 017802 CrossRef PubMed.
- L. Kong, X. Wu and R. Car, Phys. Rev. B: Condens. Matter Mater. Phys., 2012, 86, 134203 CrossRef.
- P. Hamm and M. Zanni, Concepts and methods of 2D infrared spectroscopy, Cambridge University Press, 2011 Search PubMed.
- C. P. Lawrence and J. L. Skinner, J. Chem. Phys., 2002, 117, 8847 CrossRef CAS.
- C. Lawrence and J. Skinner, Chem. Phys. Lett., 2003, 369, 472–477 CrossRef CAS.
- D. Ojha, N. K. Kaliannan and T. D. Kühne, Chem. Commun., 2019, 2, 116 CrossRef.
- D. Ojha and A. Chandra, J. Phys. Chem. B, 2015, 119, 11215–11228 CrossRef CAS PubMed.
- D. Ojha, A. Henao and T. D. Kühne, J. Chem. Phys., 2018, 148, 102328 CrossRef PubMed.
- J. Kim, J. Y. Lee, S. Lee, B. J. Mhin and K. S. Kim, J. Chem. Phys., 1995, 102, 310–317 CrossRef CAS.
- R. Kalescky, W. Zou, E. Kraka and D. Cremer, Chem. Phys. Lett., 2012, 554, 243–247 CrossRef CAS.
- M. Martinez, M.-P. Gaigeot, D. Borgis and R. Vuilleumier, J. Chem. Phys., 2006, 125, 144106 CrossRef CAS PubMed.
- A. Perry, H. Ahlborn, B. Space and P. B. Moore, J. Chem. Phys., 2003, 118, 8411–8419 CrossRef CAS.
- J. C. Rasaiah, S. Garde and G. Hummer, Annu. Rev. Phys. Chem., 2008, 59, 713–740 CrossRef CAS PubMed.
- M. F. Toney, J. N. Howard, J. Richer, G. L. Borges, J. G. Gordon, O. R. Melroy, D. G. Wiesler, D. Yee and L. B. Sorensen, Nature, 1994, 368, 444–446 CrossRef CAS.
- M. Gavish, J. L. Wang, M. Eisenstein, M. Lahav and L. Leiserowitz, Science, 1992, 256, 815–818 CrossRef CAS PubMed.
- M. Evans, Phys. B+C, 1985, 131, 273–282 CrossRef CAS.
- L. B. Skinner, C. J. Benmore, B. Shyam, J. K. R. Weber and J. B. Parise, Proc. Natl. Acad. Sci. U. S. A., 2012, 109, 16463–16468 CrossRef CAS PubMed.
- M.-C. Ho, Z. A. Levine and P. T. Vernier, J. Membr. Biol., 2013, 246, 793–801 CrossRef CAS PubMed.
- M. Shafiei, M. von Domaros, D. Bratko and A. Luzar, J. Chem. Phys., 2019, 150, 074505 CrossRef PubMed.
- M. Shafiei, N. Ojaghlou, S. G. Zamfir, D. Bratko and A. Luzar, Mol. Phys., 2019, 117, 3282–3296 CrossRef CAS.
- A. Baer, Z. Miličević, D. M. Smith and A.-S. Smith, J. Mol. Liq., 2019, 282, 303–315 CrossRef CAS.
- M. W. Evans, J. Chem. Phys., 1982, 76, 5480–5483 CrossRef CAS.
- W. T. Coffey, J. Mol. Liq., 2004, 114, 5–25 CrossRef CAS.
- A. Y. Zasetsky, Phys. Rev. Lett., 2011, 107, 117601 CrossRef PubMed.
- G. J. Evans and M. W. Evans, J. Mol. Liq., 1983, 26, 63–76 CrossRef CAS.
- A. Vegiri, J. Mol. Liq., 2004, 112, 107–116 CrossRef CAS.
- Z. Futera and N. J. English, J. Chem. Phys., 2017, 147, 031102 CrossRef PubMed.
- K. Shiraga, T. Suzuki, N. Kondo and Y. Ogawa, J. Chem. Phys., 2014, 141, 235103 CrossRef CAS PubMed.
- M. Sajadi, M. Wolf and T. Kampfrath, Nat. Commun., 2017, 8, 14963 CrossRef CAS PubMed.
- T. Kampfrath, M. Wolf and M. Sajadi, Chem. Phys. Lett., 2018, 692, 319–323 CrossRef CAS.
- J. B. Baxter and G. W. Guglietta, Anal. Chem., 2011, 83, 4342–4368 CrossRef CAS PubMed.
- P. Zalden, L. Song, X. Wu, H. Huang, F. Ahr, O. D. Mücke, J. Reichert, M. Thorwart, P. K. Mishra, R. Welsch, R. Santra, F. X. Kärtner and C. Bressler, Nat. Commun., 2018, 9, 2142 CrossRef PubMed.
- H. Elgabarty, T. Kampfrath, D. J. Bonthuis, V. Balos, N. K. Kaliannan, P. Loche, R. R. Netz, M. Wolf, T. D. Kühne and M. Sajadi, Sci. Adv., 2019 Search PubMed , accepted.
- B. Bagchi, Molecular Relaxation in Liquids, Oxford University Press, 2012 Search PubMed.
- T. Kampfrath, R. K. Campen, M. Wolf and M. Sajadi, J. Phys. Chem. Lett., 2018, 9, 1279–1283 CrossRef CAS PubMed.
- W. C. Röntgen, Ann. Phys. Chem., 1892, 281, 91–97 CrossRef.
- J. Russo, K. Akahane and H. Tanaka, Proc. Natl. Acad. Sci. U. S. A., 2018, 115, E3333–E3341 CrossRef CAS PubMed.
- P. Gallo, K. Amann-Winkel, C. A. Angell, M. A. Anisimov, F. Caupin, C. Chakravarty, E. Lascaris, T. Loerting, A. Z. Panagiotopoulos, J. Russo, J. A. Sellberg, H. E. Stanley, H. Tanaka, C. Vega, L. Xu and L. G. M. Pettersson, Chem. Rev., 2016, 116, 7463–7500 CrossRef CAS PubMed.
- R. Buchner, J. Barthel and J. Stauber, Chem. Phys. Lett., 1999, 306, 57–63 CrossRef CAS.
- K. J. Tielrooij, N. Garcia-Araez, M. Bonn and H. J. Bakker, Science, 2010, 328, 1006–1009 CrossRef CAS PubMed.
- I. Popov, P. B. Ishai, A. Khamzin and Y. Feldman, Phys. Chem. Chem. Phys., 2016, 18, 13941–13953 RSC.
- D. C. Elton, Phys. Chem. Chem. Phys., 2017, 19, 18739–18749 RSC.
- J. Qvist and B. Halle, J. Am. Chem. Soc., 2008, 130, 10345–10353 CrossRef CAS PubMed.
- Y. I. Frenkel, Kinetic theory of liquids, Dover, 1955 Search PubMed.
- K. Trachenko and V. V. Brazhkin, Rep. Prog. Phys., 2016, 79, 016502 CrossRef CAS PubMed.
- D. C. Elton and M. Fernández-Serra, Nat. Commun., 2016, 7, 10193 CrossRef CAS PubMed.
- B. Halle, Philos. Trans. R. Soc., B, 2004, 359, 1207–1224 CrossRef CAS PubMed.
- T. D. Kühne, T. A. Pascal, E. Kaxiras and Y. Jung, J. Phys. Chem. Lett., 2011, 2, 105–113 CrossRef PubMed.
- J. Kessler, H. Elgabarty, T. Spura, K. Karhan, P. Partovi-Azar, A. A. Hassanali and T. D. Kühne, J. Phys. Chem. B, 2015, 119, 10079–10086 CrossRef CAS PubMed.
- B. Auer, R. Kumar, J. R. Schmidt and J. L. Skinner, Proc. Natl. Acad. Sci. U. S. A., 2007, 104, 14215–14220 CrossRef CAS PubMed.
- B. M. Auer and J. L. Skinner, J. Chem. Phys., 2008, 128, 224511 CrossRef CAS PubMed.
- H. Torii, J. Phys. Chem. A, 2006, 110, 9469–9477 CrossRef CAS PubMed.
- R. Rey, F. Ingrosso, T. Elsaesser and J. T. Hynes, J. Phys. Chem. A, 2009, 113, 8949–8962 CrossRef CAS PubMed.
- R. Rey and J. T. Hynes, J. Phys. Chem. B, 2015, 119, 7558–7570 CrossRef CAS PubMed.
- T. Yagasaki and S. Saito, Annu. Rev. Phys. Chem., 2013, 64, 55–75 CrossRef CAS PubMed.
- G. R. Medders and F. Paesani, J. Chem. Phys., 2015, 142, 212411 CrossRef PubMed.
- P. Hamm and A. Shalit, J. Chem. Phys., 2017, 146, 130901 CrossRef PubMed.
- S. Naserifar and W. A. Goddard, Proc. Natl. Acad. Sci. U. S. A., 2019, 116, 1998–2003 CrossRef CAS PubMed.
- T. Head-Gordon and F. Paesani, Proc. Natl. Acad. Sci. U. S. A., 2019, 116, 13169–13170 CrossRef CAS PubMed.
| This journal is © the Owner Societies 2020 |