The edge of reason: reporting and inference near the detection limit
Analytical Methods Committee AMCTB No. 92
First published on 18th December 2019
Abstract
Although the general concept of a detection limit as a lower practical operating limit for an analytical method is widely understood, the precise interpretation of results near the IUPAC limit of detection is rarely as well understood or implemented. It is important to distinguish between statements about the analytical result, which is known, and inferences about the true value, which are not known. It is also crucial to understand that there are at least two quite different limits involved and that the limit most commonly referred to as the ‘limit of detection’ is, surprisingly, not intended as the criterion for detection of an analyte. This Technical Brief describes the principal internationally recognised approach to decision and detection limits.
Introduction
Many analytes are prohibited or regulated at very low levels. For prohibited materials, the analyst’s problem is to establish whether the analyte is present or not. For materials regulated at low levels, we must establish whether our analytical method is capable of detecting the analyte at all at the regulated level.In conformity with modern thought, these questions would best be answered by looking at the uncertainty associated with a result at low levels.1 Historically, however, the issue has been addressed by constructing limits for decisions and detectability. These have been defined differently over time, and are consequently often misused or misinterpreted. This Technical Brief describes the approach used by IUPAC2,3 and ISO4 for the construction and interpretation of decision and detection limits.
The IUPAC formulation
The present IUPAC formulation of limits related to detection of an analyte is based on theory presented in a seminal paper by Currie2 and described in an official IUPAC recommendation.3 The reasoning is based on statistical hypothesis testing and asks two fundamentally different questions:(i) At what value is an observed analytical result significantly different from the result for a true ‘blank’ test material (that is, a material free from the analyte sought)?
(ii) At what true analyte concentration will the analytical result reliably exceed the level defined in (i)?
Question (i) defines the criterion for detection; any result above this value is to be declared ‘positive’. For that reason, together with its basis in hypothesis testing, IUPAC’s recommendation3 refers to this first level as a ‘critical value’, designated LC. Question (ii) is essentially asking the question ‘what is the lowest level that will reliably be detected in practice?’ Importantly, it is the second question that corresponds to the IUPAC definition of ‘limit of detection’ (LOD). IUPAC designate this second value as LD.
Notice also why these questions are described as “fundamentally” different. The first asks about an observable signal – the analytical result leading to a declaration of presence. The second is asking about a true value – something we cannot see directly and can only make inferences about.
Calculating limits
Calculating the detection limit, LD, is a two-step process, starting with the critical value LC. LC is constructed fromLC = ![[x with combining macron]](https://www.rsc.org/images/entities/i_char_0078_0304.gif) 0 + s0t0.95,ν0 0 + s0t0.95,ν0 | (1) |
![[x with combining macron]](https://www.rsc.org/images/entities/i_char_0078_0304.gif) 0 and s0 are the estimated mean and standard deviation of results for a ‘blank’ material, and t0.95,ν0 is the one-tailed 95% quantile for Student’s t with ν0 degrees of freedom, which depends on the amount of data used to estimate s0. Often, particularly for an estimate in method validation, t0.95,ν0 is replaced by its large-sample value of 1.645.
0 and s0 are the estimated mean and standard deviation of results for a ‘blank’ material, and t0.95,ν0 is the one-tailed 95% quantile for Student’s t with ν0 degrees of freedom, which depends on the amount of data used to estimate s0. Often, particularly for an estimate in method validation, t0.95,ν0 is replaced by its large-sample value of 1.645. ![[x with combining macron]](https://www.rsc.org/images/entities/i_char_0078_0304.gif) 0 and s0 can come from the simple replicated observation of a blank material; in some documentary standards, they are obtained as the intercept and residual standard deviation of a regression through calibration data. They can also be in either the ‘signal domain’ (for example, peak area, absorbance etc.) or in the ‘concentration domain’ after conversion to concentration. LC itself of course appears in the same units as
0 and s0 can come from the simple replicated observation of a blank material; in some documentary standards, they are obtained as the intercept and residual standard deviation of a regression through calibration data. They can also be in either the ‘signal domain’ (for example, peak area, absorbance etc.) or in the ‘concentration domain’ after conversion to concentration. LC itself of course appears in the same units as ![[x with combining macron]](https://www.rsc.org/images/entities/i_char_0078_0304.gif) 0 and s0 and can accordingly be expressed in either ‘domain’.
0 and s0 and can accordingly be expressed in either ‘domain’.
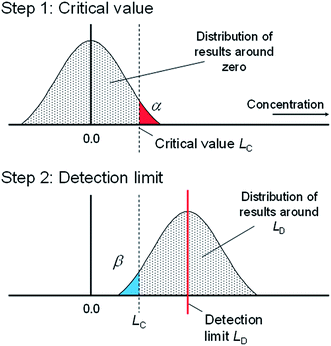
The rationale for this calculation is in statistical hypothesis testing. For the statistically minded, LC is the critical value for a test of the null hypothesis H0: μ = 0 with alternative hypothesis H1: μ > 0. If we assume approximate normality, this implies a one-tailed Student t-test, conventionally at the α = 0.05 significance level (95% confidence). Fig. 1, step 1 illustrates the rationale, assuming results in the units of calculated concentration.
 | ||
| Fig. 1 The basis of decision and detection limits (adapted from ref. 3). | ||
Given LC, which answers question (i) above, we can move to the second question: How much analyte needs to be present to give results that are reliably above LC? Fig. 1, step 2 illustrates the basis for this new estimate, with the area to the right of LC showing the proportion of results that fall above LC given a true analyte concentration equal to LD. Usually, ‘reliably’ is taken to mean ‘95% of the time’, so we adjust LD to make the shaded portion equal to 95% of the distribution. This just needs another one-sided critical value, so we have
 | (2) |
Notice that we have distinguished, here, between the standard deviation for the blank material and the standard deviation for a material with a true level of analyte LD. The standard deviation at LD is hard to determine, as LD is not known. Most texts therefore simplify by assuming that the standard deviation is approximately constant near zero, leading to
LD = LC + s0t0.95,ν0 = ![[x with combining macron]](https://www.rsc.org/images/entities/i_char_0078_0304.gif) 0 + 2s0t0.95,ν0 0 + 2s0t0.95,ν0 | (3) |
As before, the Student’s t value is often replaced by the large-sample value, leading to the well-known approximation LD ≈ ![[x with combining macron]](https://www.rsc.org/images/entities/i_char_0078_0304.gif) 0 + 3.3s0.
0 + 3.3s0.
It is worth noting, here, that several approximations have been made. Normality has been assumed, and we have assumed that the standard deviation is constant at least from zero up to LD. Perhaps even more importantly, we have also used an observed standard deviation without specifying the conditions of measurement. In practice, most texts use a repeatability standard deviation, though at least one regulation6 uses a rough estimate of the within-laboratory reproducibility (intermediate precision) standard deviation. If day to day (or some other) variation dominates, the calculated value for LD could be a severe underestimate.
Interpretation of results near zero
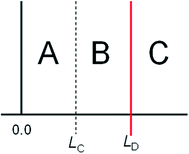
Once we have a critical value LC and a detection limit LD, we can use these to guide inference about the presence and absence of the analyte. Interpretation of new results follows Fig. 2, which divides the concentration range into three regions, A–C.Table 1 overleaf summarises what can be said about the true concentration when the analytical result x falls in each of these ranges.
| Result in region | Description | Detection | Inference about the true valuea | Quantitative inference (all regions) |
|---|---|---|---|---|
| a Assuming α and β are set at 5% for 95% confidence. | ||||
| A | x ≤ LC | Not detected | Less than LD with at least 95% confidence | The best estimate of the true value is x. The standard uncertainty associated with this value is at least s0 [see text] |
| B | L C < x ≤ LD | Detected | Greater than zero with at least 95% confidence | |
| C | x > LD | Detected | Greater than LC with at least 95% confidence | |
A result in region C can, of course, also be interpreted as evidence that the analyte is present with at least 95% confidence.
Notice that results in region B – between the critical value and the detection limit – are positive for the presence of analyte. It is the critical value that is the decision criterion for presence of analyte – not the LOD.
The quantitative inferences that can be made should also be noted. All observed results are valid estimates; it is, however, important to allow for the associated uncertainty in interpretation. Near zero, the relative uncertainty is usually large. For a single observation, the standard uncertainty cannot be less than the standard deviation used for calculating the detection limit; it is usually much larger because an estimate of uncertainty includes all of the factors that might affect the result.
Finally, results below LD, or even the critical value LC, are not meaningless; they just have a larger relative uncertainty than results above these limits. While it is clearly not harmful to report results as ‘less than’ LD where this meets client requirements, it is important that laboratories remain able and willing to provide the raw results if requested.
Limit of quantitation (‘LOQ’) and other reporting limits
The concept of a ‘limit of quantitation’ is based on the idea that, as analyte levels reduce, the relative uncertainty – however that is described – increases to the point that the results no longer meet some requirement for acceptable uncertainty. While it can be useful to estimate a quantitation limit during method validation as an aid to selecting an analytical method when the LOQ is clearly defined (and definitions vary considerably), it is not appropriate to use the LOQ as a limit for reporting. A similar argument applies to the ‘reporting limit’, conceived as a level below which a result is not meaningful and should not be reported to the client. Like overuse of the LOQ or LOD, this leads to unnecessary and often unhelpful ‘censoring’ of data. Like results below the LOD, results below any LOQ or ‘reporting limit’ are not meaningless. If a client needs the raw results for trend analysis, averaging, or any other legitimate purpose, the laboratory should not hesitate to provide them. Again, it is more useful to provide the result with an indication of its uncertainty.Room for confusion
While the general theory given here is now widely accepted, terminology remains confused and inconsistent. Historically, many writers referred to the critical value as the ‘detection limit’. ISO were obliged to define entirely new terms for critical value and LOD to avoid the confusion – but in doing so added yet more new terminology, necessitating a translation table in the standard.4 EU regulations for pesticides use CCα and CCβ for the IUPAC critical value and LOD respectively. And a later IUPAC publication may have confused matters even further by recommending that the IUPAC critical value be referred to as the detection limit.5 Further, while the idea of critical values and detection limits was intended to guide inference about the true analyte concentration, they are often used incorrectly as statements about the observed result. All of this results in considerable confusion.The AMC recommends that if statements such as ‘less than LOD’ are made in relation to results, the basis for the calculation and interpretation should be made clear to the client, either explicitly in the report or by reference to a documented standard or procedure.
The AMC also recommends that raw data be made available to the client irrespective of whether it is above or below detection or reporting limits wherever it is important for the client’s needs – for example, for trend analysis, averaging or other summaries, or (for example) in proficiency testing. Where possible, information on the uncertainty of results should be given with any numerical values to prevent over-interpretation.
References
- M. Thompson and S. L. R. Ellison, Towards an uncertainty paradigm of detection capability, Anal. Methods, 2013, 5, 5857–5861 RSC.
- L. A. Currie, Limits for Qualitative Detection and Quantitative Determination: Application to Radiochemistry, Anal. Chem., 1968, 40, 586–593 CrossRef CAS.
- L. A. Currie, Nomenclature in Evaluation of Analytical Methods Including Detection and Quantification Capabilities, Pure Appl. Chem., 1995, 67, 1699–1723 CAS.
- ISO 11843-1:1997, Capability of detection – Part 1: Terms and definitions, ISO, Geneva, 1997 Search PubMed.
- J. Mocak, A. M. Bond, S. Mitchell and G. Scollary, Statistical overview of standard (IUPAC and ACS) and new procedures for determining the limits of detection and quantification: application to voltammetric and stripping techniques, Pure Appl. Chem., 1997, 69, 297–328 CAS.
- Commission Decision 2002/657/EC, Official Journal of the EC, L 221/8, 2001, https://publications.europa.eu/en/publication-detail/-/publication/ed928116-a955-4a84-b10a-cf7a82bad858 Search PubMed.
| This journal is © The Royal Society of Chemistry 2020 |


