 Open Access Article
Creative Commons Attribution 3.0 Unported Licence
Mapping the polymorphic transformation gateway vibration in crystalline 1,2,4,5-tetrabromobenzene†
Adam J.
Zaczek
 a,
Luca
Catalano
 b,
Panče
Naumov
 b and
Timothy M.
Korter
 *a
*a
aDepartment of Chemistry, Syracuse University, 1-014 Center for Science and Technology, Syracuse, New York 13244-4100, USA. E-mail: tmkorter@syr.edu
bNew York University Abu Dhabi, P.O. Box 129188, Abu Dhabi, United Arab Emirates
First published on 23rd November 2018
Abstract
The thermosalient behavior of 1,2,4,5-tetrabromobenzene (TBB) is related to a temperature-induced polymorphic structural change. The mechanism behind the phase transition has been investigated in this work using low-frequency (10–250 cm−1) Raman spectroscopy and solid-state density functional theory simulations. Careful adjustments of the probing laser power permitted thermal control of the polymorph populations and enabled high-quality Raman vibrational spectra to be obtained for both the β (low temperature) and γ (high temperature) forms of TBB. Numerous well-defined vibrational features appear in the Raman spectra of both polymorphs which could be assigned to specific motions of the solid-state TBB molecules. It was discovered that the lowest-frequency vibration at 15.5 cm−1 in β-TBB at 291 K is a rotational mode that functions as a gateway for inducing the polymorphic phase transition to γ-TBB, and serves as the initiating step in the storage of mechanical strain for subsequent macroscopic release. Computationally mapping the potential energy surface along this vibrational coordinate reveals that the two TBB polymorphs are separated by a 2.40 kJ mol−1 barrier and that γ-TBB exhibits an enhanced cohesion energy that stabilizes its structure.
I. Introduction
The thermosalient effect is a phenomenon where a crystal undergoes a structural transformation due to changes in temperature, and this produces a physical “jumping” of the crystal.1–3 From an atom-level perspective, the physical motion corresponds with sudden yet small changes of the molecular structures and packing arrangements of the components comprising the crystalline solid. This unusual behavior has been attributed to material changes such as molecular dimerization (photosalient effect)4 and polymorph transformations5,6 (thermosalient effect). Given that this is often a reversible process7,8 controlled by varying sample temperature, the effect has attracted interest in the development of new energy transducing and actuating materials, such as those in electronics applications.9One of the more well-studied thermosalient materials is 1,2,4,5-tetrabromobenzene (TBB).10–13 TBB is often used as a starting material in the organic syntheses of liquid crystals14 and photoconductive polymers.15 Below 307 K![[thin space (1/6-em)]](https://www.rsc.org/images/entities/char_2009.gif) 12,16 (previously reported at 319 K in ref. 17 and 18), crystalline TBB naturally exists in its β polymorph, with the γ polymorph forming at higher temperatures. Single crystals of TBB are often twinned,19,20 and the crystals jump or split upon polymorph transformation, propelling themselves several centimeters. The jumping distances are largely dependent on the crystal size and resting face of the crystal, with large crystals having more pronounced jumping.10
12,16 (previously reported at 319 K in ref. 17 and 18), crystalline TBB naturally exists in its β polymorph, with the γ polymorph forming at higher temperatures. Single crystals of TBB are often twinned,19,20 and the crystals jump or split upon polymorph transformation, propelling themselves several centimeters. The jumping distances are largely dependent on the crystal size and resting face of the crystal, with large crystals having more pronounced jumping.10
The structures of both TBB polymorphs have been previously determined through single-crystal X-ray diffraction,21,22 revealing that both exist in the same space group (P21/n) with similar unit cell dimensions, differing primarily through an intermolecular tilting of the TBB rings with respect to one another in the unit cell, as shown in Fig. 1. Because the polymorph structures are quite similar to one another and do not intuitively correspond to the significant structural changes that might be associated with thermosalient behavior, it warrants further analysis of the crystal structures, the intermolecular lattice vibrations, and the underlying mechanism responsible for the conversion between the solid forms.
 | ||
| Fig. 1 Molecular structure of a TBB molecule (left) and the packing differences between the two TBB polymorphs, β-TBB (blue) and γ-TBB (red). | ||
Recent work has investigated the structural strain associated with the polymorph change that contributes to the thermosalient nature of TBB, and suggested that low-frequency vibrational modes near 43 cm−1 and 47 cm−1 are integral to the conversion.12 The importance of low-frequency vibrations for determining the properties of TBB crystals is consistent with the established relationship that exists between low-frequency lattice phonons and displacive/martensitic phase transformations as observed in other crystalline solids.23–25 In the current study, experimental low-frequency Raman spectral data (10–250 cm−1) was collected at various temperatures and combined with solid-state density functional theory (ss-DFT) simulations to provide clear assignments of the vibrational motions in this region. This granted the ability to uniquely identify a single mode as being the gateway vibration for β-TBB to γ-TBB conversion. An in-depth computational study of the vibrational energies, motions, and potential energy surfaces of six rotational modes present in the β-TBB crystals revealed that only the vibration observed at 15.5 cm−1 (at 291 K) is able to initiate the β → γ transformation. The combination of experimental Raman data and ab initio computational analyses enables the mechanism of the polymorph transformation to be understood and quantified in terms of relative energies and barriers to conversion.
II. Methods
a. Experimental details
TBB was purchased from Sigma-Aldrich and used without further purification. Sample composition was confirmed via powder X-ray diffraction, showing β-TBB. Raman spectra were obtained with an Ondax (Monrovia, CA, USA) THz-Raman spectrometer with a laser centered at 784.7 nm and coupled to an Andor (Concord, MA, USA) Shamrock 750 spectrograph with an Andor iDus 416 CCD. The data spanned ±250 cm−1 from the Rayleigh peak, with an effective spectral resolution of 0.6 cm−1. For room-temperature studies, the TBB sample was kept as a loose powder in a 10 mm diameter glass vial. The spectra shown here were averaged over 225 acquisitions, each with a 3 second exposure time. A range of laser power levels was used (2.5, 5.2, 13.1, 17.7, 74, and 115 mW) and controlled by a variable neutral density filter.For cooled studies, the powder samples were compressed into free-standing pellets (13 mm diameter, ∼1 mm thick) using pure TBB and mounted in a liquid-nitrogen-cooled cryostat. With an applied pelleting pressure of 0.07 GPa, the sample disc showed β-TBB to be the major constituent, but with 0.14 GPa applied, γ-TBB was the major component. Additional pellets were made at increased pressures (0.20 and 0.28 GPa) to evaluate the influence on TBB stabilization and were examined only at 290 K. The laser power was kept to a minimum (13.1 mW) for all cooled pellet experiments to avoid unwanted polymorph conversion while maximizing the scattering signal.
b. Computational details
All solid-state density functional theory (ss-DFT) calculations were performed using the CRYSTAL17 (ref. 26) software package. The Perdew–Burke–Ernzerhof (PBE) exchange and correlation functional27 was used with the def2-TZVP28 basis set. Grimme's D3 dispersion correction29,30 with an included Becke–Johnson dampening parameter31 was employed to treat weak long-range London dispersion forces between molecules.Geometry optimizations were begun using previously published crystal structures for β-TBB21 and γ-TBB22 as initial starting points. To account for the effects of non-zero experimental temperatures on the unit cell dimensions in the calculations, atomic positions were allowed to optimize to their energetic minima within fixed lattice dimensions and space group symmetries determined by the reported single-crystal X-ray diffraction measurements. For β-TBB (the low-temperature form), a free optimization that did not constrain lattice dimensions was also run for comparison. An energetic convergence of ΔE < 10−8 hartree was used for all optimizations with root-mean-square thresholds (in atomic units) set to 1.0 × 10⁻⁵ for the gradients and 4.0 × 10⁻⁵ for the estimated displacements. Separate single-point energy calculations were performed on the optimized structures in order to determine the energy stability rankings of the polymorphs, and these were corrected for basis set superposition errors (BSSE) using the counterpoise method.32
Harmonic normal mode frequency analyses were executed on the structurally optimized TBB solids with a stricter energy convergence of ΔE < 10−10 hartree. Raman intensities were calculated by computing the Raman tensor utilizing a coupled-perturbed Hartree–Fock/Kohn–Sham approach.33,34 To accelerate convergence, a mixing of Fock/KS matrix derivatives35 was used. Experimental temperatures and laser excitation wavelength were also accounted for in the simulated intensities. Normal mode analyses formed the basis for constrained unit cell optimizations, using eigenvector-displaced molecular positions to determine the influence of specific lattice vibrations on the polymorphic stabilities.
For all calculations, truncation tolerances for the Coulomb and Hartree–Fock exchange integrals (keyword TOLINTEG) were set to 10−12, 10−12, 10−12, 10−24, 10−48 hartree. A sampling of 205 k-points was used in the irreducible Brillouin zone (keyword SHRINK = 9), and a predefined grid size of 366477 points was utilized (keyword XXLGRID).
III. Results and discussion
a. Raman spectroscopy of powder samples
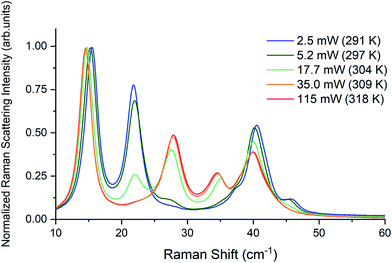
Raman spectra of TBB powder were taken using a 784.7 nm laser with varying power levels, with the spectrum at the lowest power (2.5 mW) showing β-TBB, and the maximum power (115 mW) revealing γ-TBB to be present (Fig. 2). The spectral features of both forms were consistent with prior reports,36,37 aiding in their identification. The samples at the laser power extremes were found to be at least 96% polymorphically pure within the limits of detection. Polymorph changes occurred due to laser heating of the sample, with greater powers imparting more heat and causing γ-TBB formation. At intermediate powers, a mix of both polymorphs was observed, which may be attributed to uneven sample heating leading to localized partial polymorph conversion in the beam path. After approximately 35.0 mW, γ-TBB was observed as the clear majority product. No thermosalient crystal movement was observed in the powder sample during heating (likely due to the very small particle size), indicating that the spectra were representative of the same probed area each time.It is possible to calculate the average temperature (T) of a sample at the laser focus directly from the Raman spectral data by utilizing the relative intensities of the anti-Stokes/Stokes scattering features and the following equation:
 | (1) |
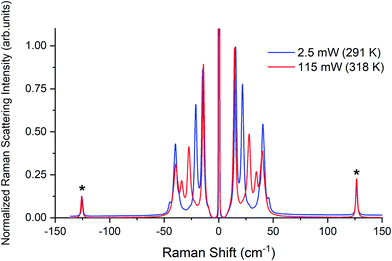 | ||
| Fig. 3 Raman spectra of β-TBB (blue) and γ-TBB (red) obtained from powder samples with peaks used for temperature analysis marked by asterisks (*). | ||
b. Raman spectroscopy of pelleted samples
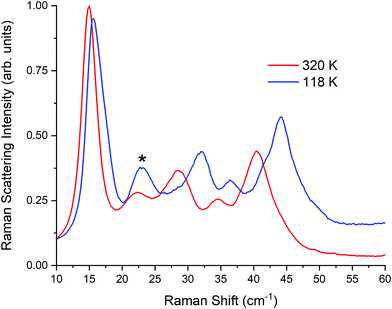 | ||
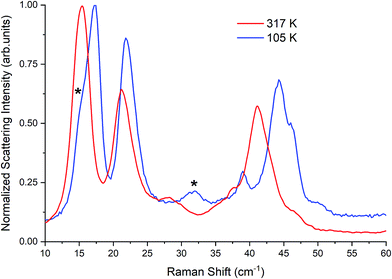
| Fig. 5 Raman spectra of γ-TBB at 320 K and 118 K. Contribution from β-TBB is marked in the 118 K spectrum with an asterisk (*). | ||
Pressure clearly plays a role in TBB polymorph stabilization. To investigate this, additional pellets were made at varying pressures (0.03, 0.10, 0.20, and 0.28 GPa). While very little change was observed in the room-temperature Raman spectra at intermediate pressures, the 0.28 GPa pellet was found to contain an additional 5% γ-TBB (85% in total). Although this did not eliminate the β-TBB form completely, it showed that pressure increases do promote γ-TBB stabilization. It is worth noting that higher pressures (0.7 GPa) can cause formation of α-TBB,38 but the pressures used in the present study were not great enough to observe any trace of this polymorph.
c. Solid-state density functional theory simulations
| a (Å) | b (Å) | c (Å) | β (°) | Volume (Å3) | |
|---|---|---|---|---|---|
| Experimental21 (100 K) | 3.9235 | 10.4885 | 10.3675 | 100.367 | 419.675 |
| Calculated | 3.9241 | 10.5012 | 10.3559 | 100.516 | 419.580 |
| Error (%) | 0.02 | 0.12 | −0.11 | 0.15 | −0.02 |
Given these results, optimization of γ-TBB was done with crystal lattice parameters held at experimentally observed values (332 K (ref. 22)) and the atoms were allowed to relax to an energetic minimum within these constraints. While no problems were encountered in the full optimization of the β-TBB structure, for a fair comparison to the fixed-lattice γ-TBB calculations, a fixed-lattice (100 K (ref. 21)) optimization was also performed on β-TBB. All energy and vibrational analyses presented in this work are based on the fixed-lattice calculations. Regardless of the constraints on the geometry optimizations, the molecular structures produced in the simulations agreed very well with experimental data, as shown by the calculated intramolecular distances and angles, as well as the intermolecular distances, shown in Table 2.
| Intramolecular bond (Å) | β-TBB | γ-TBB | ||
|---|---|---|---|---|
| Experimental | Calculated | Experimental | Calculated | |
| C1–C2 | 1.397 | 1.401 | 1.358 | 1.371 |
| C1–C3′ | 1.401 | 1.396 | 1.420 | 1.406 |
| C2–C3 | 1.387 | 1.395 | 1.372 | 1.399 |
| C1–Br1 | 1.884 | 1.895 | 1.844 | 1.873 |
| C2–Br2 | 1.883 | 1.896 | 1.917 | 1.904 |
![[thin space (1/6-em)]](https://www.rsc.org/images/entities/char_2009.gif) |
||||
| Angle (°) | ||||
| C1–C2–C3 | 121.82 | 121.74 | 121.74 | 121.82 |
| Br2–C2–C3 | 118.15 | 118.34 | 118.34 | 118.15 |
| C1–C2–Br2 | 120.03 | 121.74 | 121.73 | 120.03 |
| Br1–C1–C2 | 119.84 | 119.63 | 119.63 | 119.84 |
![[thin space (1/6-em)]](https://www.rsc.org/images/entities/char_2009.gif) |
||||
| Dihedral angle (°) | ||||
| C3–C1–C2–C3 | 0.07 | 0.10 | 1.67 | 0.03 |
| Br1–C2–C1–C3 | 179.58 | 179.53 | 177.74 | 179.48 |
| Br1–C1–C2–Br2 | 0.36 | 0.55 | 1.07 | 0.87 |
| Br2–C1–C2–C3 | 180.00 | 179.98 | 178.15 | 179.63 |
![[thin space (1/6-em)]](https://www.rsc.org/images/entities/char_2009.gif) |
||||
| Intermolecular bond (Å) | ||||
| Br1⋯C3 | 3.740 | 3.734 | 4.158 | 4.182 |
| Br2⋯C3 | 4.477 | 4.469 | 4.129 | 4.154 |
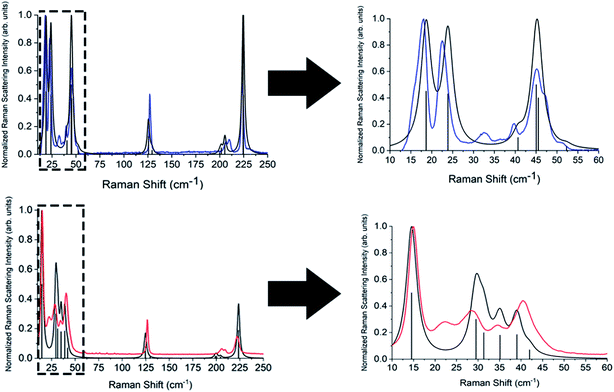
Complete lists of the experimental and calculated Raman-active modes for both TBB polymorphs below 250 cm−1 are shown in Tables 3 and 4. The β-TBB vibrational simulations are in excellent agreement with the current experimental results, with the only peaks not modeled arising from the aforementioned γ-TBB content. A recent study has presented a similar vibrational analysis of β-TBB,12 but it did not experimentally access the significant sub-40 cm−1 range. The peaks calculated for γ-TBB are also in excellent agreement with experimental results, with all features accounted for.
| White, et al.36 | Zakharov, et al.12 | Burgos & Bonadeo37 | Current work | |||
|---|---|---|---|---|---|---|
| Experimental (ambient) | Experimental (ambient) | Experimental (100 K) | Experimental (291 K) | Experimental (105 K) | Calculated (100 K lattice) | Calculated intensities |
| — | — | 17.5 | 15.5 | 17.1 | 18.7 | 0.969 |
| — | — | 21.5 | 21.8 | 22.1 | 23.9 | 0.923 |
| — | — | 38.5 | — | 39.0 | 40.7 | 0.105 |
| — | 42 | 44.5 | 40.6 | 44.4 | 45.0 | 0.637 |
| — | — | 46 | — | 46.2 (sh) | 45.5 | 0.480 |
| — | 45.5 | 50.5 | 46.2 | 50.1 | 52.3 | 0.025 |
| — | — | 52 | — | — | — | — |
| — | 54 | — | — | — | — | — |
| — | 62.0 | — | — | — | — | |
| — | 87 | — | — | — | — | — |
| 125 | 126.4 | — | 126.4 | 126.6 | 125.6 | 0.312 |
| — | — | — | — | 128.5 (sh) | 129.4 | 0.043 |
| — | — | — | — | 204 (sh) | 200.0 | 0.024 |
| 203 | 203.6 | — | 203.6 | 206.7 | 201.6 | 0.062 |
| — | — | — | 209.0 | 209.3 | 205.2 | 0.039 |
| 208 | 209 | — | 205.5 | 0.127 | ||
| 220 | 221 | — | 221.4 | 223.4 | 224.4 | 1.000 |
| — | — | — | — | 224.5 (sh) | 224.7 | 0.427 |
| — | 234 | — | — | — | — | — |
| Burgos & Bonadeo37 | Current work | |||
|---|---|---|---|---|
| Experimental (330 K) | Experimental (320 K) | Experimental (118 K) | Calculated (332 K lattice) | Calculated intensities |
| 14.5 | 14.5 | 14.8 | 14.6 | 1.000 |
| 28.0 | 27.8 | 28.2 | 29.5 | 0.502 |
| 31.3 | 0.266 | |||
| 34.0 | 34.5 | 34.9 | 35.1 | 0.270 |
| 40.0 | 39.9 | 41.7 | 39.0 | 0.301 |
| 42.0 | 0.054 | |||
| — | 126.5 | 126.8 | 124.7 | 0.171 |
| — | — | — | 129.1 | 0.001 |
| — | 205.8 | 205.4 | 198.8 | 0.018 |
| — | 200.4 | 0.001 | ||
| — | 208.9 | 209.7 | 204.4 | 0.023 |
| — | 204.5 | 0.014 | ||
| — | 222.1 | 222.3 | 223.6 | 0.280 |
| — | 223.9 | 0.093 | ||
| Total energy (relative) | Conformational energy (relative) | Cohesive energy | |
|---|---|---|---|
| β-TBB | 0 | 0 | −144.854 |
| γ-TBB | 0.791 | 2.111 | −146.174 |
Temperature-dependent Gibbs free energy curves (also corrected for BSSE) were constructed for both polymorphs. β-TBB is more stable at 0 K by 0.75 kJ mol−1, but the curves cross at 76 K and γ-TBB becomes the more stable polymorph. While the transition temperature is quantitatively incorrect, it qualitatively agrees with experimental observations of γ-TBB being favored at higher temperatures.
In order to test which (if any) of the modes were responsible for polymorph conversion, the atoms in the optimized β-TBB structure were incrementally displaced along the rotational mode eigenvectors and the unit cell was optimized around the new structure. The results of these eigenvector scans are shown in Fig. 7 and reveal that both the 18.7 cm−1 mode and the 23.9 cm−1 mode displaced structures optimized towards γ-TBB unit cell dimensions, with the 18.7 cm−1 mode results noticeably closer to the known γ-TBB values.
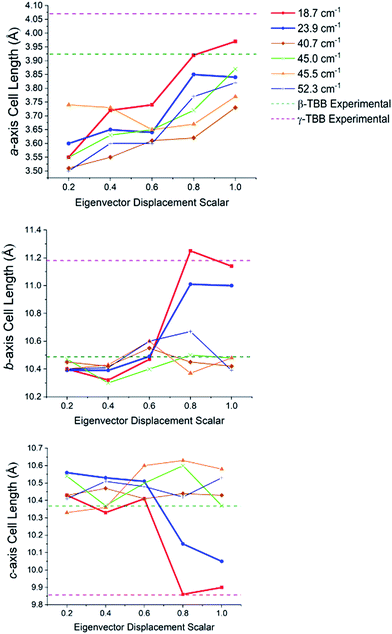 | ||
| Fig. 7 Changes in the lattice dimensions of β-TBB resulting from displacement along rotational-type lattice vibrations. | ||
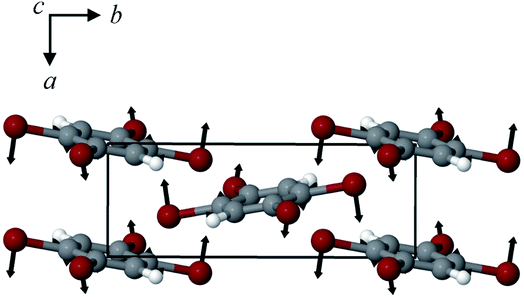
By examining the eigenvector displaced crystals, it was found that the structure resulting from displacement along the 18.7 cm−1 eigenvector coordinate correlated very well with the atomic positions found in γ-TBB. This was not true for the out-of-phase 23.9 cm−1 mode, which forced TBB to an unstable high energy arrangement that did not correspond to either TBB polymorph. Although it appears from Fig. 7 that the 23.9 cm−1 mode goes towards γ-TBB formation, the actual atomic positioning contradicts this, and only the 18.7 cm−1 mode yields both unit cell dimensions and atomic positions that match those of γ-TBB. The vibrational motion of the 18.7 cm−1 mode is represented in Fig. 8.
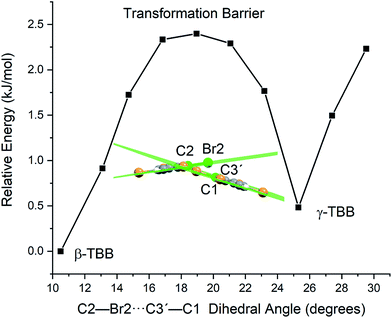
A less strained and therefore more realistic approach for mapping the potential energy surface of the polymorph transformation coordinate is to freeze a single coordinate and then step along it, allowing the rest of the system to fully relax. A change in the intermolecular C2–Br2⋯C3′–C1 dihedral angle mimics the TBB ring tilting differences between the polymorphs that can be seen in Fig. 1 and this dihedral angle also corresponds to the rotational motion that forms the basis of the 18.7 cm−1 vibration.
Optimizations were performed by initially freezing the dihedral value at 10.5°, corresponding to the angle observed in a full optimization of β-TBB, and incrementally increasing the angle towards the γ-TBB polymorph. All other atomic positions and lattice parameters were allowed to energetically relax. A second energy minimum was found for the structure at a dihedral angle of 25.3°, which is identical to the dihedral angle observed in γ-TBB.
Although the unit cell dimensions and atomic positions are in good agreement with the γ-TBB structure at this dihedral angle, there was a 4.6% contraction of the cell volume as compared to experiment.22 However, contraction is expected in a 0 K structural simulation (especially versus the 332 K experimental data22) and the volume reduction is not unlike that reported for β-TBB when comparing room temperature to 100 K (ref. 21) structures, which is about 5.0%.
The energy values determined over the course of the dihedral scanning are shown in Fig. 9. This revealed a barrier height of 2.40 kJ mol−1, which is a reasonable energy for the β → γ polymorph transformation considering the reported transition temperature of 307 K (ref. 12) (2.55 kJ mol−1). Performing a similar analysis on the dihedral angle changes that corresponded to the 23.9 cm−1 mode only resulted in an increase in energy along the potential energy scan, with no indication of γ-TBB formation. As a final check to ensure that the dihedral constraint placed on the γ-TBB did not cause chemically unrealistic approximations, a frequency analysis was performed and yielded no imaginary modes. These results collectively validate the dihedral-locked γ-TBB model solid to be a physically reasonable structure, and that the 18.7 cm−1 mode (observed experimentally at 17.1 cm−1 at 105 K and 15.5 cm−1 at 291 K) is the sole gateway lattice vibration responsible for polymorph conversion.
IV. Conclusions
A combined experimental and computational investigation of the Raman spectra and solid-state vibrational modes of crystalline TBB has revealed the specific vibrational mode responsible for polymorph conversion between the β and γ polymorphs. The solid-state DFT simulations were in excellent agreement with the experimental measurements, allowing for a very accurate assessment of the vibrational modes. By considering the rotational-type molecular motions and scanning along their eigenvectors in β-TBB, it was found that the 17.1 cm−1 mode in the 105 K Raman spectrum (calculated at 18.7 cm−1 and experimentally observed at 15.5 cm−1 at 291 K) was able to act as a gateway vibration and induce the transformation of the β-form to the γ-form. This investigation also determined the barrier to conversion to be 2.40 kJ mol−1, which is consistent with the mild thermal energy required to form the γ-TBB polymorph. As suggested by previous reports,6,12 motion along this low-energy vibrational coordinate is translated into a macroscopic mechanical effect due to a combination of structural elasticity, anisotropic strain accompanying the transition, and the consequent stressed domain boundaries between β-form and γ-form domains within the crystal lattice. The discovery and characterization of the gateway vibration that is the foundation of polymorphic change in crystalline TBB offers new insights into its unusual thermosalient behavior and presents a compelling target of study in other materials that undergo temperature-induced polymorph changes.Conflicts of interest
There are no conflicts to declare.References
- S. C. Sahoo, M. K. Panda, N. K. Nath and P. Naumov, Biomimetic crystalline actuators: Structure-kinematic aspects of the self-actuation and motility of thermosalient crystals, J. Am. Chem. Soc., 2013, 135(33), 12241–12251 CrossRef CAS PubMed.
- P. Commins, I. T. Desta, D. P. Karothu, M. K. Panda and P. Naumov, Crystals on the move: mechanical effects in dynamic solids, Chem. Commun., 2016, 52(97), 13941–13954 RSC.
- P. Naumov, S. Chizhik, M. K. Panda, N. K. Nath and E. Boldyreva, Mechanically responsive molecular crystals, Chem. Rev., 2015, 115(22), 12440–12490 CrossRef CAS PubMed.
- C. E. Mulijanto, H. S. Quah, G. K. Tan, B. Donnadieu and J. J. Vittal, Curved crystal morphology, photoreactivity and photosalient behaviour of mononuclear Zn(II) complexes, IUCrJ, 2017, 4(1), 65–71 CrossRef CAS PubMed.
- S. Mittapalli, D. Sravanakumar Perumalla and A. Nangia, Mechanochemical synthesis of N-salicylideneaniline: thermosalient effect of polymorphic crystals, IUCrJ, 2017, 4(3), 243–250 CrossRef CAS PubMed.
- Ž. Skoko, S. Zamir, P. Naumov and J. Bernstein, The thermosalient phenomenon. “jumping crystals” and crystal chemistry of the anticholinergic agent oxitropium bromide, J. Am. Chem. Soc., 2010, 132(40), 14191–14202 CrossRef PubMed.
- I. Lončarić, J. Popović, V. Despoja, S. Burazer, I. Grgičević, D. Popović and Ž. Skoko, Reversible thermosalient effect of N′-2-propylidene-4-hydroxybenzohydrazide accompanied by an immense negative compressibility: structural and theoretical arguments aiming toward the elucidation of jumping phenomenon, Cryst. Growth Des., 2017, 17(8), 4445–4453 CrossRef.
- D. P. Karothu, J. Weston, I. T. Desta and P. Naumov, Shape-memory and self-healing effects in mechanosalient molecular crystals, J. Am. Chem. Soc., 2016, 138(40), 13298–13306 CrossRef CAS PubMed.
- A. Khalil, E. Ahmed and P. Naumov, Metal-coated thermosalient crystals as electrical fuses, Chem. Commun., 2017, 53(60), 8470–8473 RSC.
- A. Khalil, C. T. Hu and P. Naumov, Nanoscale crystallization and thermal behaviour of 1,2,4,5-tetrabromobenzene, CrystEngComm, 2018, 20(5), 636–642 RSC.
- J.-H. Ko, K.-S. Lee, S. Chandra Sahoo and P. Naumov, Isomorphous phase transition of 1,2,4,5-tetrabromobenzene jumping crystals studied by Brillouin light scattering, Solid State Commun., 2013, 173, 46–50 CrossRef CAS.
- B. A. Zakharov, A. A. L. Michalchuk, C. A. Morrison and E. V. Boldyreva, Anisotropic lattice softening near the structural phase transition in the thermosalient crystal 1,2,4,5-tetrabromobenzene, Phys. Chem. Chem. Phys., 2018, 20(13), 8523–8532 RSC.
- S. C. Sahoo, S. B. Sinha, M. S. R. N. Kiran, U. Ramamurty, A. F. Dericioglu, C. M. Reddy and P. Naumov, Kinematic and mechanical profile of the self-actuation of thermosalient crystal twins of 1,2,4,5-tetrabromobenzene: A molecular crystalline analogue of a bimetallic strip, J. Am. Chem. Soc., 2013, 135(37), 13843–13850 CrossRef CAS PubMed.
- D. K. P. Ng, Y.-O. Yeung, W. K. Chan and S.-C. Yu, Columnar liquid crystals based on 2,3-naphthalocyanine core, Tetrahedron Lett., 1997, 38(38), 6701–6704 CrossRef CAS.
- L. Chen, Y. Honsho, S. Seki and D. Jiang, Light-harvesting conjugated microporous polymers: Rapid and highly efficient flow of light energy with a porous polyphenylene framework as antenna, J. Am. Chem. Soc., 2010, 132(19), 6742–6748 CrossRef CAS PubMed.
- D. Mondieig, M. A. Cuevas-Diarte and Y. Haget, Polymorphism of tetrachloro-1,2,4,5 benzene and tetrabromo-1,2,4,5 benzene, J. Therm. Anal. Calorim., 1989, 35(7), 2491–2500 CrossRef CAS.
- G. Gafner, The crystal and molecular structures of overcrowded halogenated compounds. II. β-1:2-4:5-tetrabromobenzene, Acta Crystallogr., 1960, 13(9), 706–716 CrossRef CAS.
- F. B. Johnson, Phase-Change in 1,2,4,5-tetrabromobenzene investigated by pure quadrupole resonance, Nature, 1956, 178, 590 CrossRef CAS.
- S. Krafczyk, H. Jacobi and H. Follner, Twinning of crystals as a result of differences between symmetrical and energetical most favorable structure arrangements, Cryst. Res. Technol., 1994, 29(5), 623–631 CrossRef CAS.
- H. F. Lieberman, R. J. Davey and D. M. T. Newsham, Br⋯Br and Br⋯H interactions in action: Polymorphism, hopping, and twinning in 1,2,4,5-tetrabromobenzene, Chem. Mater., 2000, 12(2), 490–494 CrossRef CAS.
- A. A. Mrse, Y. Lee, P. L. Bryant, F. R. Fronczek, L. G. Butler and L. S. Simeral, Pulsed 81Br nuclear quadrupole resonance spectroscopy of brominated flame retardants and associated polymer blends, Chem. Mater., 1998, 10(5), 1291–1300 CrossRef CAS.
- G. Gafner, The crystal and molecular structures of overcrowded halogenated compounds. V. γ-1,2:4,5-Tetrabromobenzene, Acta Crystallogr., 1964, 17(8), 982–985 CrossRef CAS.
- T. Dove Martin, Review: Theory of displacive phase transitions in minerals, Am. Mineral., 1997, 82, 213 Search PubMed.
- K. R. Morris, U. J. Griesser, C. J. Eckhardt and J. G. Stowell, Theoretical approaches to physical transformations of active pharmaceutical ingredients during manufacturing processes, Adv. Drug Delivery Rev., 2001, 48(1), 91–114 CrossRef CAS PubMed.
- J. Anwar and D. Zahn, Polymorphic phase transitions: Macroscopic theory and molecular simulation, Adv. Drug Delivery Rev., 2017, 117, 47–70 CrossRef CAS PubMed.
- R. Dovesi, A. Erba, R. Orlando, C. M. Zicovich-Wilson, B. Civalleri, L. Maschio, M. Rérat, S. Casassa, J. Baima, S. Salustro and B. Kirtman, Quantum-mechanical condensed matter simulations with CRYSTAL, Wiley Interdiscip. Rev.: Comput. Mol. Sci., 2018, e1360 Search PubMed.
- J. P. Perdew, K. Burke and M. Ernzerhof, Generalized gradient approximation made simple, Phys. Rev. Lett., 1996, 77(18), 3865–3868 CrossRef CAS PubMed.
- F. Weigend and R. Ahlrichs, Balanced basis sets of split valence, triple zeta valence and quadruple zeta valence quality for H to Rn: Design and assessment of accuracy, Phys. Chem. Chem. Phys., 2005, 7(18), 3297–3305 RSC.
- S. Grimme, J. Antony, S. Ehrlich and H. Krieg, A consistent and accurate ab initio parametrization of density functional dispersion correction (DFT-D) for the 94 elements H–Pu, J. Chem. Phys., 2010, 132(15), 154104 CrossRef PubMed.
- S. Grimme, A. Hansen, J. G. Brandenburg and C. Bannwarth, Dispersion-corrected mean-field electronic structure methods, Chem. Rev., 2016, 116(9), 5105–5154 CrossRef CAS PubMed.
- S. Grimme, S. Ehrlich and L. Goerigk, Effect of the damping function in dispersion corrected density functional theory, J. Comput. Chem., 2011, 32, 1456–1465 CrossRef CAS PubMed.
- S. F. Boys and F. Bernardi, The calculation of small molecular interactions by the differences of separate total energies. Some procedures with reduced errors, Mol. Phys., 1970, 19(4), 553–566 CrossRef CAS.
- L. Maschio, B. Kirtman, M. Rerat, R. Orlando and R. Dovesi, Ab initio analytical Raman intensities for periodic systems through a coupled perturbed Hartree–Fock/Kohn–Sham method in an atomic orbital basis. I. Theory, J. Chem. Phys., 2013, 139(16), 164101/1–164101/13 CAS.
- L. Maschio, B. Kirtman, M. Rerat, R. Orlando and R. Dovesi, Ab initio analytical Raman intensities for periodic systems through a coupled perturbed Hartree–Fock/Kohn–Sham method in an atomic orbital basis. II. Validation and comparison with experiments, J. Chem. Phys., 2013, 139(16), 164102/1–164102/9 CAS.
- D. G. Anderson, Iterative procedures for nonlinear integral equations, J. Assoc. Comput. Mach., 1965, 12(4), 547–560 CrossRef.
- K. M. White and C. J. Eckhardt, Single crystal Raman spectra of 1,2,4,5-tetrabromobenzene: Calculational and experimental assignment of the internal modes, J. Chem. Phys., 1998, 109(1), 208–213 CrossRef CAS.
- E. Burgos and H. Bonadeo, The lattice vibrations of 1,2,4,5-tetrabromobenzene, Chem. Phys. Lett., 1978, 57, 125–127 CrossRef CAS.
- F. Shimizu, Y. Suzuki, K. Mitarai, M. Fujino, H. Kawano, Y. Nibu, H. Shimada and R. Shimada, Pressure-induced phase transition in the 1,2,4,5-tetrabromobenzene crystal, Bull. Chem. Soc. Jpn., 1995, 68, 1883–1888 CrossRef CAS.
Footnote |
| † Electronic supplementary information (ESI) available. See DOI: 10.1039/c8sc03897j |
| This journal is © The Royal Society of Chemistry 2019 |

