
 Open Access Article
 This Open Access Article is licensed under a Creative Commons Attribution-Non Commercial 3.0 Unported Licence
A clean and effective potassium hydroxide pretreatment of corncob residue for the enhancement of enzymatic hydrolysis at high solids loading†
Xuewen Chi ab,
Chao Liub,
Yan-Hong Bia,
Guang Yub,
Yuedong Zhangb,
Zhaoyu Wang*a,
Bin Li*b and
Qiu Cuib
ab,
Chao Liub,
Yan-Hong Bia,
Guang Yub,
Yuedong Zhangb,
Zhaoyu Wang*a,
Bin Li*b and
Qiu Cuib
aSchool of Life Science and Food Engineering, Huaiyin Institute of Technology, Huai'an, Jiangsu 223003, China. E-mail: biowzy@126.com; Fax: +86-517-8355-9982; Tel: +86-517-83559565
bCAS Key Laboratory of Biofuels, CAS Key Laboratory of Bio-based Material, Dalian National Laboratory of Clean Energy, Qingdao Institute of Bioenergy and Bioprocess Technology, Chinese Academy of Sciences, Qingdao, Shandong 266101, China. E-mail: libin@qibebt.ac.cn; Fax: +86-532-80662724; Tel: +86-532-80662725
First published on 11th April 2019
Abstract
Corncob residue (CCR) is an economic feedstock with enormous potential for the production of bioethanol. In this work, potassium hydroxide (KOH) pretreatment of CCR was investigated under relatively mild conditions, and the effectiveness of KOH pretreatment was evaluated by enzymatic saccharification at high solid loading. Results showed that after KOH pretreatment (16 wt% KOH dosage at 70 °C for 90 min) and the enzymatic hydrolysis at 20% solids loading and 20 FPU g−1-substrate of cellulase loading, the glucose yield could reach up to about 91%, which was over 90% higher compared to the raw CCR without KOH pretreatment. Correspondingly, about 89% of lignin and 79% of extractives were removed after KOH pretreatment. In addition, the spent liquor of KOH pretreatment containing sylvite could be used as lignin-based fertilizer based on the concept of biorefinery. In this case, the entire process for the production of fermentable sugars was clean and sustainable, which is very vital for the conversion of lignocelluloses to bioenergy or chemicals.
Introduction
With the increasing global demand of energy and the concern for the sustainable development of human society, it is urgent to explore alternative resources for the production of renewable energy.1–3 Bioenergy (e.g., bioethanol) has been paid much attention over the past decades, because the feedstocks are abundant, readily available, and renewable lignocelluloses, including woods, agricultural wastes (e.g., wheat straw), industrial biomass wastes (e.g. corncob residue), etc.4 It has been reported that the annual global output of lignocellulosic biomass is about 170–200 billion tons.5 However, most of these lignocelluloses have not been utilized, particularly for agricultural and industrial biomass wastes. Therefore, the production and utilization of bioenergy by making better use of lignocelluloses is beneficial to the reduction of carbon emission and environment protection.6The global corn production was more than 900 million tons according to the report from the United States Department of Agriculture and approximately 40–50 million metric tons of corncobs could be collected.7 Due to its relatively high xylan content (about 25–30 wt%), corncob can be used as a feedstock for xylose (mainly for the production of xylitol), xylo-oligosaccharides (used as food and feed additives), and furfural production.8,9 After the extraction of xylan, considerable amounts of corncob residue (CCR) were generated as industrial biomass waste. In China, over five million tons of CCR are generated annually, most of which are burned to recover heat and cause environmental problems.9 Hence, both researchers and engineers are looking for other solutions to better use CCR. It has been reported that CCR could be used for the production of high value carbon materials,10,11 nanocellulose,12 levulinic acid by catalysis,13 L-lactic acid by fermentation,14 and also fermentable sugars by saccharification,15 due to its unique properties, such as, small particle size, high porosity, and high cellulose content (>50 wt%).
As for the production of fermentable sugars via enzymatic saccharification, pretreatment stage is highly required to break the natural recalcitrance (e.g., the presence of lignin, acetyl groups, extractives, and even ash, the high crystallinity of cellulose, the tight and dense arrangement of cell wall structure) of lignocelluloses, and the pretreatment methods that have been reported so far include physical, chemical, biological, and the combined methods.16,17 In sundry pretreatment methods, the chemical technique is mainly used to remove hemicellulose or lignin with acid, alkali, or organic solvents, among of which alkali-based pretreatment is one of the most studied technologies because (1) it can efficiently remove lignin, (2) obtain a high final total sugar yield (glucose + xylose),5 (3) generate less inhibitors compared to dilute acid pretreatment and hydrothermal pretreatment,18 and (4) it can be integrated with alkali-based pulp mill by partially utilizing the mature pulping equipment, the well-developed wastewater treatment and chemical recovery systems for the reduction of capital cost, based on the concept of integrated biorefinery.19
However, the mills that use agricultural waste (e.g., corncob, wheat straw) as the feedstock have a very smaller production scale compared to the large pulping plants which use wood chips, because agricultural waste has a quite limited collection radius due to its low density and high cost of transportation.4 In this case, the corresponding capital cost of alkali recovery system including the combustion of spent liquor and causticization (for the one with sodium hydroxide (NaOH)) will be very high.20 Although the recovery of sodium carbonate does not need causticization, sodium carbonate pretreatment has a lower effectiveness due to its weak basicity in comparison with NaOH.21 Therefore, in the light of the properties of CCR (mainly contains cellulose and lignin) derived from xylose or furfural mills, more sustainable and effective pretreatment technology for delignification should be developed to be ready for the downstream enzymatic hydrolysis.
Potassium hydroxide (KOH) can be used as an effective alkali reagent for pretreatment.22,23 In contrast with NaOH, KOH could be a suitable solution to address the issue of high chemical recovery cost. Because the spent liquor of KOH pretreatment contains potassium, it could be used for the production of potash fertilizer to put nutrients back to soils for the clean and sustainable production.24,25 On the other hand, KOH pretreatment could be implemented under relatively mild conditions due to the strong basicity of KOH.26 Therefore, KOH pretreatment has a high potential feasibility.
Therefore, in the present work, the CCR originated from xylose mill was pretreated by KOH under the relatively mild conditions to efficiently remove lignin. The effectiveness of KOH pretreatment was evaluated by the enzymatic hydrolysis at high solid loading, which is very vital to reduce the capital and process cost for the downstream conversion of bioethanol or chemicals.27,28 Also, in order to intuitively observe the structure changes, the CCR samples before and after pretreatment were comprehensively characterized by scanning electron microscope (SEM), Fourier transform infrared spectroscopy (FTIR), and X-ray diffraction (XRD). In addition, the mass balance of KOH pretreatment and enzymatic hydrolysis at high solid loading was investigated as well. To our best knowledge, KOH pretreatment of CCR for the production of fermentable sugar and the matched enzymatic hydrolysis at high solids loading for the evaluation of the effectiveness of KOH pretreatment have not been reported in literature. The cost-effective and clean production of fermentable sugars from CCR (an industrial biomass waste) is of significant importance for the sustainable development of the local economy and society with the better and full utilization of lignocellulosic materials (e.g., agricultural wastes).
Experimental
Materials
Corncob residue (CCR) used in this work was gifted by Futaste Co., Ltd. (China), which use corncob as raw material for the manufacture of xylose and xylitol. The main steps for the production of xylose included dilute acid hydrolysis of corncob (to release xylose), hydrolyzate purification, concentration, and crystallization.29 The received CCR was placed in sealed bags and stored in refrigerator at 4 °C for use. All chemicals (e.g., KOH, H2SO4) were purchased from Sinopharm Chemical Reagent Co. Ltd. and used directly without further purification. In addition, the cellulase enzyme was obtained by Qingdao Vland Biotech Inc. The activity of cellulase was 86 FPU mL−1, which was tested by the standard procedure,30 and the protein content of cellulase was 80 mg-protein per mL, as determined by the standard Bradford method.KOH pretreatment of CCR
The pretreatment of CCR was carried out in a cooking reactor (VRD-42SD-A China Pulp and Paper Research Institute, Beijing, China) equipped with four cooking tubes inside the reactor, and the volume of each tube was 1 L. For each pretreatment experiment, 50 g CCR (oven dried basis) well mixed with different dosages of KOH was put into one cooking tube, and based on our previous work,4 the pretreatment was conducted with the solid to liquid ratio of 1![[thin space (1/6-em)]](https://www.rsc.org/images/entities/char_2009.gif) :10 at 70 °C and 90 °C for 90 min, respectively. During pretreatment, the cooking reactor was rotated with a speed of 1 rpm. Upon completion of KOH pretreatment, the mixed stock was taken out and separated into the solid of pretreated CCR and spent liquor though a filtration fabric bag with the mesh of 500. Then, the pretreated CCR was washed with de-ionized water until neutrality. After that, the washed samples were placed in locked plastic bags and stored at 4 °C for further tests.
:10 at 70 °C and 90 °C for 90 min, respectively. During pretreatment, the cooking reactor was rotated with a speed of 1 rpm. Upon completion of KOH pretreatment, the mixed stock was taken out and separated into the solid of pretreated CCR and spent liquor though a filtration fabric bag with the mesh of 500. Then, the pretreated CCR was washed with de-ionized water until neutrality. After that, the washed samples were placed in locked plastic bags and stored at 4 °C for further tests.
Enzymatic hydrolysis
Enzymatic hydrolysis of CCR samples was carried out in 40 mL bottles in an air bath shaking incubator (120 rpm) at 50 °C for 72 h. The enzymatic hydrolysis were performed at solid loading of 2, 5, 10, 15, and 20% (w/w), respectively, and the enzyme loading was 3, 5, 10, 15, and 20 FPU g−1-substrate, respectively (i.e., 3.4, 5.7, 11.2, 16.9, and 22.4 mg-protein per g-glucan, accordingly). Sodium citrate buffer (0.1 M) was added to maintain the pH at 4.8 before enzymatic hydrolysis, and 200 μL of 20 mg mL−1 sodium azide was added to prevent the growth of bacteria. Furthermore, hydrolyzate samples were taken after 12, 24, 48, and 72 h of hydrolysis to analyse the yield of glucose accordingly. Before analysis, hydrolyzate samples were centrifuged at 5000 rpm for 5 min, and then the supernatants were filtered through a membrane with pore size of 0.22 μm. After that, the concentration of glucose in hydrolyzate was determined by high-performance liquid chromatography (HPLC). Cellobiose was not detectable, because the cellulase cocktail contained some β-glucosidase.Particularly, for the enzymatic hydrolysis with solid loading of 20%, buffer solution was not used and the pH of the mixture was adjusted directly with 1 M H2SO4. Because of the difficulty of mass transfer in such high solid loading without flowable water, to achieve sufficient mixing between substrate and cellulase, the sealed glass bottles (100 mL) with substrates were fixed on a vertical rotary disc with the rotation speed of 10 rpm (Fig. S1,† self-made incubator), and the saccharification was implemented with gravity blending at 50 °C in the first 24 h for initial liquefaction. After that, the sealed glass bottles were moved to the regular shaking incubator (SHA-C, Huangjie, China) for another 48 h hydrolysis. At last, the test of glucose concentration was conducted as mentioned above. The glucose yields were calculated based on the glucose mass in hydrolysates and the potentially available glucose in the CCR.31,32
Chemical component analysis of CCR
The chemical composition of the raw and pretreated CCR was determined by the typical two-stage acid hydrolysis approach in accordance with the National Renewable Energy Laboratory (NREL) protocol.33 The monosaccharides were tested by a HPLC (Model 1200, Agilent, USA) system equipped with a Bio-Rad Aminex HPX-87H column at 55 °C. The 0.005 M H2SO4 was used as mobile phrase with a flow rate of 0.6 mL min−1. The effectiveness of KOH pretreatment and enzymatic hydrolysis was calculated using the following equations:| Rsolid (%) = (Mpretreated biomass/Moriginal biomass) × 100% | (1) |
| Rglucan (%) = ((Rsolid × Cglucan of pretreated biomass)/Cglucan of raw biomass) × 100% | (2) |
| Dlignin (%) = (1 − (Rsolid × Clignin of pretreated biomass)/Clignin of raw biomass) × 100% | (3) |
| Yglucose (%) = (Mglucose in Hydrolyzate × 0.9/Mglucan in raw biomass) × 100% | (4) |
Characterization of CCR before and after pretreatment
The FTIR spectra of the untreated and pretreated CCR samples were detected on a FTIR spectrometer (Nicolet 6700, Thermo Fisher Scientific Inc., USA) though the standard KBr pellet method. The FTIR spectra was recorded with the wavenumber in the range of 4000 to 400 cm−1 with a resolution of 4 cm−1 and 32 scans per test. The crystalline structure of the untreated and pretreated CCR samples was determined by an XRD instrument (D8 ADVANCE, Bruker Co., Germany) at 80 mA and 40 kV. The scanning angle was collected with the 2θ range from 5 to 65°, and the crystallinity index (CrI) was calculated on the basis of the Segal method.34 The SEM analysis of the CCR samples were carried out with a Hitachi S-4800 (Hitachi, Japan) at 3.0–8.0 kV in order to analyze the morphological structures of CCR before and after KOH pretreatment. Before scanning, samples were coated with platinum to improve the conductivity.Results and discussion
Chemical compositions of CCR after KOH pretreatment
The chemical composition changes of CCR after pretreatment with varying KOH dosage at 70 and 90 °C are listed in Tables 1 and 2, respectively. As can be seen from Table 1, the untreated CCR mainly contained glucan (57%) and lignin (21%) with relatively low extractives, and the xylan content was only 2.7%, which was due to the hydrolysis of hemicellulose during xylose production in xylose mill. Table 1 also presents that, with the increase of KOH dosage, the solid recovery after KOH pretreatment was declined obviously, which was mainly due to the efficient removal of lignin and extractives, thus leading to the increase of glucan content in the pretreated CCR. For instance, after pretreatment with KOH dosage of 16 wt% at 70 °C, the solid recovery (Rsolid) was 66.4 ± 0.3%, the corresponding Dlignin was 89.4 ± 0.5%, the extractives content decreased to 4.3 ± 1.3%, and the glucan content increased to 82.9 ± 0.4%. When KOH dosage was higher than 16 wt%, the effectiveness of KOH pretreatment at the relatively lower temperature of 70 °C was basically steady.| KOH dose wt% | Rsolid, % | Extractives content, % | Lignin content, % | Dlignin, % | Glucan content, % | Rglucan, % | Xylan content, % |
|---|---|---|---|---|---|---|---|
| a Untreated CCR. | |||||||
| —a | 13.4 ± 0.1 | 20.5 ± 0.6 | 57.0 ± 1.4 | 2.7 ± 0.1 | |||
| 7 | 74.7 ± 0.1 | 5.0 ± 0.2 | 10.5 ± 0.3 | 60.9 ± 1.1 | 75.4 ± 0.1 | 98.9 ± 0.1 | 3.8 ± 0 |
| 10 | 70.8 ± 0.2 | 2.5 ± 0.2 | 5.5 ± 0 | 81.0 ± 0.1 | 79.2 ± 0.6 | 98.3 ± 0.4 | 3.3 ± 0.6 |
| 13 | 66.7 ± 0.3 | 4.5 ± 0.1 | 5.3 ± 0.2 | 82.3 ± 0.5 | 81.9 ± 0.4 | 95.8 ± 0.2 | 3.1 ± 0.7 |
| 16 | 66.4 ± 0.3 | 4.3 ± 1.3 | 3.0 ± 0.2 | 89.4 ± 0.5 | 82.9 ± 0.4 | 96.5 ± 0.1 | 2.2 ± 0 |
| 19 | 65.7 ± 0.2 | 3.0 ± 0.3 | 3.2 ± 0.3 | 88.8 ± 1.0 | 84.6 ± 0.4 | 97.4 ± 0.8 | 2.1 ± 0 |
| 22 | 65.0 ± 0.2 | 2.9 ± 0.1 | 3.6 ± 0 | 88.0 ± 0 | 85.4 ± 0.4 | 97.3 ± 0.8 | 2.1 ± 0 |
| 25 | 64.6 ± 0.1 | 3.3 ± 0 | 3.7 ± 0.2 | 87.7 ± 0.5 | 87.0 ± 1.0 | 98.5 ± 1.0 | 2.1 ± 0 |
| 28 | 64.8 ± 0 | 4.2 ± 0.7 | 3.5 ± 0.3 | 88.2 ± 0.9 | 85.2 ± 0.1 | 96.8 ± 0.1 | 2.3 ± 0 |
| KOH dose, wt% | Rsolid, % | Extractives content, % | Lignin content, % | Dlignin, % | Glucan content, % | Rglucan, % | Xylan content, % |
|---|---|---|---|---|---|---|---|
| a Untreated CCR. | |||||||
| —a | 13.4 ± 0.1 | 20.5 ± 0.6 | 57.0 ± 1.4 | 2.7 ± 0.1 | |||
| 7 | 70.8 ± 0.1 | 4.7 ± 0 | 9.9 ± 0.3 | 65.1 ± 1.0 | 77.8 ± 0.7 | 96.6 ± 0.9 | 3.6 ± 0 |
| 10 | 66.9 ± 0 | 6.9 ± 0 | 5.0 ± 0.2 | 83.0 ± 0.5 | 79.7 ± 0.2 | 93.5 ± 0.3 | 1.8 ± 0 |
| 13 | 62.1 ± 0.6 | 5.0 ± 0.5 | 4.1 ± 0.3 | 87.0 ± 1.0 | 85.9 ± 0.1 | 93.5 ± 0.8 | 1.9 ± 0.3 |
| 16 | 61.8 ± 0.1 | 0.7 ± 0.1 | 0.8 ± 0.2 | 96.1 ± 0.4 | 87.5 ± 0.1 | 95.9 ± 0.5 | 1.5 ± 0.1 |
| 19 | 59.6 ± 0.1 | 2.4 ± 0.2 | 1.5 ± 0.2 | 95.0 ± 0.5 | 88.8 ± 0.2 | 92.4 ± 1.6 | 1.4 ± 0 |
| 22 | 57.0 ± 0.4 | 3.0 ± 0.1 | 1.3 ± 0.2 | 96.4 ± 0.4 | 91.5 ± 0.3 | 91.5 ± 0.3 | 1.5 ± 0.1 |
| 25 | 56.3 ± 0.1 | 2.8 ± 0.2 | 1.4 ± 0.2 | 96.2 ± 0.5 | 92.1 ± 0.6 | 91.0 ± 0.8 | 2.0 ± 0 |
| 28 | 54.4 ± 0 | 4.4 ± 0 | 1.4 ± 0.2 | 96.3 ± 0.4 | 89.8 ± 1.4 | 85.7 ± 1.2 | 1.2 ± 0.1 |
However, in the case of KOH pretreatment at 90 °C with a higher KOH dosage (over 16 wt%), despite a higher Dlignin and glucan content could be obtained compared to the pretreatment at 70 °C, the corresponding Rsolid kept reducing with the increment of KOH dosage (Table 2). For example, the Rsolid was lowered to about 54% after the pretreatment with KOH dosage of 28 wt% at 90 °C, which indicated the severe sugar loss due to the strong alkali condition. In fact, the corresponding glucan recovery was only about 85.7%, which was clearly lower in comparison with the one (96.6%) obtained after the pretreatment with KOH dosage of 16 wt% at 70 °C. A higher glucan recovery after pretreatment could supply more available sugars for enzymatic hydrolysis, which was a prerequisite to gain a high final total sugar yield.35 Pretreatment with KOH dosage of 10 wt% could also achieve relative good delignification, but the enzymatic hydrolysis at high solids loading didn't perform well with this substrate, which will be discussed in later section.
Enzymatic hydrolysis of pretreated CCR
Enzymatic hydrolysis behaviors were generally considered to be a vital prototype for the evaluation of pretreatment efficiency.36 Shown in Fig. 1 is the effect of KOH dosage of pretreatment on glucose yield after enzymatic hydrolysis with a low solid loading (5%) and a high enzyme loading (20 FPU g−1-substrate). | ||
| Fig. 1 The effect of KOH dosage on glucose yield after enzymolysis at a low solid loading of 5% (enzymatic hydrolysis conditions: 20 FPU cellulase per g-substrate at 50 °C for 72 h). | ||
As can be seen from Fig. 1, for the CCR pretreated at 70 °C, the glucose yield increased with the increase of KOH dosage. When the KOH dosage was 7%, the glucose yield was approximately 62%. When the KOH dosage was 13 wt%, the maximum glucose yield reached to about 98%, which was 2 times higher compared to the raw CCR (48%). The obvious improvement of glucose yield was mainly due to the efficient removal of lignin and extractives35 (Table 1), leading to the near complete releasing of glucose from the pretreated CCR during saccharification. Also, the glucose yield was basically steady when KOH dosage was over 13 wt%, which was due to the fact that the corresponding Rsolid and glucan content in the pretreated CCR were relatively the same (Table 1). However, for the CCR pretreated at 90 °C, the glucose yield showed a slightly declining trend with the increasing of KOH dosage when KOH dosage was higher than 16 wt%, and the corresponding glucose yield with the pretreatment at 90 °C was relatively lower compared to the one with the pretreatment at 70 °C. This phenomenon could be due to the loss of digestible glucan under severer pretreatment conditions.
Fig. 2 shows the effect of KOH dosage of pretreatment on glucose yield after enzymatic hydrolysis with a high solid loading (15%) and a low enzyme loading (5 FPU g−1-substrate). It was found that, the glucose yield of raw CCR was the same either with low enzyme loading or with the high enzyme loading. However, as shown in Fig. 2, the glucose yield for the pretreated CCR with KOH dosage of 10 wt% was not improved after pretreatment. It is worth noting that the lignin content of the sample treated with 10 wt% KOH was 5%, which was higher than the ones (0.8–4.1 wt%) with higher KOH dosage. Thus, a lower lignin content might be the key influential factor for achieving high glucose yield at high solid loading. Also, the glucose yield at solid loading of 15% was lower compared to the one at a lower solid loading (Fig. 1). These results were due to the fact that the mass transfer was hindered during saccharification at the high solid loading.15 Fig. 2 also presents that the glucose yield with the pretreatment at 70 °C was systematically similar to the one with the pretreatment at 90 °C, and the highest glucose yield was about 77% for the pretreated CCR with KOH dosage of 16 wt%. Thus, to save energy consumption, the relatively lower temperature of 70 °C was suitable for KOH pretreatment of CCR.
 | ||
| Fig. 2 The effect of KOH dosage on the glucose yield of enzymatic hydrolysis at 15% solid loading (enzymatic hydrolysis conditions: 5 FPU cellulase per g-substrate at 50 °C for 72 h). | ||
For the following enzymatic hydrolysis, the used substrate was the pretreated CCR with KOH dosage of 16 wt% at 70 °C for 90 min. The impact of solid loading on glucose yield of enzymatic hydrolysis is displayed in Fig. 3. As can be seen, 97% of glucose yield could be obtained after enzymatic hydrolysis at the solid loading of 2%, indicating that the KOH pretreated CCR had a quite higher digestibility with a very low cellulase loading of 5 FPU g−1-substrate (i.e. 6 FPU g−1-glucan) for 72 h, in comparison with the CCR pretreated with deep eutectic solvents and enzymatic saccharification with 20 FPU g−1-substrate of cellulase.36 This glucose yield (97%) was also clearly higher compared to the reported value of 83.7% for furfural residue with formic acid pretreatment combined alkaline hydrogen peroxide post-treatment and enzymatic hydrolysis with 7 FPU g−1-cellulose for 96 h.37 Again, this high digestibility of pretreated CCR was mainly due to the sufficient removal of lignin and extractives. In addition, Fig. 3 also shows that, the glucose yield was gradually reduced with the increase of solid loading of saccharification, which was due to the increase of mass transfer limitation and product inhibition.15
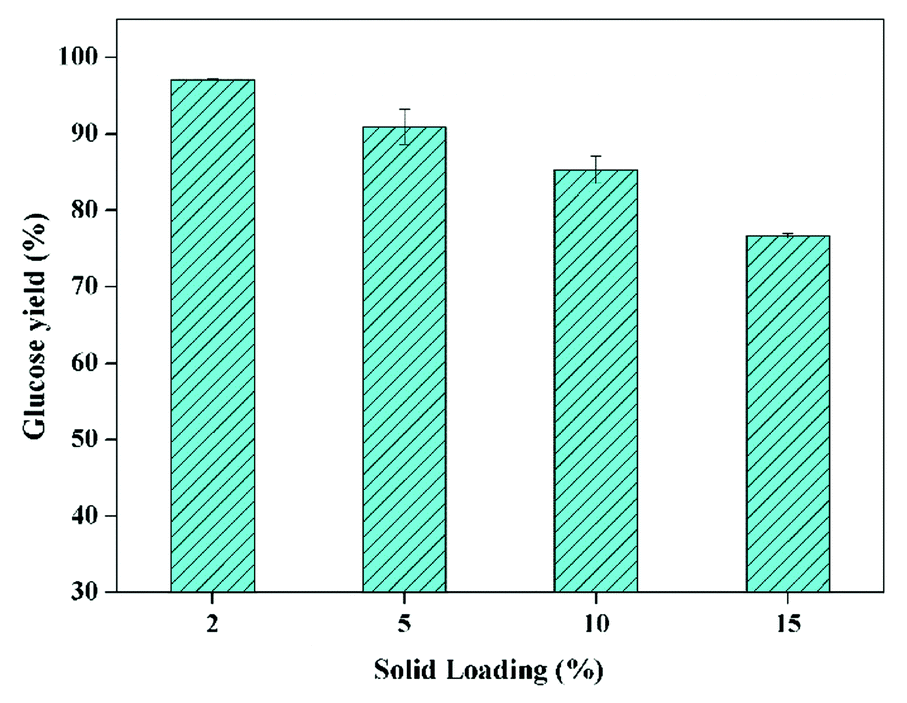 | ||
| Fig. 3 The impact of solid loading on glucose yield of enzymatic hydrolysis (CCR pretreated with 16 wt% of KOH at 70 °C for 90 min; enzyme loading of 5 FPU g−1-substrate at 50 °C for 72 h). | ||
However, it has been realized that enzymatic hydrolysis conducted at high-solids loadings (≥15%, w/w) is of significant importance for the increase of sugar concentration as well as the reduction of capital and process cost for the production of bioethanol.27 Therefore, enzymatic hydrolysis at solid loading of 15% should be investigated in detail. The glucose yield as the function of enzymatic hydrolysis time with different enzyme loadings is exhibited in Fig. 4, which presents that the glucose yield was up to 71% after enzymatic hydrolysis with the cellulase loading of 3 FPU g−1-substrate for 72 h. Also, the enzymatic hydrolysis efficiency in the first 12 hours could be apparently enhanced when the enzyme loading was 10 FPU g−1-substrate (i.e. 12 FPU g−1-glucan), and the glucose yield could reach to about 85% after saccharification for 48 h, which was obviously higher compared to the sulfite pretreated CCR (81.2%) with the enzymatic hydrolysis at 2.5% of solid loading, 12 FPU g−1-cellulose of cellulase, and 15 CBU g−1-cellulose of β-glucosidase.38
 | ||
| Fig. 4 Glucose yield as the function of enzymatic hydrolysis time with different enzyme loading (CCR pretreated with 16 wt% of KOH at 70 °C for 90 min; enzymatic hydrolysis solid loading of 15% at 50 °C). | ||
In addition, a higher sugar concentration could be obtained after the enzymatic hydrolysis at higher solid loading, and theoretically higher sugar concentration could yield a higher ethanol concentration after fermentation, which could reduce the energy consumption and process cost of distillation.39 It was reported that the downstream distillation could be economically feasible only with the ethanol concentration no less than 4%, which meant that the corresponding solid loading of enzymatic hydrolysis should be no less than 20%, generally.23,31 Therefore, the enzymatic hydrolysis at 20% of solid loading was further studied. To overcome the mass transfer limitation under such high solid loading, a two-step enzymatic hydrolysis was conducted. The first step for initial liquefaction was implemented with gravity blending, and the second step for complete saccharification was carried out with the regular mixing of shaking in incubator, as described in the experimental section. The impact of enzyme loading on glucose yield of high solid loading enzymatic hydrolysis (20%) is given in Fig. 5, which exhibits that the glucose yield increased with the increase of enzyme loading, and the glucose yield could be boosted to 78 and 91% with the enzyme loading of 15 and 20 FPU g−1 substrate, respectively. To lower the enzyme loading at high solid loading enzymatic hydrolysis, sufficient pre-mixing during the initial liquefaction and fed-batch operation could be doable.15,27 The inhibition of enzymes by sugars is the other major influence factor impacting the enzymatic hydrolysis, and it could be reduced by timely separation of sugars.40
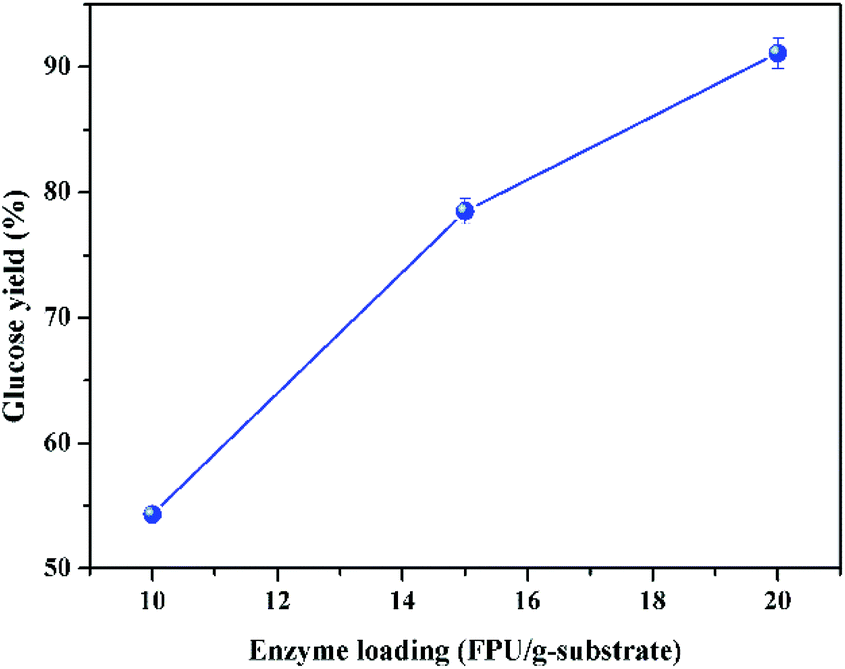 | ||
| Fig. 5 Impact of enzyme loading on glucose yield after enzymolysis at the solid loading of 20% (CCR pretreated with 16 wt% of KOH at 70 °C for 90 min; enzymatic hydrolysis at 50 °C for 72 h). | ||
Characterization of pretreated CCR
To investigate the extent of the structure changes of CCR before and after KOH pretreatment, the FTIR, XRD, and SEM analyses were carried out. FTIR spectra and chemical band assignments of CCR are shown in supplementary Fig. S2 and Table S1,† respectively. The broad bands at around 3430 and 2900 cm−1 were attributed to the stretching of –OH and C–H groups (of the aliphatic moieties in cellulose and lignin), respectively,41 and the peak at 1640 cm−1 was due to the O–H bending vibration of absorbed water. The bands at 1715 cm−1 was related to the C![[double bond, length as m-dash]](https://www.rsc.org/images/entities/char_e001.gif) O stretching in lignin, the peaks at 1600 and 1510 cm−1 were associated with the aromatic skeletal vibration of lignin, the peak at 1261 cm−1 was assigned to the C–O stretching in esters of lignin or the ester links between lignin and carbohydrates,35 and the band at 832 cm−1 was due to the CH out-of-plane deformation of benzenes in lignin.42 The intensity of these bands was clearly reduced (Fig. S2†), which was due to the efficient removal of lignin. Correspondingly, the intensity of the peaks at 1314 cm−1 (CH2 rocking vibration at C6), 898 cm−1 (C–O–C stretching at the β-(1–4)-glycosidic linkages), and 662 cm−1 (C–OH out-of-plane bending)43 were relatively increased after KOH pretreatment because of the increase of glucan proportion in the pretreated CCR, and this result was in line with the component analysis (Tables 1 and 2).
O stretching in lignin, the peaks at 1600 and 1510 cm−1 were associated with the aromatic skeletal vibration of lignin, the peak at 1261 cm−1 was assigned to the C–O stretching in esters of lignin or the ester links between lignin and carbohydrates,35 and the band at 832 cm−1 was due to the CH out-of-plane deformation of benzenes in lignin.42 The intensity of these bands was clearly reduced (Fig. S2†), which was due to the efficient removal of lignin. Correspondingly, the intensity of the peaks at 1314 cm−1 (CH2 rocking vibration at C6), 898 cm−1 (C–O–C stretching at the β-(1–4)-glycosidic linkages), and 662 cm−1 (C–OH out-of-plane bending)43 were relatively increased after KOH pretreatment because of the increase of glucan proportion in the pretreated CCR, and this result was in line with the component analysis (Tables 1 and 2).
FTIR analysis can also be used to calculate the cellulose crystallinity, and the total crystallinity index (TCI) and lateral order index (LOI) were calculated by the FTIR absorbance ratios of A1372/A2900 and A1430/A897, respectively.44,45 However, CrI based on XRD was used to calculate the crystallinity index of CCR samples including lignin and extractives, in addition to the non-crystalline cellulose. As can be seen from Table 3, the CrI of pretreated CCR was increased and the CrI of the pretreated CCR with 16 wt% KOH was up to 61.3%, which was about 18% higher in comparison with the raw CCR. Correspondingly, the intensity of 101 and 002 peaks of pretreated CCR was relatively increased (Fig. S3 in ESI†). These results were due to the removal of amorphous lignin and extractives after pretreatment.35 In contrast, the TCI and LOI of cellulose were obviously reduced after KOH pretreatment, which was associate with the destruction of the crystalline region of cellulose. Similar results were also reported previously.4,46
| Samples | TCI | LOI | CrI (%) |
|---|---|---|---|
| Raw CCR | 1.12 | 3.95 | 51.8 |
| Pretreated CCR with 10 wt% KOH | 1.09 | 2.99 | 58.7 |
| Pretreated CCR with 16 wt% KOH | 1.03 | 2.87 | 61.3 |
In addition, pretreatment could modify the morphology of CCR as well, and the changes before and after KOH pretreatment are evidenced in Fig. 6. It was observed that the raw CCR (Fig. 6a) displayed a compact and rough surface structure due to the cover of lignin and extractives on the surface of cellulose fiber, which could hinder the accessibility of cellulose to enzyme. Yet, the surface of pretreated CCR became relatively smoother (Fig. 6b) because of the removal of lignin and extractives as listed in Tables 1 and 2. With the increase of KOH dosage, more lignin could be extracted. As a consequence, a large amount of pores were generated (Fig. 6c), which was beneficial to the amelioration of downstream enzymatic saccharification.5
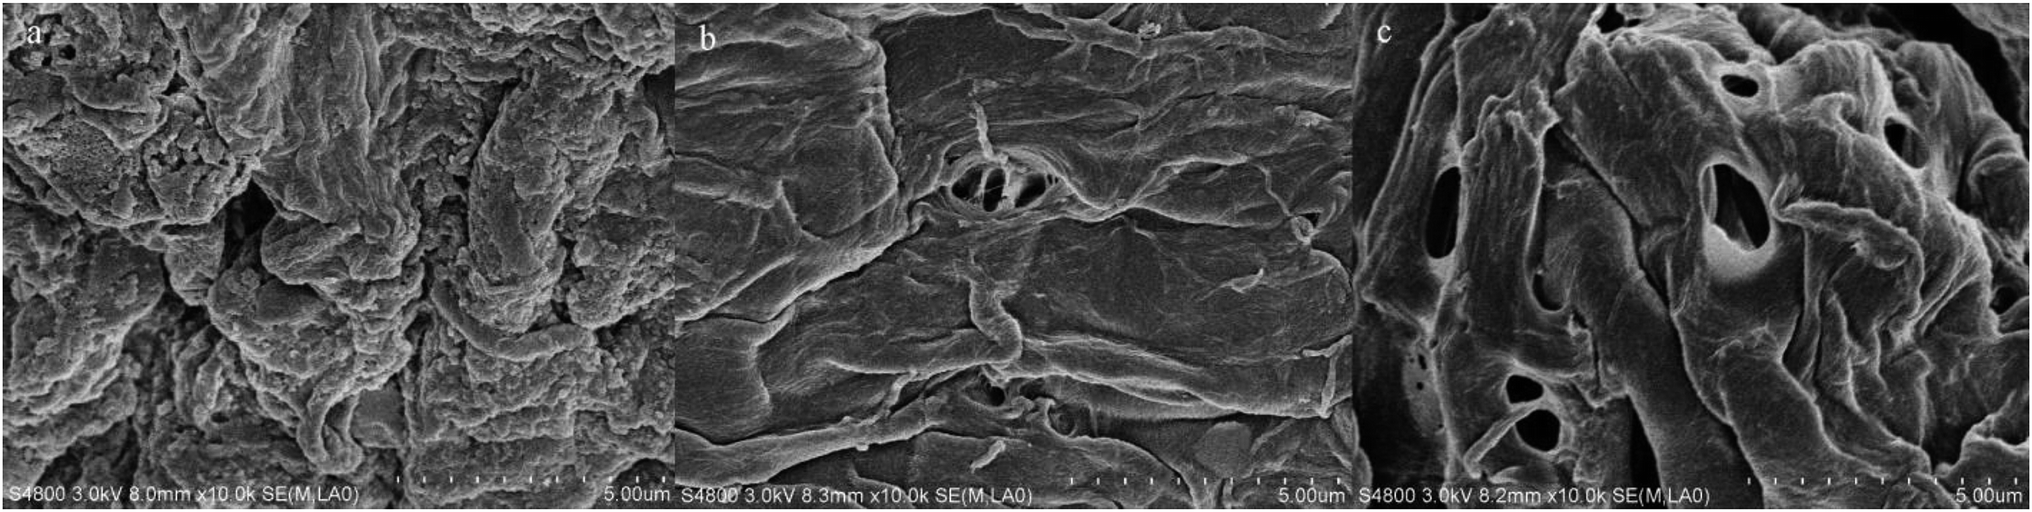 | ||
| Fig. 6 SEM images of CCR samples before and after KOH pretreatment ((a) raw CCR; (b) pretreated CCR with 10 wt% KOH; (c) pretreated CCR with 16 wt% KOH). | ||
Mass balance of KOH pretreatment and enzymolysis
The overall process and mass balance of KOH pretreatment and enzymatic hydrolysis of CCR is exhibited in Fig. 7. As can be seen, 1 kg CCR derived from a xylose mill was pretreated with KOH at relatively mild conditions (16 wt% of KOH dosage at 70 °C for 90 min). After pretreatment, about 89% of lignin and 79% of extractives were efficiently removed, and only about 3.4% of cellulose (i.e. glucan) was lost by degradation, leading to a quite high digestibility of the pretreated CCR. Subsequently, the pretreated CCR was subjected to enzymatic hydrolysis at a high solid loading of 20% with the cellulase loading of 20 FPU g−1-substrate, and 578 g glucose (217 g L−1) and 13.6 g xylose could be released after saccharification for 72 h (further prolonging saccharification time only slightly increase the sugar yield (less than 0.5%)). The corresponding glucose yield was 91% based on the glucose content of raw CCR, and that was over 90% higher compared to the raw CCR without KOH pretreatment. Also, according to the results obtained, if the cellulase loading was fixed at 5 PFU g−1-substrate (i.e. 6 FPU g−1-glucan) to lower the cost of saccharification, the solid loading of enzymatic hydrolysis should be reduced to 15% to reach a relatively high glucose yield of 77%, and correspondingly, 488 g glucose (129 g L−1) could be obtained from 1 kg raw CCR after KOH pretreatment and enzymatic saccharification. | ||
| Fig. 7 Overall mass balance of KOH pretreatment and enzymatic hydrolysis of CCR. | ||
In addition, under the conditions of KOH pretreatment (16 wt% of KOH dosage at 70 °C for 90 min), 0.16 t KOH was needed to treat 1 t raw CCR, and the generated spent liquor of KOH pretreatment contained 134 kg K (equivalent to K2O), which could be used for producing lignin-based fertilizer based on the concept of the integrated biorefinery.25,47 In this case, the whole process of KOH pretreatment under the relatively mild conditions could be more sustainable and economically feasible, which could be potentially applied to the conversion of lignocelluloses to bioenergy or chemicals.
Conclusion
In this work, corncob residue (CCR) was pretreated by KOH under relatively mild conditions, and the effectiveness of KOH pretreatment was evaluated by enzymatic hydrolysis at high solids loading. It was found that KOH pretreatment efficiently removed lignin and extractives, which could effectively improve the enzyme accessibility of substrates, thus apparently improving the efficiency of the downstream enzymatic hydrolysis. About 91% of glucose yield was obtained after KOH pretreatment (16 wt% of KOH dosage at 70 °C) and the enzymatic hydrolysis at 20% of solid loading with 20 FPU g−1-substrate of cellulase loading. This glucose yield was over 90% higher compared to raw CCR without KOH pretreatment. In addition, the spent liquor of KOH pretreatment could be used as lignin-based fertilizer on the basis of the concept of biorefinery. In this case, the overall process for the production of fermentable sugar was clean and sustainable, which will be conducive to the protection of environment and the conversion of lignocelluloses to bioenergy or chemicals.Conflicts of interest
There are no conflicts to declare.Abbreviations
| CCR | Corncob residue |
| CrI | Crystallinity index |
| TCI | Total crystallinity index |
| LOI | Lateral order index |
Acknowledgements
The authors would like to thank the Natural Science Foundation of China (No. 31870568, No. 21676114, and No. 31700509), the Major Program of Shandong Province Natural Science Foundation (No. ZR2018ZB0208), Six Talent Peaks Project of Jiangsu Province (No. SWYY-011), as well as the “Transformational Technologies for Clean Energy and Demonstration”, Strategic Priority Research Program of the Chinese Academy of Sciences (No. XDA21060201).References
- L. R. Lynd, X. Liang, M. J. Biddy, A. Allee, H. Cai, T. Foust, M. E. Himmel, M. S. Laser, M. Wang and C. E. Wyman, Curr. Opin. Biotech., 2017, 45, 202–211 CrossRef CAS PubMed.
- B. Satari, K. Karimi and R. Kumar, Sustainable Energy Fuels, 2019, 3, 11–62 RSC.
- R. Kumar, M. Tabatabaei, K. Karimi and I. Sárvári Horváth, Biofuel Res. J., 2016, 3, 347–356 CrossRef CAS.
- X. Xie, X. Feng, S. Chi, Y. Zhang, G. Yu, C. Liu, Z. Li, B. Li and H. Peng, Bioresource Technology Reports, 2018, 3, 169–176 CrossRef.
- H. Xu, B. Li and X. Mu, Ind. Eng. Chem. Res., 2016, 55, 8691–8705 CrossRef CAS.
- F. Battista and D. Bolzonella, Biofuels, Bioprod. Biorefin., 2018, 12, 711–723 CrossRef CAS.
- W. H. Qu, Y. Y. Xu, A. H. Lu, X. Q. Zhang and W. C. Li, Bioresour. Technol., 2015, 189, 285–291 CrossRef CAS PubMed.
- Y. Zhang, X. Mu, H. Wang, B. Li and H. Peng, J. Agric. Food Chem., 2014, 62, 4661–4667 CrossRef CAS PubMed.
- C. Liu, B. Li, H. Du, D. Lv, Y. Zhang, G. Yu, X. Mu and H. Peng, Carbohydr. Polym., 2016, 151, 716–724 CrossRef CAS PubMed.
- F. Yue, J. Zhang, C. M. Pedersen, Y. Wang, T. Zhao, P. Wang, Y. Liu, G. Qian and Y. Qiao, ChemistrySelect, 2017, 2, 583–590 CrossRef CAS.
- W. H. Qu, Y. Y. Xu, A. H. Lu, X. Q. Zhang and W. C. Li, Bioresour. Technol., 2015, 189, 285–291 CrossRef CAS PubMed.
- C. Liu, H. Du, L. Dong, X. Wang, Y. Zhang, G. Yu, B. Li, X. Mu, H. Peng and H. Liu, Ind. Eng. Chem. Res., 2017, 56, 8264–8273 CrossRef CAS.
- C. Wang, Q. Zhang, Y. Chen, X. Zhang and F. Xu, ACS Sustainable Chem. Eng., 2018, 6, 3154–3161 CrossRef CAS.
- X. Kong, B. Zhang, Y. Hua, Y. Zhu, W. Li, D. Wang and J. Hong, Bioresour. Technol., 2019, 273, 220–230 CrossRef CAS PubMed.
- J. Du, Y. Cao, G. Liu, J. Zhao, X. Li and Y. Qu, Bioresour. Technol., 2017, 229, 88–95 CrossRef CAS PubMed.
- J. S. Kim, Y. Y. Lee and T. H. Kim, Bioresour. Technol., 2016, 199, 42–48 CrossRef CAS PubMed.
- K. Karimi, M. Shafiei and R. Kumar, in Biofuel Technologies, 2013, ch. 3, pp. 53–96, DOI:10.1007/978-3-642-34519-7_3.
- S. Sun, X. Cao, S. Sun, F. Xu, X. Song, R. C. Sun and G. L. Jones, Biotechnol. Biofuels, 2014, 7, 116 Search PubMed.
- A. von Schenck, N. Berglin and J. Uusitalo, Appl. Energy, 2013, 102, 229–240 CrossRef CAS.
- W. Gong, C. Liu, X. Mu, H. Du, D. Lv, B. Li and S. Han, ACS Sustainable Chem. Eng., 2015, 3, 3477–3485 CrossRef CAS.
- W. Geng, T. Huang, Y. Jin, J. Song, H. M. Chang and H. Jameel, Bioresour. Technol., 2014, 161, 63–68 CrossRef CAS PubMed.
- S. Sun, X. Cao, S. Sun, F. Xu, X. Song, R. C. Sun and G. L. Jones, Biotechnol. Biofuels, 2014, 7, 116 Search PubMed.
- X. Liu, S. M. Zicari, G. Liu, Y. Li and R. Zhang, Bioresour. Technol., 2015, 185, 150–157 CrossRef CAS PubMed.
- M. S. Jahan, F. Haris, M. M. Rahman, P. R. Samaddar and S. Sutradhar, Bioresour. Technol., 2016, 219, 445–450 CrossRef CAS PubMed.
- M. S. Jahana and Z. He, J. Bioresour. Bioprod., 2018, 3, 1–2 Search PubMed.
- E. Z. Hoşgün, D. Berikten, M. Kıvanç and B. Bozan, Fuel, 2017, 196, 280–287 CrossRef.
- A. A. Modenbach and S. E. Nokes, Biomass Bioenergy, 2013, 56, 526–544 CrossRef CAS.
- T. Y. Nguyen, C. M. Cai, R. Kumar and C. E. Wyman, Proc. Natl. Acad. Sci. U. S. A., 2017, 114, 11673–11678 CrossRef CAS PubMed.
- Y. Chen, B. Dong, W. Qin and D. Xiao, Bioresour. Technol., 2010, 101, 7005–7010 CrossRef PubMed.
- T. K. Ghose, Pure Appl. Chem., 1987, 59, 257–268 CAS.
- T. Y. Nguyen, C. M. Cai, O. Osman, R. Kumar and C. E. Wyman, Green Chem., 2016, 18, 1581–1589 RSC.
- A. Mohagheghi, M. Tucker, K. Grohmann and C. Wyman, Appl. Biochem. Biotechnol., 1992, 33, 67–81 CrossRef CAS.
- A. Sluiter, B. Hames, R. Ruiz, C. Scarlata, J. Sluiter, D. Templeton and D. Crocker, 2008.
- L. Segal, J. J. Creely, A. E. Martin and C. M. Conrad, Text. Res. J., 1959, 29, 786–794 CrossRef CAS.
- H. Xu, G. Yu, X. Mu, C. Zhang, P. DeRoussel, C. Liu, B. Li and H. Wang, Ind. Crops Prod., 2015, 76, 638–646 CrossRef CAS.
- Z. Guo, Z. Ling, C. Wang, X. Zhang and F. Xu, Bioresour. Technol., 2018, 265, 334–339 CrossRef CAS PubMed.
- C.-Z. Chen, M.-F. Li, Y.-Y. Wu and R.-C. Sun, Ind. Eng. Chem. Res., 2014, 53, 12935–12942 CrossRef CAS.
- L. Bu, Y. Xing, H. Yu, Y. Gao and J. Jiang, Biotechnol. Biofuels, 2012, 5, 87 CrossRef CAS PubMed.
- C. E. Wyman, C. M. Cai and R. Kumar, in Energy from Organic Materials (Biomass), 2019, ch. 521, pp. 997–1022, DOI:10.1007/978-1-4939-7813-7_521.
- J. B. Kristensen, C. Felby and H. Jorgensen, Biotechnol. Biofuels, 2009, 2, 11 CrossRef PubMed.
- Y. Tang, X. Shen, J. Zhang, D. Guo, F. Kong and N. Zhang, Carbohydr. Polym., 2015, 125, 360–366 CrossRef CAS PubMed.
- J. B. Lambert, H. F. Shurvell, D. A. Lighter and R. G. Cooks, Introduction to Organic Spectroscopy, Macmillan, NY, 1987, pp. 174–177 Search PubMed.
- B. Li, W. Xu, D. Kronlund, A. Maattanen, J. Liu, J. H. Smatt, J. Peltonen, S. Willfor, X. Mu and C. Xu, Carbohydr. Polym., 2015, 133, 605–612 CrossRef CAS PubMed.
- M. L. Nelson and R. T. O. Connor, J. Appl. Polym. Sci., 1964, 8, 1325–1341 CrossRef CAS.
- R. T. O'Connor, E. F. DuPré and D. Mitcham, Text. Res. J., 1958, 28, 382–392 CrossRef.
- H. Mou, B. Li and P. Fardim, Energy Fuels, 2014, 28, 4288–4293 CrossRef CAS.
- G. Wu, Y. Zhang, B. Yuan, C. Liu, G. Yu, C. Xie, B. Li and H. Peng, Cellulose, 2018, 26, 2087–2097 CrossRef.
Footnote |
| † Electronic supplementary information (ESI) available. See DOI: 10.1039/c9ra01555h |
| This journal is © The Royal Society of Chemistry 2019 |