
Aggregation-induced emission lights up the swelling process: a new technique for swelling characterisation of hydrogels†
Javad
Tavakoli
 a,
Hong-ping
Zhang
ab,
Ben Zhong
Tang
*c and
Youhong
Tang
*a
a,
Hong-ping
Zhang
ab,
Ben Zhong
Tang
*c and
Youhong
Tang
*a
aInstitute for NanoScale Science and Technology, Medical Device Research Institute, College of Science and Engineering, Flinders University, South Australia 5042, Australia. E-mail: youhong.tang@flinders.edu.au
bState Key Laboratory of Environmental Friendly Energy Materials, Engineering Research Center of Biomass Materials, Ministry of Education, School of Materials Science and Engineering, Southwest University of Science and Technology, Mianyang, Sichuan 621010, China
cDepartment of Chemistry, Hong Kong Branch of Chinese National Engineering Research Center for Tissue Restoration and Reconstruction and Institute for Advanced Study, The Hong Kong University of Science and Technology, Clear Water Bay, Kowloon, Hong Kong, China. E-mail: tangbenz@ust.hk
First published on 22nd February 2019
Abstract
The characterization of the swelling properties in hydrogels suffers uncertainty due to the limitations that occur during weight change measurement. The current study successfully employed an aggregation-induced emission approach to suggest a new technique for the measurement of swelling properties in hydrogels. The changes in the fluorescence properties of the swelling environment reflect the swelling process.
Hydrogels are crosslinked networks that maintain a distinct three-dimensional structure while absorbing large amounts of water. As the first biomaterial used in the human body, hydrogels provide unique properties that suggest a wide range of applications in various dimensions of engineering and medical fields.1 The first step towards the characterization of hydrogels for various applications is the measurement of their swelling properties, by which the water uptake ability of hydrogels will be identified over time. So far, the best method to report the swelling property of a hydrogel is to normalize the amount of water uptake to its initial weight, a term called the swelling ratio (SR) (eqn (1)), where, M0 and Mt are weights at the initial time and time t, respectively.2
 | (1) |
Upon the measurement of SR, researchers can estimate different structural parameters, including but not limited to the coefficient of diffusion,3 the rate of swelling and equilibrium SR,4 amount and rate of embedded pharmaceutics within the hydrogel network,5 porosity, and average molecular weights between crosslinks.6 Moreover, several physical7 (dimension stability, permeability, surface tension, etc.) and mechanical8 (stiffness, ultimate strength, extensibility and strain) properties of hydrogels are strongly influenced by their swelling properties.9
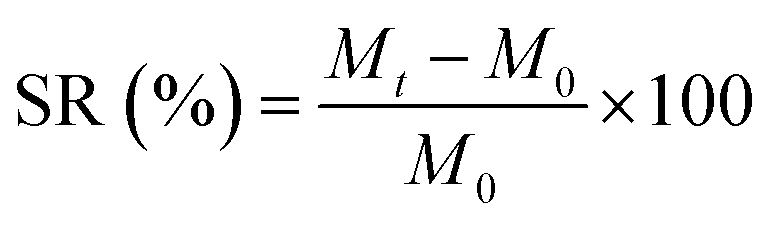
The frequently used traditional method for the measurement of SR is weight analysis, by which pre-weighed hydrogel samples are immersed in water and, at different time points, their weight change is measured after removal from water. Although this method is widely used, it is difficult to manage due to the invisibility of hydrogels during the swelling process (Fig. 1a). More importantly, SR measurement is too difficult to conduct for particular hydrogels such as superabsorbent particles (Fig. 1b), in which rapid uptake of a large amount of water is observed, or those with a delicate structure such as nanofibrous mats (Fig. 1c) and microparticles. Measuring the swelling properties of superabsorbent particles or nanofiber mats using a carrying device (i.e. tea bags) implies inaccuracy (Fig. 1d). Clearly, the traditional method suffers inadequate accuracy caused by human error (Fig. 1e and f), and the lack of consistency between in-house standards of different research centers makes the method less reliable. During progress to the final stage of the swelling process, where the equilibrium state is reached, the measurement of the swelling ratio is likely to be less accurate because low mechanical properties of highly swellable hydrogels can result in structural destruction during the weight measurement (Fig. 1f). Of particular interest, advanced approaches in hydrogel design that employ precise fabrication methods to control the hydrogel's swelling properties require a more efficient technique for SR measurement.10 To minimize the limitations and errors attributed to the traditional method, the current study employed an aggregation-induced emission (AIE) approach to suggest a new technique for the characterization of the swelling properties of hydrogels.
 | ||
| Fig. 1 Illustration of sources of error and difficulties during the characterization of the swelling properties of hydrogels using the traditional method: (a) invisibility of hydrogel in the swelling environment; difficulty of employing the method for (b) SAP particles and (c) fibrous mats; and sources of human error using (d) carrying device or (e and f) inconsistency between in-house standards and procedures. At late stages of measurement, when the equilibrium is reached, significant errors are seen. | ||
Recently, AIE-featuring luminogenic compounds (AIEgens) with high emission efficiency in the aggregated state,11 excellent photo-stability,12 and high sensitivity13 have been widely used for different biomedical applications.14 Tetraphenylethylene (TPE), a commercially available AIEgen used in this study, is partially miscible in water–tetrahydrofuran (water–THF) mixtures. Consistent with other reports, an increase in the volumetric fraction of water (WF) causes TPE to be aggregated, resulting in strong fluorescence (FL) properties (λem = 350 nm and λex = 470 nm).15 Observation of the change in relative FL intensity and concentration of TPE versus WF (Supplementary S1 and S2, ESI†) suggests a new approach for accurate measurement of the swelling process in hydrogels. To demonstrate this concept, a poly(acrylic acid) hydrogel (PAA) was used and its swelling properties were determined by both measurement of the changes in hydrogel weight (the traditional method) and the FL intensity of the swelling environment. The swelling environment was the water–THF mixture with WF = 90%; the initial concentration of the TPE in the swelling environment was kept constant across all measurements. During the swelling process, increase in the FL maxima was observed as a function of swelling time (Fig. 2a). Also, similar trends for change in the SR (Fig. 2b) of PAA hydrogel and the relative FL intensity of the swelling environment (Fig. 2c) were seen. The best fit to identify the relationship between the relative FL intensity and SR was exponential with R2 = 0.983 (as demonstrated by the inserted equation in Fig. 2d).
 | ||
| Fig. 2 Change in (a) fluorescent spectra, (b) relative intensity and (c) SR, and (d) the established relationship between the relative fluorescence intensity and the SR for a PAA (film) hydrogel during the swelling process in water–TPE/THF swelling media with water fraction = 90%. | ||
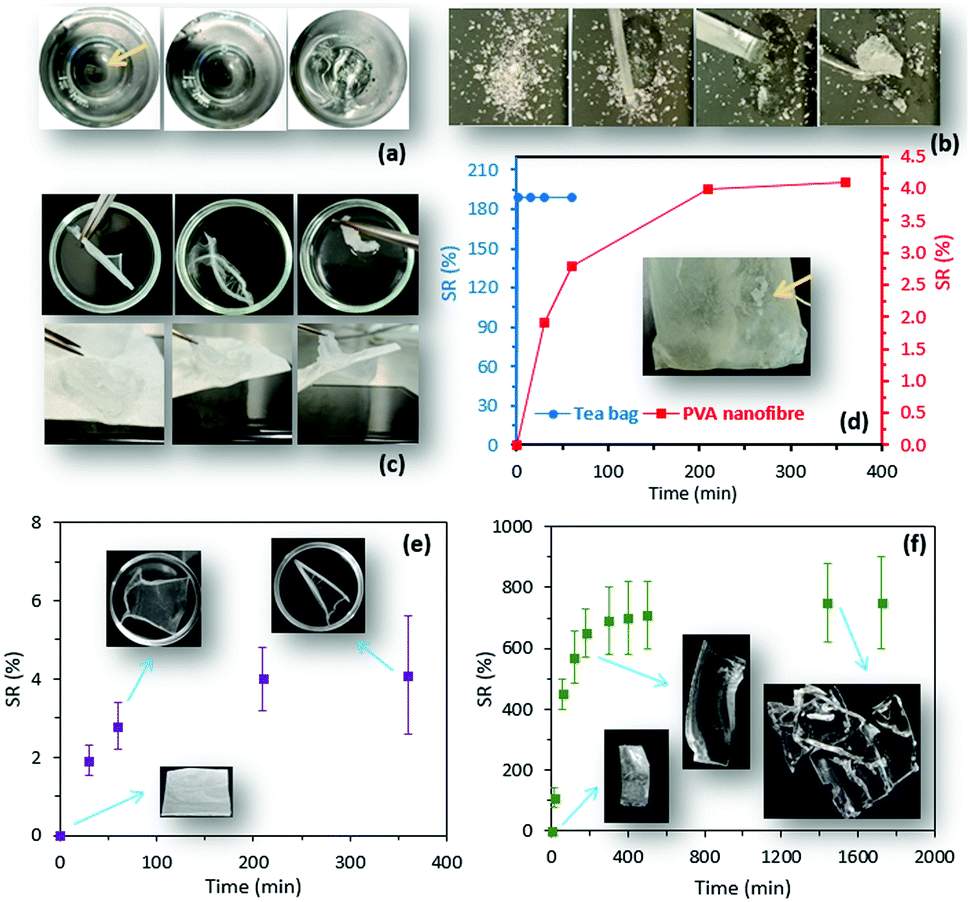
The FL stability over time (Supplementary S3, ESI†) and the change in the FL intensity of a rubber sample, as a non-swellable control (Supplementary S4, ESI†), were identified, revealing negligible changes in the FL intensity. The feasibility of the proposed method for measuring the SR using the FL spectra was further investigated by two common cases. The aim of the first case study was to identify whether the method was sensitive to different hydrogel types. Poly(vinyl alcohol) film (PVA) and fibrous mats were prepared using the solvent casting and electrospinning methods and PAA-partial sodium salt-g-poly(ethylene oxide) particles were purchased and served as a superabsorbent polymer (SAP). The relationship between the SR and relative FL intensity for the hydrogels was established using the aforementioned method. It was revealed that for all hydrogel types used in this study, the best fit to identify the relationship between the relative FL intensity and SR was exponential with R2 > 0.94 (Fig. 3a–c).
 | ||
| Fig. 3 The established relationship between SR and relative fluorescence intensity for (a) PVA film, (b) PVA mat, and (c) SAP particles using a water–TPE/THF mixture as the swelling environment. The change in relative fluorescence intensity versus time of swelling for (d) the PVA film exposed to 1 and 4 FT cycles to enhance the physical crosslinking (inset: change in SR after 6 h swelling) and (e) the PAA film with two different crosslinking densities (inset: the FL spectra for low and high crosslinked PAA hydrogel at different swelling time points). | ||
The aim of the second case study was to investigate the impact of crosslinking, which is a common approach for controlling the swelling properties in hydrogels. In this study, a PVA film (6% w/w) was exposed to 1 and 4 cycles of a freeze–thaw (FT) process to alter the degree of crystallinity (Supplementary S5, ESI†), hence controlling their swelling properties. Crystallization is a conventional technique to fabricate physically crosslinked PVA-based hydrogels with desirable mechanical16 and biological properties.17 Controlling the crystallization process results in fine-tuning of the structure and optimization of the final physico-mechanical and biological properties of hydrogels without the addition of a crosslinking agent.18 It can be found that the FL intensity for the PVA hydrogel that was exposed to 4 FT cycles was lower (10%) than that of the 1 FT PVA hydrogel (Fig. 3d). This observation was consistent with the results from the SR measurement identifying lower SR (40%) for the PVA hydrogel that was exposed to 4 FT cycles before swelling (Fig. 3d: inset). The DSC experiments were performed for the PVA samples that were exposed to 1 and 4 FT cycles at a scanning rate of 5 °C min−1 from 40 to 250 °C. The results obtained by the DSC analysis revealed that the degree of crystallinity increased by approximately 26% for 4 FT cycles compared to 1 FT cycle (the crystallinity percentages were 39.5% and 50.1% for the PVA film exposed to 1 and 4 FT cycles, respectively, Supplementary S5, ESI†). Moreover, increasing the concentration of the crosslinking agent by a factor of two during the preparation of the PAA hydrogel resulted in 68% decrease in the relative FL intensity after 1500 min (Fig. 3e).
Because the FL properties of TPE in a water–THF mixture depend strongly on WF, change in the relative intensity of the swelling environment during the swelling process was investigated using different WFs (90%, 96%, and 98%). Interestingly, the changes in the relative FL intensity of the swelling environments were similar to those of the TPE at different WFs (%). When the initial WF in the swelling environment was 90%, the FL intensity increased during the swelling process. For WF = 98%, however, a decrease in the relative FL intensity was observed over time (Supplementary S6–S10, ESI†). When the WF of 96% was chosen at the beginning of the swelling process, the relative FL intensity decreased as swelling continued, followed by an initial increase.
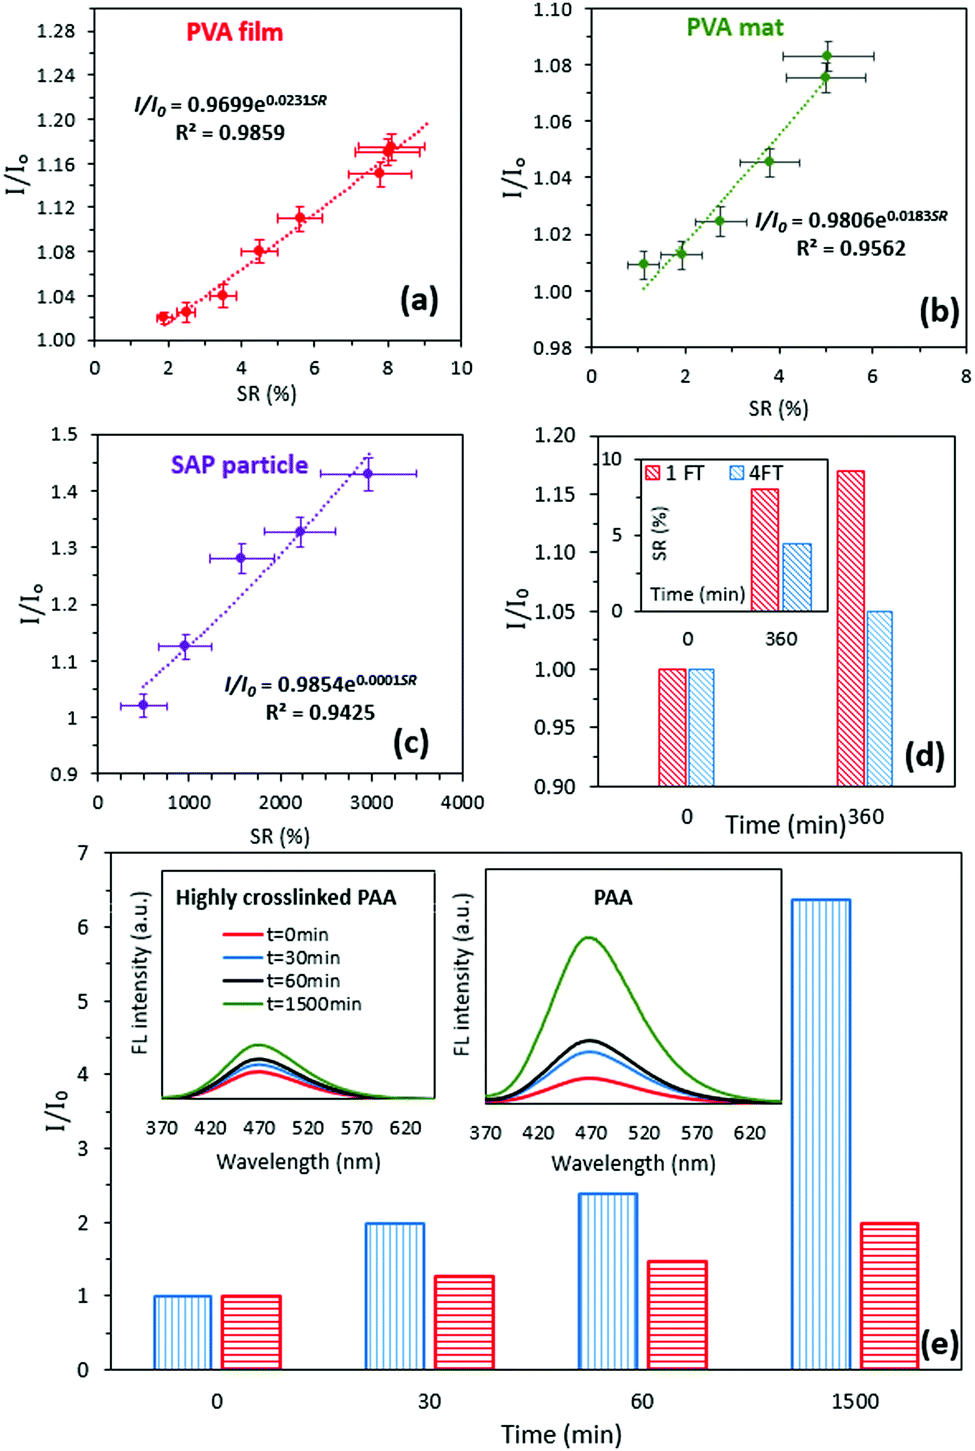
On the basis of our observations, the diffusion of TPE into the hydrogel structure during the swelling process, resulting in a decrease of TPE concentration in the swelling medium (an increase of WF), was the main reason for the changes in the FL properties of the swelling environment (Fig. 4a). This observation was supported by the captured images of a PAA hydrogel at different time points during the swelling process (WF = 80%) under UV light (365 nm). As the hydrogel swelled, the increased TPE concentration within the network resulted in the production of a blue color with increased intensity (Fig. 4b). During the swelling process of the hydrogel, the sink condition was achieved because both the concentration of TPE and the volume of THF were negligible compared to the total volume of the swelling environment (Supplementary S11, ESI†). This meant that the total volume of the swelling environment was maintained at about 5 times that of the THF. It was unlikely that the concentration of TPE had reached a saturation point within the hydrogel network when the diffusion process was stopped. Our further investigation showed that the addition of water (to the THF solution) controlled the swelling process (Fig. 4c). Hence, the amount of TPE (dissolved in THF) diffused into the hydrogel network depended on the amount of water that moved into the hydrogel. Our further investigation, in which the PAA film and PVA mat were placed into fresh swelling media (WF = 100%), revealed the release of TPE from both hydrogel networks over time (Fig. 4d).
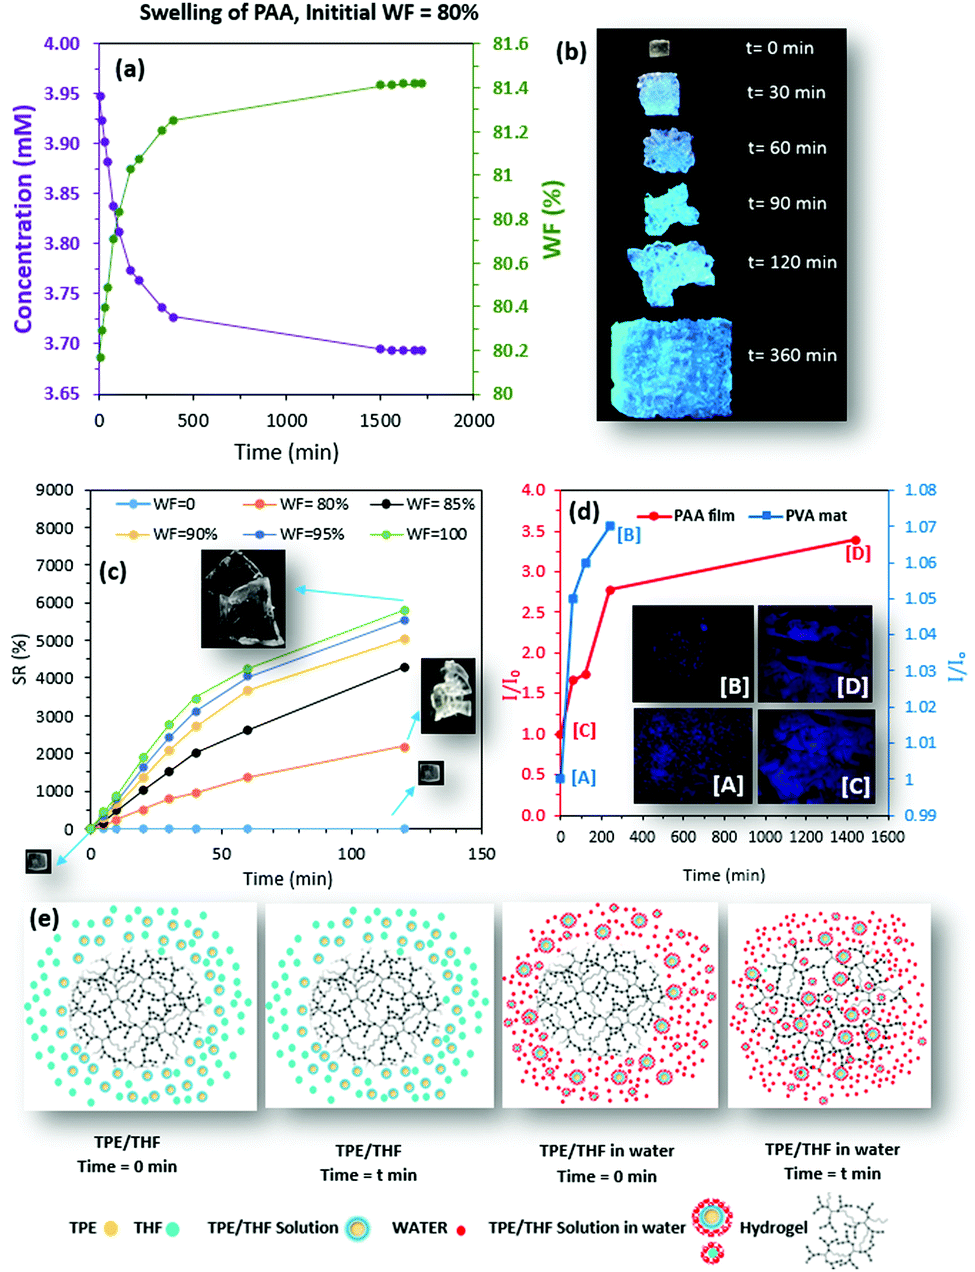 | ||
| Fig. 4 (a) The change in TPE concentration and water fraction in the swelling environment (WF = 80%) during the swelling of PAA film. (b) Captured images of swelled PAA at different time points under UV light (365 nm). (c) Change in SR versus time for PAA hydrogel at different water/THF ratios. (d) The release of TPE from the PAA film and PVA mat into fresh distilled water after reaching swelling equilibrium in the water–TPE/THF mixture (insets: fluorescent microscopy images at the beginning and end stages of the release test). (e) The proposed structurally based mechanism for diffusion of TPE into the hydrogel network resulting in an increase in water fraction in the swelling environment. | ||
The release of TPE into the swelling environment is further demonstrated by fluorescence images captured at the beginning of the release study (Fig. 4d, points [A] and [C]) and at t = 240 min and 24 h for the PVA mat (Fig. 4a, point [B]) and PAA (Fig. 4d, point [D]), respectively (Fig. 4d: insets).
The proposed mechanism (Fig. 4e) that was established based on our observations during the swelling of hydrogels and release of TPE, clearly explains that the swelling driven mechanism controls the rate of TPE diffusion into the hydrogel network. The diffusion of TPE within the hydrogel results in an increase in the WF in the environment, which leads to change in the FL intensity during the swelling process.
It shows that the proposed technique significantly enhanced the traditional method for swelling measurement in different hydrogels; however, there are some limitations to notice. First, the initial weight and size of the hydrogel should be carefully selected to avoid over-swelling. Over-swelling results in uptake of the entire swelling media and will affect the results. Also, while the proposed technique was reproducible for all hydrogels, it was unlikely to achieve similar results when the swelling is repeated with the same hydrogel. The source of error was the amount of TPE diffused into the hydrogel during the first swelling process. When approximately similar initial weights for structurally similar hydrogels were selected, the swelling results remained approximately unchanged.
Conclusions
This study identified a new methodology for the measurement of SR. To the best of our knowledge, the characterization of the swelling properties of hydrogels with delicate structures (fibres) or those with high swelling properties has been challenging for many years. Utilizing the proposed technique, the swelling characterization of these hydrogels can be performed accurately.Conflicts of interest
There are no conflicts to declare.Acknowledgements
JT and YT thank the joint China-Australia International Laboratory for Health Technologies (ILHT) for the financial support of this research.Notes and references
- M. Qin, M. Sun, R. Bai, Y. Mao, X. Qian, D. Sikka, Y. Zhao, H. J. Qi, Z. Suo and X. He, Adv. Mater., 2018, 30, 1800468 CrossRef CAS PubMed; N. A. Peppas, J. Z. Hilt, A. Khademhosseini and R. Langer, Adv. Mater., 2006, 18, 1345 CrossRef.
- N. Dehbari, J. Tavakoli, S. Khatrao and Y. Tang, Mater. Chem. Front., 2017, 1, 1995 RSC; F. Huang, X. Zhang and B. Z. Tang, Mater. Chem. Front., 2019, 3, 10 RSC.
- J. Li, Z. Su, X. Ma, H. Xu, Z. Shi, J. Yin and X. Jiang, Mater. Chem. Front., 2017, 1, 310 RSC.
- M. Kuang, D. Wang, H. Bao, M. Gao, H. Möhwald and M. Jiang, Adv. Mater., 2005, 17, 267 CrossRef CAS.
- X. Li, J. Han, X. Wang, C. Jia, J. Qin, C. Wang, J. Wu, W. Fang and Y. Yang, Mater. Chem. Front., 2019, 3, 103 RSC.
- J. Chen, Q. Lin, H. Yao, Y. Zhang and T. Wei, Mater. Chem. Front., 2018, 2, 999 RSC; Y. Osada and J. P. Gong, Adv. Mater., 1998, 10, 827 CrossRef CAS.
- Z. Zhang, C. He and X. Chen, Mater. Chem. Front., 2018, 2, 1765 RSC.
- D. G. Barrett, D. E. Fullenkamp, L. He, N. Holten-Andersen, K. Y. Lee and P. B. Messersmith, Adv. Funct. Mater., 2013, 23, 1111 CrossRef CAS PubMed.
- J. Tavakoli and Y. Tang, Mater. Sci. Eng., C, 2017, 77, 318 CrossRef CAS PubMed; K. Haraguchi and T. Takehisa, Adv. Mater., 2002, 14, 1120 CrossRef.
- R. Liang, Z. Li, L. Weng, L. Zahng and G. Sun, Mater. Chem. Front., 2018, 2, 2076 RSC.
- J. Mei, Y. Hong, J. W. Lam, A. Qin, Y. Tang and B. Z. Tang, Adv. Mater., 2014, 26, 5429 CrossRef CAS PubMed; C. Wang and Z. Li, Mater. Chem. Front., 2017, 1, 2174 RSC; Q. Li and Z. Li, Adv. Sci., 2017, 4, 1600484 CrossRef PubMed.
- F. Guo, W.-P. Gai, Y. Hong, B. Z. Tang, J. Qin and Y. Tang, Chem. Commun., 2015, 51, 17257 RSC; L. Feng, C. Wang, X. Deng, X. Miao, J. Wang, Y. Wang and Z. Li, Mater. Chem. Front., 2018, 2, 264 RSC.
- C. W. T. Leung, F. Guo, Y. Hong, E. Zhao, R. T. K. Kwok, N. L. C. Leung, S. Chen, N. N. Vaikath, O. M. El-Agnaf, Y. Tang, W.-P. Gai and B. Z. Tang, Chem. Commun., 2015, 51, 1866 RSC; P. Minei, M. Koenig, A. Battisti, M. Ahmad, V. Barone, T. Torres, D. M. Guldi, G. Brancato, G. Bottari and A. Pucci, J. Mater. Chem. C, 2014, 2, 9224 RSC.
- Y. Liu, Y. Tang, N. N. Barashkov, I. S. Irgibaeva, J. W. Lam, R. Hu, D. Birimzhanova, Y. Yu and B. Z. Tang, J. Am. Chem. Soc., 2010, 132, 13951 CrossRef CAS PubMed.
- Y. Liu, C. Mu, K. Jiang, J. Zhao, Y. Li, L. Zhang, Z. Li, J. Y. L. Lai, H. Hu, T. Ma, R. Hu, D. Yu, X. Huang, B. Z. Tang and H. Yan, Adv. Mater., 2015, 27, 1015 CrossRef CAS PubMed; Z. Li, Y. Dong, B. Mi, Y. Tang, M. Häussler, H. Tong, Y. Dong, J. W. Y. Lam, Y. Ren, H. H. Y. Sung, K. S. Wong, P. Gao, I. D. Williams, H. S. Kwok and B. Z. Tang, J. Phys. Chem. B, 2005, 109, 10061 CrossRef PubMed; M. Fang, J. Yang, X. Xiang, Y. Xie, Y. Dong, Q. Peng, Q. Li and Z. Li, Mater. Chem. Front., 2018, 2, 2124 RSC.
- M. S. Shaffer and A. H. Windle, Adv. Mater., 1999, 11, 937 CrossRef CAS.
- L. Dai and A. W. Mau, Adv. Mater., 2001, 13, 899 CrossRef CAS; C. Zheng, Q. Zang, H. Nei, W. Huang, Z. Zhao, A. Qin, R. Hu and B. Z. Tang, Mater. Chem. Front., 2018, 2, 180 RSC.
- X. Tang and S. Alavi, Carbohydr. Polym., 2011, 85, 7 CrossRef CAS; G. Liang, L. Weng, J. W. Y. Lam, W. Qin and B. Z. Tang, ACS Macro Lett., 2014, 3, 21 CrossRef.
Footnote |
| † Electronic supplementary information (ESI) available. See DOI: 10.1039/c9qm00054b |
| This journal is © the Partner Organisations 2019 |