Insights into defective TiO2 in electrocatalytic N2 reduction: combining theoretical and experimental studies†
Li
Yang‡
a,
Tongwei
Wu‡
a,
Rong
Zhang
a,
Huang
Zhou
b,
Li
Xia
a,
Xifeng
Shi
c,
Hongguo
Zheng
d,
Yanning
Zhang
 *a and
Xuping
Sun
 *a
*a
aInstitute of Fundamental and Frontier Sciences, University of Electronic Science and Technology of China, Chengdu 610054, Sichuan, China. E-mail: xpsun@ uestc.edu.cn; yanningz@uestc.edu.cn
bCollege of Chemistry and Chemical Engineering, Chongqing University, Chongqing 400030, China
cCollege of Chemistry, Chemical Engineering and Materials Science, Shandong Normal University, Jinan 250014, Shandong, China
dThermoFisher Scientific, Chengdu 610023, Sichuan, China
First published on 2nd January 2019
Abstract
Artificial N2 fixation via the Haber–Bosch process requires high temperature and high pressure at the expense of CO2 release. Electrochemical NH3 synthesis is emerging as an environmentally friendly alternative that operates under ambient conditions, calling for electrocatalysts with efficient N2 reduction reaction (NRR) performance. In this paper, we experimentally and theoretically prove that defective TiO2 on Ti mesh (d-TiO2/TM) acts as an electrocatalyst for the NRR. In 0.1 M HCl, d-TiO2/TM achieves a much higher NH3 yield of 1.24 × 10⁻¹⁰ mol s−1 cm−2 and FE of 9.17% at −0.15 V (versus reversible hydrogen electrode) than pristine TiO2 (NH3 yield: 0.17 × 10⁻¹⁰ mol s−1 cm−2; FE: 0.95%). Notably, d-TiO2/TM also shows great electrochemical stability and durability. Theoretical investigation further reveals the possible catalytic mechanism involved.
Introduction
As one of the most important chemicals for human beings, NH3 is a basis for fertilizers and a promising hydrogen storage material.1–3 The synthesis of NH3 from atmospherically abundant N2 causes a profound effect on modern agricultural development.4 However, it remains a challenge to convert N2 into NH3 for N2 is non-polar and chemically inert.5 The century-old Haber–Bosch process is still a leader in NH3 manufacture and production, in which N2 and H2 react over iron-based catalysts at high temperatures and pressures.6,7 Handicapped by the massive scale of energy consumption and CO2 emission for H2 production, an energy-efficient and ecologically friendly substitute for sustainable NH3 synthesis under ambient conditions is highly desirable.Powered by renewable energy sources, electrocatalytic reduction offers a feasible and green process for N2 fixation under ambient conditions.8,9 Efforts focus mainly on screening electrocatalysts which can activate dinitrogen with alleviated activation barriers for an efficient N2 reduction reaction (NRR).10,11 Previously reported noble metal (Au,12,13 Ag,14 Ru,15 and Rh15,16)-based catalysts show high NRR activity, but the relatively high manufacturing cost hinders their widespread use. Much attention has thus centered on non-noble-metal catalysts (Fe2O3-CNT,10 Fe3O4/Ti,17 PEBCD/C,18 MoS2/CC,19 (110)-oriented Mo nanofilm,20 VN,21 and doped carbon22,23) for efficient NRR electrocatalysis. However, most of these catalysts suffer from unsatisfactory faradaic efficiency (FE) for NH3 formation (Fe2O3–CNT: 0.15%; Fe3O4/Ti: 2.6%; MoS2/CC: 0.096%; (110)-oriented Mo nanofilm: 0.72%; MoO3: 1.9%; MoN: 1.15%; VN: 2.25%; N-doped carbon: 1.42%). Drawing inspiration from amorphization which induces new defective sites to promote catalytic activity, Yu and co-workers recently reported a hybrid nanofiber of amorphous Bi4V2O11 and CeO2 for N2 reduction electrocatalysis with a high FE of 10.16%.24
It is well established that oxygen vacancies (Vos) make great contribution in manipulating the electronic properties of metal oxides in different electrochemical energy conversion and storage systems.25–28 As Vos can trap electrons in the metastable state, electrons may be injected into an antibonding orbital of adsorbed N2, which thereby weakens the N![[triple bond, length as m-dash]](https://www.rsc.org/images/entities/char_e002.gif) N triple bond for subsequent activation.29,30 This thus provides an intriguing picture for constructing a Vos-catalyst for N2 adsorption under aqueous conditions, which has been scarcely reported before.24
N triple bond for subsequent activation.29,30 This thus provides an intriguing picture for constructing a Vos-catalyst for N2 adsorption under aqueous conditions, which has been scarcely reported before.24
Our recent study shows that TiO2-reduced graphene oxide nanohybrids manifest an efficient NRR performance with a FE of 3.3% in 0.1 M Na2SO4.31 Our another study demonstrates that TiO2 nanosheet arrays also operate efficiently with a FE of 2.50% at neutral pH, and the Vosin situ generated during the electrochemical test favours enhanced adsorption and activation of N2.32 However, both the NRR application of the TiO2 catalyst in acidic electrolytes and the catalytic mechanism involved still remain unexplored. Herein, we report that defective TiO2 on Ti mesh (d-TiO2/TM) acts as a NRR electrocatalyst for ambient N2-to-NH3 fixation under acidic conditions, in conjunction with experimental studies and density functional theory (DFT) calculations. After the introduction of defects in pristine TiO2 (p-TiO2), the NH3 yield significantly increases from 0.17 × 10⁻¹⁰ mol s−1 cm−2 to 1.24 × 10⁻¹⁰ mol s−1 cm−2 with an enhanced FE from 0.95% to 9.17% at −0.15 V (versus reversible hydrogen electrode) in 0.1 M HCl. Notably, p-TiO2 also shows great electrochemical stability and durability. These findings provide new insights into the rational design of highly active catalysts with defects toward efficient, stable, and sustainable N2 fixation under ambient conditions.
Results and discussion
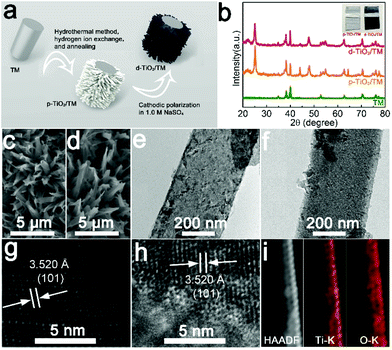
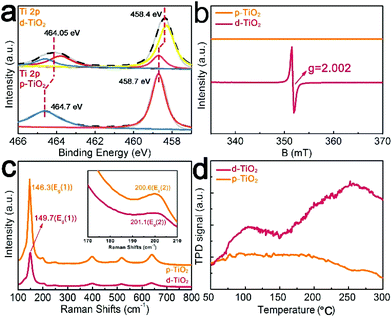
d-TiO2/TM was derived from the cathodic electrochemical polarization of p-TiO2/TM at −1.8 V (vs. Ag/AgCl), and Fig. 1a illustrates the fabrication of d-TiO2/TM. Fig. 1b shows the X-ray diffraction (XRD) patterns of bare TM, p-TiO2/TM and d-TiO2/TM. Except for the peaks of TM (JCPDF No. 44-1294), all other peaks of p-TiO2/TM and d-TiO2/TM can be indexed to anatase TiO2 (JCPDF No. 21-1272).33 And the decrease of the intensity of the XRD pattern for d-TiO2/TM in Fig. 1b may reflect the decrease of crystallinity. Interestingly, the colour grade changed gradually from white (p-TiO2) to blue-black (d-TiO2) (inset of Fig. 1b). The scanning electron microscopy (SEM) image in Fig. 1c displays that the p-TiO2 array is directly grown on TM with a single nanobelt diameter of ∼300 nm (Fig. 1e). Following cathodic polarization, the resulting d-TiO2 still maintains its initial morphology (Fig. 1d and f). The clear lattice with an interplanar distance of 3.520 Å on the high-resolution transmission electron microscopy (HRTEM) image (Fig. 1g) corresponds to the (101) plane. However, the lattice becomes blurred after polarization (Fig. 1h), indicating a distortion in the atomic lattice structures of d-TiO2. The energy-dispersive X-ray (EDX) spectrum (Fig. S1†), the high-angle annular dark-field scanning TEM (HAADF-STEM) image and the corresponding energy dispersive X-ray (EDX) elemental mapping images for d-TiO2 (Fig. 1i) clearly confirm the existence and homogeneous distribution of Ti and O elements.X-ray photoelectron spectroscopy (XPS) is a surface sensitive characterization method. In Fig. 2a, the XPS spectrum in the Ti 2p region for p-TiO2 shows two peaks at binding energies (BEs) of 458.7 and 464.7 eV, assignable to 2p3/2 and 2p1/2 of Ti4+, respectively.34 In comparison, Ti 2p for d-TiO2 shows an evident shift towards lower energy, suggesting that electrons are obtained from deficient oxygen atoms.35 And two extra peaks at BEs of 458.2 eV and 463.5 eV for Ti 2p3/2 and Ti 2p1/2 are observed in d-TiO2, respectively, indicating the presence of Ti3+.35 The existence of Ti3+ in d-TiO2 indicates that the Vos are generated to maintain electrostatic balance.36
Based on the ultraviolet–visible (UV-Vis) absorption spectra of p-TiO2 and d-TiO2 (Fig. S2a†), we plot the transformed Kubelka–Munk function against the light energy for both samples (Fig. S2b†). The band gap of p-TiO2 is determined as 3.22 eV by extrapolating the linear fitting, consistent with the reported value of 3.20 eV.37,38 The extrapolated edge of the visible light absorption of d-TiO2 is 2.45 eV, which is actually controlled by the formation of Ti3+ defects from the charge imbalance bandgap.39 In the room-temperature electron spin resonance (ESR) spectrum of d-TiO2 after cathodic polarization (Fig. 2b) a definite VO signal (g = 2.002, ν = 9.8547 GHz) emerges in the wake of Ti3+ centers.40 A faint blueshift and broadening of Eg(1) and Eg(2) Raman vibrational modes41 of the d-TiO2 sample (Fig. 2c) further indicate increased surface disorder ascribed to the introduced Vos.42 Temperature-programmed desorption (TPD) measurements were performed to comprehend N2 adsorption on the p-TiO2 or d-TiO2 surface (Fig. 2d). d-TiO2 shows two strong peaks at around 100 °C assigned to the physical adsorption and 250 °C corresponding to the chemisorption of N2. However, no chemisorption of N2 is observed on p-TiO2, suggesting the enhanced absorption of N2 for this defect-engineered catalyst.
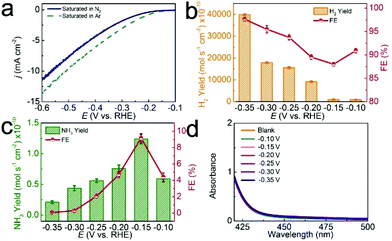
The NRR process involves the charge transfer of electrons for one N2 molecule and the reaction of protons with N2.43 In the electrocatalytic process, N2 gas was continually supplied in a feed stream to the cathode chamber, where N2 reacts with protons (H+ ions from pH = 1 HCl aqueous solution) on the surface of the d-TiO2/TM cathode to form NH3. All of the potentials are reported on a RHE scale except those specifically explained. The produced H2 is determined by the gas chromatographic method. The produced NH3 and N2H4 are measured according to previous reports.44,45 Fig. S3 and S4† show the corresponding calibration curves. In this study, we firstly measure the linear sweep voltammetry (LSV) of d-TiO2/TM in Ar- or N2-saturated 0.1 M HCl aqueous solution to probe the electrocatalytic performance (Fig. 3a). When the potential is more negative than −0.10 V, the current density of d-TiO2/TM under Ar increases obviously compared with that under N2, indicating the possibility of suppression of the hydrogen evolution reaction (HER) in the N2-saturated electrolyte. In order to prove this, we calculated the H2 yields and FEs in Ar- or N2-saturated 0.1 M HCl. Constant potential electrolysis was conducted by applying potentials in the range of −0.10 V to −0.35 V, as demonstrated by the chronoamperometric data in Fig. S5.† The corresponding UV–vis absorption spectra are shown in Fig. S6.†
Compared with H2 yields and FEs in Ar-saturated electrolytes (Fig. S7†), both of the H2 yields and FEs obviously decrease under N2 at each given potential (Fig. 3b), indicating the suppression of the HER in N2-saturated electrolytes. As shown in Fig. 3c, the highest NH3 yield of 1.24 × 10⁻¹⁰ mol s−1 cm−2 and FE of 9.17% are achieved at −0.15 V. Beyond the potential of −0.15 V, both the NH3 yields and FEs decline gradually, attributed to the enhancement of FEs for the HER (Fig. 3b). We also used ion chromatography, a well-established technique for ion analysis, to determine the NH3 contents. Fig. S8† shows the corresponding data, suggesting that the NH3 yields determined by both techniques are comparable. N2H4 was not detected in this study, demonstrating the good selectivity of this catalyst for NH3 formation (Fig. 3d). Note that d-TiO2/TM also shows higher NH3 yields and FEs than most reported catalysts under ambient conditions (Table S1†).
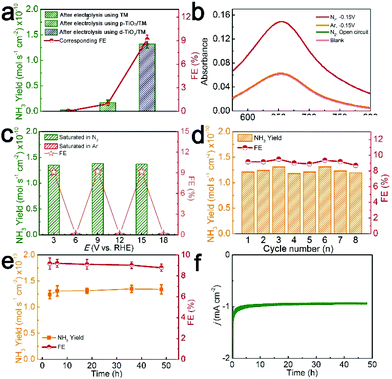
In control experiments, bare TM almost shows no activity for the NRR, and p-TiO2/TM exhibits inferior activity (NH3 yield: 0.17 × 10⁻¹⁰ mol s−1 cm−2; FE: 0.95%) (Fig. 4a), indicating the significant importance of Vos in d-TiO2/TM in promoting the NRR process. Moreover, the UV-Vis adsorption spectra of the electrolyte after electrolysis in Ar at −0.15 V or in N2 at open circuit potential show that no NH3 was examined (Fig. 4b). After electrolysis with alternating 3 h cycles between N2- and Ar-saturated 0.1 M HCl for a total of 18 h at −0.15 V (Fig. S9†), NH3 was only obtained in the periods of the N2-saturated electrolyte (Fig. 4c). The 15N isotopic labeling experiment was further conducted to certify the origin of N in the generated NH3. As shown in Fig. S10,† no response signal was detected after electrolysis under an Ar atmosphere, a doublet coupling in the 1H nuclear magnetic resonance (1H NMR) spectrum was observed in the system after electrolysis in 15N2. Only 15NH4+ was observed in the electrolyte after electrolysis in the 15N2 bubbled cathode chamber only.46 All the above results confirm that no contaminant N appears in our standard experiments and the N source of the produced NH3 in the electrolyte originates from N2. As shown in Fig. 4d, the NH3 yield and FE are almost constant in the cycling tests, confirming that the detection of NH3 is repeatable.
Additionally, it is noticeable that another crucial factor to evaluate NRR performance is the durability under long-term electrolysis. The electrocatalysis time dependence of NH3 yields and FEs is stable with increased electrolysis time (Fig. S11,†Fig. 4e). The d-TiO2/TM also maintains its electrolysis activity at −0.15 V for at least 48 h (Fig. 4f). Note that such d-TiO2/TM still retains its nanoarray feature after the stability test with the increased surface disorder of TiO2 (Fig. S12†). It is worth mentioning that p-TiO2/TM is also active for the NRR (Fig. S13†) and constant potential electrolysis was conducted by applying potentials in the range of −0.10 V to −0.35 V (Fig S13a and b†). When the potentials were more negative, at −0.25 V, the highest NH3 yield of 0.53 × 10⁻¹¹ mol s−1 cm−2 and FE of 0.6% are achieved (Fig. S13c and d†).
We also prepared different d-TiO2/TM derived from cathodic polarization under other potentials: −1.2 V, −1.4 V, −1.6 V, and −2.0 V (vs. Ag/AgCl), as shown in Fig. S14–S17.† The electrocatalytic NRR performance of these catalysts was evaluated at −0.15 V (Fig. S18†). As observed, the optimum cathodic polarization potential is determined as −1.8 V (vs. Ag/AgCl) considering the highest NH3 yields and FEs (Fig. S18a†), which may be assigned to the competition between the NRR and HER (Fig. S18b†).
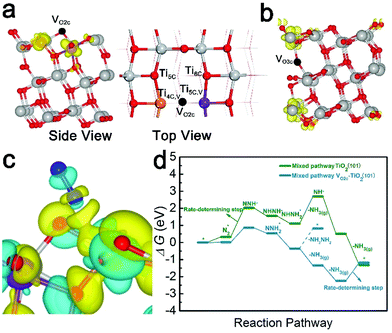
The (101) surface has the lowest energy and is the most frequently exposed surface of anatase TiO2.47,48 Thus, for a deeper understanding of the NRR reaction mechanism on the d-TiO2 surface at an atomic scale, we carried out extensive DFT calculations on the active sites, the corresponding electronic properties and the free energy changes on the d-TiO2(101) surface. The adsorption sites and energies of N2 on TiO2(101) with both topmost surface (VO2c–TiO2(101)) and subsurface (VO3c–TiO2(101)) oxygen vacancies are investigated (Fig. 5a and b). The calculated adsorption energies of N2 adsorption in the two positions are −0.576 and −0.352 eV, respectively. We can see that the N2 adsorption and activation, which is written as N2(g) → N2* with the asterisk * representing an adsorption site, should be energetically preferred on the VO2c–TiO2(101) surface. The adsorption of N2 on TiO2(101) with VO on the topmost surface (VO2c–TiO2(101)) is located in between the four- and five-coordinated Ti atoms (denoted as Ti4C,VO2c and Ti5C,VO2c, respectively) adjacent to the vacancy site but tilted to the Ti4C,VO2c site with a N–Ti bond length of 2.33 Å (Fig. 5a). The calculated electron density difference in Fig. 5c also shows the strong electron accumulations between N2 and the Ti4C,VO2c atom, indicating that the Ti4C,VO2c site most likely serves as the active site for the following NRR process. Hydrogenation of N2 is then carried out by adding H atoms one by one to the adsorbed species with a distal or alternating mechanism (see Fig. S19† for details). It was found that the NRR process on the VO2c–TiO2(101) surface is highly possible to be carried out through a mixed pathway, as shown in Fig. 5d.
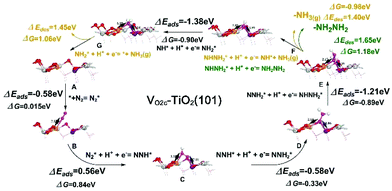
Fig. 6 shows the corresponding atomic configurations of the mixed pathway. Strikingly, we can see that the free energy of N2 (ΔG(N2*)) on the VO2c–TiO2(101) surface is only 0.015 eV, implying a high NRR reactivity. The hydrogenation of NNH2* forms NHNH2* with a negative ΔG of −0.89 eV and the first release of NH3(g) comes from the hydrogenation of NHNH2* with a further decrease of ΔG by −0.98 eV. Indeed, the NH2NH2 molecule is difficult to produce at room temperature in experiments due to the big positive ΔG of NHNH2* → NH2NH2 (1.18 eV). The NRR rate determining step comes from the desorption of the second NH3 gas which may occur more easily at higher temperatures. The NRR process on the p-TiO2(101) surface (TiO2(101)) also prefers a mixed pathway as shown in the green lines in Fig. 5d and atom configurations in Fig. S19.† We can see that the value of ΔG(N2*) is 20 times higher than that on the VO2c–TiO2(101) surface, indicating the low catalytic activity of the TiO2(101) surface. The hydrogenation of the first N atom needs a large ΔG(NNH*) of 1.71 eV, a value that is almost twice the corresponding value on VO2c–TiO2(101), decreasing greatly the NRR rate. The desorption of the first NH3 gas also requires a higher positive ΔG of 1.58 eV (see Fig. S20† for details).
The HER on the VO2c–TiO2(101) surface is considered because the NRR and HER are competitive reactions under reduction conditions. A large number of research studies have indicated that a single H atom adsorbs preferentially on the top of the bridging 2-fold coordinated oxygen atom (O2c) on TiO2(101).49 The relevant active-site ΔGH* results are displayed in Fig. 7a and the insets depict the H adsorption configurations. The comparative examination reveals that the Ti4C,VO2c active site has a very small ΔG(H*) of 0.011 eV, indicating a good HER performance compared with the Ti5C,VO2c site on VO2c–TiO2(101) and the O2c site on the perfect TiO2(101) surface. However, the very close values of ΔG(H*) and ΔG(N2*) on the Ti4C,VO2c active site may cause the competition between the HER and NRR processes. Overall, DFT calculations show that the perfect TiO2(101) exhibits low NRR performance, in good agreement with our experiment. However, the very close free energy values of ΔG(H*) and ΔG(N2*) on the Ti4C,VO2c active site (0.011 eV vs. 0.015 eV) may cause the competition between the HER and NRR processes.
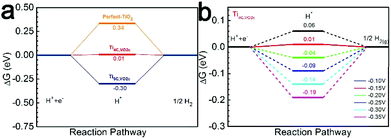 | ||
| Fig. 7 (a) Free energy diagrams for the HER process on VO2c–TiO2(101) and TiO2(101). (b) Free energy diagrams for the HER process on Ti4C,VO2c at various U values. | ||
We have also further discussed why the highest yield of NH3 is at U = −0.15 V. The calculation results showed that when the U electrode potential is less than −0.15 V the ΔG(H*) is always a negative value, as shown in Fig. 7b, indicating that the active site (Ti4C,VO2c) prefers to adsorb the H atom with a negative ΔG(H*) rather than the N2 molecule with a positive ΔG(N2*). As U = –0.15 V, the ΔG(H*) should shift to a positive value of 0.01 eV on the Ti4C,VO2c site (Fig. 7a), implying that the adsorption of the H* intermediate is suppressed. The U electrode potential with −0.10 V is too low so that the hydrogenation of N2* is weakened. Therefore, we suggested that the NRR efficiency is maximum at U = −0.15 V.
Experimental
Materials
Hydrazine hydrate (N2H4·H2O), hydrochloric acid (HCl), ethyl alcohol (C2H5OH), and sodium hydroxide (NaOH) were purchased from Chengdu Kelong Chemical Regent Co. Ltd (China). Sodium salicylate (C7H5O3Na), ammonium chloride (NH4Cl), p-dimethylaminobenzaldehyde (p-C9H11NO), sodium nitroferricyanide dihydrate (C5FeN6Na2O·2H2O) and sodium hypochlorite solution (NaClO) were purchased from Beijing Chemical Corp. (China). TM was purchased from a Hangxu filter flagship store, treated with concentrated HCl, and then cleaned by sonication sequentially in acetone, H2O and C2H5OH several times to remove the surface impurities. The water used throughout all experiments was purified using a Millipore system.Preparation of p-TiO2/TM and d-TiO2/TM
p-TiO2 was grown on a TM substrate using a hydrothermal method. Typically, a piece of clean TM (2 cm × 3 cm) was steeped into a 40 mL aqueous solution including 5 M NaOH in a 50 mL Teflon-lined stainless steel autoclave. The autoclave was enclosed and transferred into the oven for 24 h at 200 °C. The resulting precursor was then immersed in a dilute HCl solution (0.5 M) for 1 h to replace Na+ with H+ since the autoclave was chilled to room temperature. Subsequently, the product was repetitively cleaned with deionized water and then annealed for 3 h at 350 °C to form crystallized p-TiO2/TM. Finally, the resulting p-TiO2/TM was then adopted as a working electrode in a three-electrode setup and cathodically polarized (−1.8 V vs. Ag/AgCl, 5 min) in 1.0 M Na2SO4 at room temperature to obtain d-TiO2/TM.Characterization studies
XRD patterns were obtained with a Shimadzu XRD-6100 diffractometer accompanied by Cu Kα radiation (40 kV, 30 mA) with a wavelength of 0.154 nm (Japan). SEM images were acquired with a tungsten lamp-equipped SU3500 scanning electron microscope at an accelerating voltage of 20 kV (HITACHI, Japan). TEM images, HRTEM images, STEM images and the corresponding EDX elemental mapping images were obtained with a Zeiss Libra 200FE transmission electron microscope operated at 200 kV. XPS measurements were performed on an ESCALABMK II X-ray photoelectron spectrometer in which the Mg element was used as the exciting source. The absorbance data were measured with a Shimadzu UV-1800 UV-Vis spectrophotometer. A JASCO V-550 UV-Vis diffuse reflectance spectrophotometer was used to record the optical absorption spectra of the samples in the region of 300–800 nm. Raman spectroscopy (DXR Raman microscope with a 532 nm excitation laser, ThermoFisher Scientific, Waltham, MA, USA) was employed for chemical state analysis. GC analysis was conducted on a GC-2014C system (Shimadzu Co.) with a thermal conductivity detector. Pressure data were obtained by using a CEM DT-8890 Differential Air Pressure Gauge Manometer Data Logger Meter Tester. The ion chromatography method was conducted by using a ThermoFisher ICS 5000 plus ion chromatograph, containing a dual temperature heater, injection valve, conductivity detector, and AERS 500 anion suppressor.Electrocatalytic N2 reduction measurements
Before the NRR test, a protonated Nafion membrane was obtained from the order of 1 h in boiling water, 1 h in H2O2, 2 h in water, 3 h in 0.5 M H2SO4, and 6 h in water, which were maintained at 80 °C.50 Electrochemical testing of the working electrode was performed with a CHI 660E electrochemical analyzer (CH Instruments, Inc., Shanghai) using a standard three-electrode system (with a reference saturated Ag/AgCl (saturated KCl electrolyte) electrode and a counter graphite rod electrode) at room temperature (∼25 °C). Before data collection, the working electrode was stabilized with a steady-state electrochemical experiment. The electrolyte was ventilated by using N2 for 0.5 h before N2 reduction experiments. Constant potential electrolysis was performed with a two-compartment cell (each cell contains 35 mL HCl solution corresponding to pH = 1, separated by a Nafion membrane). Pure N2 gas was injected into the cathodic compartment around the clock.Determination of NH3
The produced NH3 concentration was confirmed by the indophenol blue method with a spectrophotometer in 0.1 M HCl. As for the calibration curve, 2 mL standard NH4Cl solutions in 0.1 M HCl of various concentrations (0.0, 0.1, 0.3, 0.5, 1.0, 2.0, 3.5 and 5.0 μg mL−1) were considered, and then 2 mL oxidizing solution (1.0 M NaOH solution containing C7H6O3 and 5 wt% C6H5Na3O7·2H2O), 1 mL oxidizing solution (0.05 M NaClO) and 0.2 mL catalyst solution (1 wt% Na2[Fe(NO)(CN)5]·2H2O) were mixed in order. The mixtures were tested with a UV-Vis spectrophotometer at 655 nm and then the standard curve was obtained after 2 h at room temperature. The calibration curve (Y = 0.160X + 0.067, R2 = 0.9999) showed a good linear relationship between the absorbance value and NH4Cl concentration by independent calibrations three times.Determination of N2H4
The N2H4 content in 0.1 M HCl after electrolysis was detected by the Watt and Chrisp method. p-C9H11NO (5.99 g), HCI (concentrated, 30 mL) and C2H5OH (300 mL) were mixed to obtain a color reagent. As for the calibration curve, 5 mL standard N2H4 solutions with various concentrations (0.0, 0.2, 0.4, 0.8, 1.2, 1.6 and 2.0 μg mL−1) were considered, and then mixed with 5 mL of the above prepared color reagent. Subsequently, the mixtures were tested with a UV-Vis spectrophotometer at 455 nm after 10 min at room temperature and then the standard curve of N2H4 was obtained. After three time independent calibrations, the calibration curve shows a good linear relationship (Y = 0.419X + 0.055, R2 = 0.9995).Calculations of H2 formation and faradaic efficiency
The produced gas was confirmed by gas chromatography (GC) analysis and clearly quantified with a calibrated pressure sensor. The FE was calculated by comparing the amount of the measured H2 generated by potentiostatic electrolysis with calculated H2 (assuming 100% FE).Calculations of the NH3 formation rate and faradaic efficiency
The yield and FE of NH3 were calculated as follows:| NH3 yield = ([NH4Cl]/53.5) × V × 10−6/(t × A) | (1) |
| FE = 3 × F × ([NH4Cl]/53.5) × V/Q | (2) |
Calculation details
Spin-polarized density functional theory (DFT) calculations were performed by using the plane wave-based Vienna ab initio simulation package (VASP).51,52 The generalized gradient approximation method with the Perdew–Burke–Ernzerhof (PBE) functional was used to describe the exchange–correlation interaction among electrons.53,54 An on-site Hubbard-U of 4.2 eV was added for Ti-3d to correct the Coulomb repulsion between localized Ti-3d orbitals.55,56 The van der Waals (vdW) correction with the Grimme approach (DFT-D3) was included in the interaction between single molecule/atoms and substrates.57 The energy cutoff for the plane wave-basis expansion was set to 500 eV and the atomic relaxation was continued until the forces acting on atoms were smaller than 0.01 eV Å−1. The Brillouin zone was sampled with 3 × 3 × 1 gamma-center k-point mesh, and the electronic states were smeared using the Fermi scheme with a broadening width of 0.1 eV. The anatase TiO2(101) surface was modeled with a 1 × 2 slab in the lateral plane separated by 15 Å of vacuum in between to avoid the interaction between the slab and its period images.The free energies of the reaction intermediates were obtained by ΔG = ΔEads + ΔZPE − TΔS + ΔG(U) + ΔG(pH), where ΔEads is the adsorption energy, ZPE is the zero point energy and S is the entropy at 298 K. The effect of a bias was included in calculating the free energy change of elementary reactions involving transfer of electrons by adding ΔG(U) = n eV, where n is the number of electrons transferred and U is the electrode potential.58–60 In our calculations, we used U = −0.15 V (vs. RHE). ΔG(pH) = kBT![[thin space (1/6-em)]](https://www.rsc.org/images/entities/char_2009.gif) ln
ln![[thin space (1/6-em)]](https://www.rsc.org/images/entities/char_2009.gif) 10 × pH, where kB is the Boltzmann constant, and pH = 1 for 0.1 M HCl electrolyte. In this study, the entropies of molecules in the gas phase are obtained from the literature.61
10 × pH, where kB is the Boltzmann constant, and pH = 1 for 0.1 M HCl electrolyte. In this study, the entropies of molecules in the gas phase are obtained from the literature.61
Conclusions
In summary, d-TiO2/TM is proven as a NRR electrocatalyst in acid media under ambient conditions, in conjunction with experimental studies and DFT calculations. At an applied potential of −0.15 V, this catalyst shows much superior electrocatalytic NRR activity (NH3 yield: 1.24 × 10⁻¹⁰ mol s−1 cm−2; FE: 9.17%) to p-TiO2 (NH3 yield: 0.17 × 10⁻¹⁰ mol s−1 cm−2; FE: 0.95%). Notably, d-TiO2/TM also shows great electrochemical stability and durability. These findings not only provide insight into the rational design of highly active catalysts with defects in N2-fixing electrochemistry, but would also open up a new avenue to explore defective materials as catalysts for N2 fixation and other applications.Conflicts of interest
There are no conflicts to declare.Acknowledgements
This work was supported by the National Natural Science Foundation of China (No. 21575071 and 21575137). We also appreciate Hui Wang from the Analytical & Testing Center of Sichuan University for her help with SEM characterization.Notes and references
- R. Schlögl, Angew. Chem., Int. Ed., 2003, 42, 2004–2008 CrossRef PubMed.
- V. Rosca, M. Duca, M. T. de Groot and M. T. Koper, Chem. Rev., 2009, 109, 2209–2244 CrossRef CAS PubMed.
- T. Vegge, R. Z. Sørensen, A. Klerke, J. S. Hummelshøj, T. Johannessen, J. K. Nørskov and C. H. Christensen, Solid-State Hydrogen Storage, 2008, 533–568 CAS.
- B. M. Hoffman, D. Lukoyanov, Z. Yang, D. R. Dean and L. C. Seefeldt, Chem. Rev., 2014, 114, 4041–4062 CrossRef CAS PubMed.
- E. Shilov, Russ. Chem. Bull., 2003, 52, 2555–2562 CrossRef.
- Catalytic Ammonia Synthesis—Fundamentals and Practice, ed. J. R. Jennings, Springer Science+Business Media, New York, 1991 Search PubMed.
- R. Schlögl, Ammonia Synthesis, in Handbook of Homogeneous Catalysis, ed. G. Ertl, H. Knözinger, F. Schüth and J. Weitkamp, Wiley, 2008 Search PubMed.
- M. A. Shipman and M. D. Symes, Catal. Today, 2017, 286, 57–68 CrossRef CAS.
- V. Kyriakou, I. Garagounis, E. Vasileiou, A. Vourros and M. Stoukides, Catal. Today, 2017, 286, 2–13 CrossRef CAS.
- S. Chen, S. Perathoner, C. Ampelli, C. Mebrahtu, D. Su and G. Centi, Angew. Chem., Int. Ed., 2017, 56, 2699–2703 CrossRef CAS PubMed.
- W. Qiu, X. Xie, J. Qiu, W. Fang, R. Liang, X. Ren, X. Ji, G. Cui, A. M. Asiri, G. Cui, B. Tang and X. Sun, Nat. Commun., 2018, 9, 3485 CrossRef PubMed.
- S. Li, D. Bao, M. Shi, B. Wulan, J. Yan and Q. Jiang, Adv. Mater., 2017, 29, 1700001 CrossRef PubMed.
- M. Nazemi, S. R. Panikkanvalappil and M. A. El-Sayed, Nano Energy, 2018, 49, 316–323 CrossRef CAS.
- H. Huang, L. Xia, X. Shi, A. M. Asiri and X. Sun, Chem. Commun., 2018, 54, 11427–11430 RSC.
- K. Kugler, M. Luhn, J. A. Schramm, K. Rahimi and M. Wessling, Phys. Chem. Chem. Phys., 2015, 17, 3768–3782 RSC.
- H. Liu, S. Han, Y. Zhao, Y. Zhu, X. Tian, J. Zeng, J. Jiang, B. Xia and Y. Chen, J. Mater. Chem. A, 2018, 6, 3211–3217 RSC.
- Q. Liu, X. Zhang, B. Zhang, Y. Luo, G. Cui, F. Xie and X. Sun, Nanoscale, 2018, 10, 14386–14389 RSC.
- G. Chen, X. Cao, S. Wu, X. Zeng, L. Ding, M. Zhu and H. Wang, J. Am. Chem. Soc., 2017, 139, 9771–9774 CrossRef CAS PubMed.
- L. Zhang, X. Ji, X. Ren, Y. Ma, X. Shi, Z. Tian, A. M. Asiri, L. Cheng, B. Tang and X. Sun, Adv. Mater., 2018, 30, 1800191 CrossRef PubMed.
- D. Yang, T. Chen and Z. Wang, J. Mater. Chem. A, 2017, 5, 18967–18971 RSC.
- R. Zhang, Y. Zhang, X. Ren, G. Cui, A. M. Asiri, B. Zheng and X. Sun, ACS Sustainable Chem. Eng., 2018, 6, 9545–9549 CrossRef CAS.
- L. Xia, X. Wu, Y. Wang, Z. Niu, Q. Liu, T. Li, X. Shi, A. M. Asiri and X. Sun, Small Methods, 2018 DOI:10.1002/smtd.201800251.
- Y. Liu, Y. Su, X. Quan, X. Fan, S. Chen, H. Yu, H. Zhao, Y. Zhang and J. Zhao, ACS Catal., 2018, 8, 1186–1191 CrossRef CAS.
- C. Lv, C. Yan, G. Chen, Y. Ding, J. Sun, Y. Zhou and G. Yu, Angew. Chem., Int. Ed., 2018, 57, 6073–6076 CrossRef CAS PubMed.
- J. Y. Shin, J. H. Joo, D. Samuelis and J. Maier, Chem. Mater., 2012, 24, 543–551 CrossRef CAS.
- R. Schaub, P. Thostrup, N. Lopez, E. Lægsgaard, I. Stensgaard, J. K. Nørskov and F. Besenbacher, Phys. Rev. Lett., 2001, 87, 266104 CrossRef CAS PubMed.
- D. Yan, Y. Li, J. Huo, R. Chen, L. Dai and S. Wang, Adv. Mater., 2017, 29, 1606459 CrossRef PubMed.
- H. J. la O’, S. J. Ahn, E. Crumlin, Y. Orikasa, M. D. Biegalski, H. M. Christen and Y. Shao-Horn, Angew. Chem., Int. Ed., 2010, 49, 5344–5347 CrossRef PubMed.
- H. Li, J. Shang, Z. Ai and L. Zhang, J. Am. Chem. Soc., 2015, 137, 6393–6399 CrossRef CAS PubMed.
- Y. Zhao, Y. Zhao, G. I. N. Waterhouse, L. Zheng, X. Cao, F. Teng, L. Wu, C. H. Tung, D. O'Hare and T. Zhang, Adv. Mater., 2017, 39, 1703828 CrossRef PubMed.
- X. Zhang, Q. Liu, X. Shi, A. M. Asiri, Y. Luo, T. Li and X. Sun, J. Mater. Chem. A, 2018, 6, 17303–17306 RSC.
- R. Zhang, X. Ren, X. Shi, F. Xie, B. Zheng, X. Guo and X. Sun, ACS Appl. Mater. Interfaces, 2018, 10, 28251–28255 CrossRef CAS PubMed.
- X. Meng and D. Deng, ACS Appl. Mater. Interfaces, 2015, 7, 6867–6874 CrossRef CAS PubMed.
- G. Wang, H. Wang, Y. Ling, Y. Tang, X. Yang, C. R. Fitzmorris, C. Wang, J. Zhang and L. Yat, Nano Lett., 2011, 11, 3026–3033 CrossRef CAS PubMed.
- P. Yan, G. Liu, C. Ding, H. Han, J. Shi, Y. Gan and C. Li, ACS Appl. Mater. Interfaces, 2015, 7, 3791–3796 CrossRef CAS PubMed.
- X. Jiang, Y. Zhang, J. Jiang, Y. Rong, Y. Wang, Y. Wu and C. Pan, J. Phys. Chem. C, 2012, 116, 22619–22624 CrossRef CAS.
- O. Scanlon, C. W. Dunnill, J. Buckeridge, S. A. Shevlin, A. J. Logsdail, S. M. Woodley, C. R. A. Catlow, M. J. Powell, R. G. Palgrave, I. P. Parkin, G. W. Watson, T. W. Keal, P. Sherwood, A. Walsh and A. A. Sokol, Nat. Mater., 2013, 12, 798–801 CrossRef PubMed.
- Z. Yu, Q. Sun, W. Pan, N. Li and B. Tang, ACS Nano, 2015, 9, 11064–11074 CrossRef CAS PubMed.
- H. Irie, Y. Watanabe and K. Hashimoto, J. Phys. Chem. B, 2003, 107, 5483–5486 CrossRef CAS.
- N. Liu, C. Schneider, D. Freitag, M. Hartmann, U. Venkatesan, J. Müller, E. Spiecker and P. Schmuki, Nano Lett., 2014, 14, 3309–3313 CrossRef CAS PubMed.
- T. Ohsaka, F. Izumi and Y. Fujiki, J. Raman Spectrosc., 1978, 7, 321–324 CrossRef.
- A. Naldoni, M. Allieta, S. Santangelo, M. Marelli, F. Fabbri, S. Cappelli, C. L. Bianchi, R. Psaro and V. Dal Santo, J. Am. Chem. Soc., 2012, 134, 7600–7603 CrossRef CAS PubMed.
- J. Deng, J. A. Iñiguez and C. Liu, Joule, 2018, 2, 846–856 CrossRef CAS.
- J. Han, Z. Liu, Y. Ma, G. Cui, F. Xie, F. Wang, Y. Wu, S. Gao, Y. Xu and X. Sun, Nano Energy, 2018, 52, 264–270 CrossRef CAS.
- L. Zhang, X. Ren, Y. Luo, X. Shi, A. M. Asiri, T. Li and X. Sun, Chem. Commun., 2018, 54, 12966–12969 RSC.
- L. Zhang, X. Ji, X. Ren, Y. Luo, X. Shi, A. M. Asiri, B. Zheng and X. Sun, ACS Sustainable Chem. Eng., 2018, 6, 9550–9554 CrossRef CAS.
- H. Cheng and A. Selloni, J. Chem. Phys., 2009, 131, 054703 CrossRef PubMed.
- Y. Li, U. Aschauer, J. Chen and A. Selloni, Acc. Chem. Res., 2014, 47, 3361–3368 CrossRef CAS PubMed.
- M. M. Islam, M. Calatayud and G. Pacchioni, J. Phys. Chem. C, 2011, 115, 6809–6814 CrossRef CAS.
- S. Suarez and D. Paterno, J. Power Sources, 2016, 331, 544–552 CrossRef CAS.
- G. Kresse and J. Furthmüller, Comput. Mater. Sci., 1996, 6, 15–50 CrossRef CAS.
- G. Kresse and J. Furthmüller, Phys. Rev. B: Condens. Matter Mater. Phys., 1996, 54, 11169–11186 CrossRef CAS.
- J. P. Perdew, K. Burke and M. Ernzerhof, Phys. Rev. Lett., 1996, 77, 3865–3868 CrossRef CAS PubMed.
- J. P. Perdew, K. Burke and M. Ernzerhof, Phys. Rev. Lett., 1997, 78, 1396–1396 CrossRef CAS.
- S. L. Dudarev, G. A. Botton, S. Y. Savrasov, C. J. Humphreys and A. P. Sutton, Phys. Rev. B: Condens. Matter Mater. Phys., 1998, 57, 1505 CrossRef CAS.
- B. J. Morgan and G. W. Watson, J. Phys. Chem. C, 2010, 114, 2321–2328 CrossRef CAS.
- S. Grimme, J. Antony, S. Ehrlich and H. J. Krieg, Chem. Phys., 2010, 132, 154104 Search PubMed.
- J. K. Nørskov, J. Rossmeisl, A. Logadottir, L. Lindqvist, J. R. Kitchin, T. Bligaard and H. Jonsson, J. Phys. Chem. B, 2004, 108, 17886–17892 CrossRef.
- L. Yu, X. Pan, X. Cao, P. Hu and X. Bao, J. Catal., 2011, 282, 183–190 CrossRef CAS.
- E. Finazzi, C. Di Valentin, G. Pacchioni and A. Selloni, J. Chem. Phys., 2008, 129, 154113 CrossRef PubMed.
- P. W. Atkins, Physical Chemistry, Oxford University Press, 1998 Search PubMed.
Footnotes |
| † Electronic supplementary information (ESI) available: EDX, UV-Vis and XPS spectra; ion chromatograms; calibration, chronoamperometric, and NRR data; 1H NMR spectra; SEM images; optical photograph; DFT calculations; Table S1. See DOI: 10.1039/c8nr09564g |
| ‡ These authors contributed equally to this work. |
| This journal is © The Royal Society of Chemistry 2019 |

