
 Open Access Article
 This Open Access Article is licensed under a Creative Commons Attribution-Non Commercial 3.0 Unported Licence
In situ three-dimensional imaging of strain in gold nanocrystals during catalytic oxidation†
Ana Flavia
Suzana
ab,
Amélie
Rochet
 *a,
Aline Ribeiro
Passos
a,
João Paulo
Castro Zerba
a,
Carla Cristina
Polo
a,
Celso Valentim
Santilli
b,
Sandra Helena
Pulcinelli
b,
Felisa
Berenguer
c,
Ross
Harder
d,
Evan
Maxey
d and
Florian
Meneau
*a
*a,
Aline Ribeiro
Passos
a,
João Paulo
Castro Zerba
a,
Carla Cristina
Polo
a,
Celso Valentim
Santilli
b,
Sandra Helena
Pulcinelli
b,
Felisa
Berenguer
c,
Ross
Harder
d,
Evan
Maxey
d and
Florian
Meneau
*a
aBrazilian Synchrotron Light Laboratory (LNLS), Brazilian Center for Research in Energy and Materials (CNPEM), 13083-970, Campinas, SP, Brazil. E-mail: amelie.rochet@lnls.br; florian.meneau@lnls.br
bInstituto de Química, UNESP, Rua Professor Francisco Degni, 14800-900 Araraquara, SP, Brazil
cSynchrotron SOLEIL, L'Orme des Merisiers, BP48, Saint Aubin, 91192 Gif-sur-Yvette, France
dAdvanced Photon Source, Argonne National Laboratory, 9700 South Cass Avenue, Argonne, IL 60439, USA
First published on 17th June 2019
Abstract
The chemical properties of materials are dependent on dynamic changes in their three-dimensional (3D) structure as well as on the reactive environment. We report an in situ 3D imaging study of defect dynamics of a single gold nanocrystal. Our findings offer an insight into its dynamic nanostructure and unravel the formation of a nanotwin network under CO oxidation conditions. In situ/operando defect dynamics imaging paves the way to elucidate chemical processes at the single nano-object level towards defect-engineered nanomaterials.
Introduction
Metal nanoparticles used in heterogeneous catalysis present a large number of low-coordinated atoms where reactant adsorption and product desorption take place. These active sites are localised at corners, edges and surface defects.1,2 The reactivity of the catalysts is tuned by the inherently strained surface structure,3,4 which is highly dynamic under reaction conditions.5–7 The improvement of chemical processes can be achieved through fine understanding of the evolution of strain and the formation of defects in both the surface and the inner core structure of the nanomaterials. Moreover, reaction conditions affect the behaviour of catalysts and their performance. In situ/operando studies under relevant and controlled environmental conditions must be performed.8–10 However, in situ three-dimensional imaging techniques enabling nanometer-resolution and strain determination simultaneously are lacking. To date, strain and defect information at the nanoscale are accurately obtained by electron microscopy11,12 with restrictions to reduced pressures due to the short penetration depth of electrons, preventing operando characterisation. On the other hand, powder X-ray diffraction in the hard X-ray regime enables the obtaining of strain structure data under operando conditions but on a large assembly of particles, yielding solely averaged information. The availability of coherent hard X-rays from synchrotron light sources opens new opportunities for imaging studies of nanomaterials,13,14 where Bragg coherent X-ray diffraction imaging (Bragg CDI) can reveal the strain distribution of single micro- and nano-sized objects in three dimensions and under operando conditions.15–21Here, we investigate a model gold sample under CO oxidation reaction conditions at ambient pressure. Besides often being considered as a prototypical reaction to study the fundamental concepts of heterogeneous catalysis, this reaction is also of high environmental and societal importance.22 We use in situ Bragg X-ray coherent diffraction to unveil the defect dynamics and facetting process occurring on 120 nm gold (Au) nanoparticles supported on titanium dioxide (TiO2). Although smaller gold nanoparticles are of greater interest in catalysis due to their catalytic performance at low temperature,7 the gold nanocrystal studied here presents both bulk and surface characteristics with defect sites, corners and edges with low-coordinated atoms, similarly to smaller nanoparticles. Thus, our system can be considered as a model testing ground for surface restructuration that occurs under the industrially relevant reaction conditions used in this work. We describe the adsorbate-induced surface transformation, quantify the surface stress and further show that nanotwin formation plays a crucial role in the nanocrystal deformation mechanisms and correlates with the catalytic properties.
Experimental section
Sample preparation
The monodisperse gold nanoparticles (AuNPs) were prepared following the seeded-growth method.23 The seed nanoparticles were synthesised using the citrate reduction protocol. 0.5 mL of a 1% (w/v) gold chloride solution in 50 mL of Milli-Q water was boiled up to 100 °C. A 1% (w/v) sodium citrate solution was added and the temperature maintained for five minutes under vigorous stirring. The seed and AuNP morphology and size were checked by scanning electron microscopy (Fig. S1†) and small angle X-ray scattering measurements (Fig. S2†). 50 mL of the AuNP colloidal dispersion was mixed with 100 mg of TiO2 powder support and acidified with sulphuric acid to pH = 1. The theoretical loading of gold is 1 wt%. The mixture was stirred for 2 h at room temperature (RT), centrifuged and washed until the supernatant became neutral. The powder was dried at 120 °C for 6 h, calcined at 300 °C for 3 h and treated under a flux of pure H2 at 400 °C for 1 h.Bragg coherent X-ray diffraction imaging
The X-ray imaging experiments were performed at beamline 34-ID-C of the Advanced Photon Source, USA. A 9 keV focussed coherent X-ray beam (500 × 500 nm2) was shined on isolated gold nanocrystals loaded in the operando cell. The same nanoparticle was measured in air at RT and 400 °C and then under reaction conditions at RT, 200 and 400 °C. A heating ramp of 3 °C min−1 was used to reach isothermal conditions for data acquisition. Under reaction conditions, a CO/O2 gas mixture (CO![[thin space (1/6-em)]](https://www.rsc.org/images/entities/char_2009.gif) :O2, 0.5%:3.7%) was used with a total gas flow of 19.5 mL min−1.
:O2, 0.5%:3.7%) was used with a total gas flow of 19.5 mL min−1.
The coherent diffraction patterns, (111) Bragg conditions, were collected with a Timepix detector, with 55 × 55 μm2 pixel sizes, placed 500 mm away from the sample. The 3D diffraction data were acquired as rocking curves with an angular step of 0.02° and 61 frames of 5 second exposure, with 10 repetitions.
For the reconstruction, the phase retrieval was initiated with 20 error-reduction (ER) iterations,24 followed by 180 iterations of the hybrid input–output (HIO) algorithm,25 using a guided approach.26 2220 iterations were used for the reconstruction. The support constraint was refined using the shrink-wrap method and partial coherence was also taken into account.27 The 3D Bragg electron density and the 3D lattice displacement field projected along the [111] Q-vector were obtained by reconstructing the 3D diffraction data. Paraview (http://www.paraview.org) was used to visualise the reconstructions in 2D and 3D.
Results and discussion
Coherent X-ray diffraction patterns were measured around the (111) Bragg peak of a single nanocrystal, leading to a three-dimensional Bragg peak (Fig. 1a). Applying iterative phase retrieval for coherent diffraction imaging,28 we reconstruct the three-dimensional (3D) Bragg electron density and lattice displacement field of the Au nanocrystal (Fig. 1b and c) with a spatial resolution close to 12 nm (Fig. S3†). The amplitude of the image obtained by Bragg CDI represents the electron density of the sample. The phase φ(r) corresponds to the projection of the displacement of the crystal lattice u(r), projected on the scattering vector Q of the measured Bragg diffraction peak, φ(r) = Qu(r).16 The presence of strains within a crystal is indicated by phase changes in the complex image.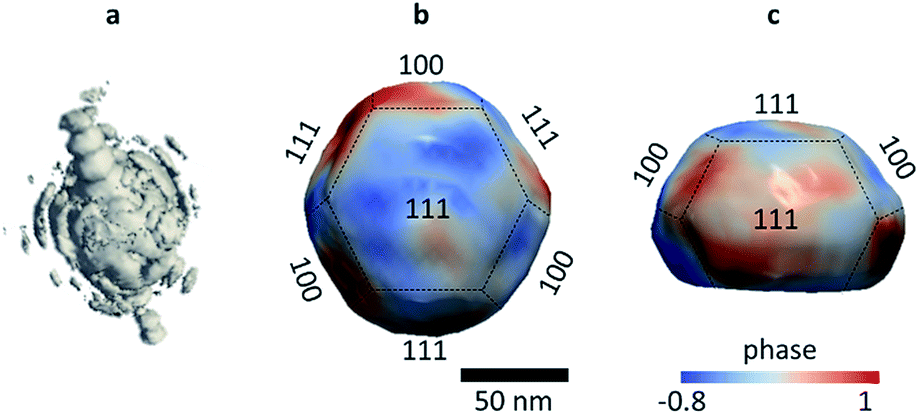 | ||
| Fig. 1 (a) 3D diffraction pattern obtained by rocking scans around the (111) Bragg peak of a 120 nm Au/TiO2 nanoparticle in air at RT. The corresponding 3D reconstruction with a 30% isosurface seen from (b) top and (c) side views scaled with the phase. The facet orientations are shown. | ||
Fig. S4a† shows the 3D reconstruction of the Au nanocrystal in air at room temperature. The latter exhibits a truncated octahedral shape, with (100) and (111) facets (Fig. 1b and c). Upon CO/O2 flow, the 3D reconstructions reveal the adsorbate-induced surface transformations occurring on the Au nanocrystal surface. While the pristine gold nanocrystal reconstruction (RT, air) exhibits a facetted morphology (in agreement with STEM images, Fig. S1†), it becomes smooth and rounded in a CO/O2 environment at RT (Fig. S4b†). These changes in surface morphology are in agreement with those observed under different environments for smaller nanoparticles.29,30 This indicates that the presence of O2 and CO gas molecules induces strong interactions between adsorbates and the surface atoms.
The phase shifts of the gold nanocrystal, in air and CO/O2, are displayed as cross-sectional views in Fig. 2a (surrounded by an orange rectangle). A distinct phase redistribution is observed between the two gas environments: the reactive gas mixture CO/O2 induces a lattice displacement resulting in a smoother phase structure, evidencing the annihilation of several nanocrystal defects. The 3D strain distribution of the entire volume along the measurement direction was obtained by taking the derivative of the displacement field resulting from algorithmic phase reconstruction and is defined as ∂u111(r)/∂x111, where u111(r) is the displacement field. Fig. 2b and c display the 3D strain distribution of the nanocrystal and the cross sections of the strain field along [111], respectively. As for the phase distribution, the strain changes with the gas environment. Its highest values are concentrated at the periphery of the nanoparticle. We observe that a mean surface compressive to tensile strain swap occurs upon flowing the CO/O2 gas mixture on the gold nanocrystal surface. The average surface strain in air equals to −1.7 × 10⁻⁴ and becomes tensile with a mean value of 1.1 × 10⁻⁵ under CO/O2.
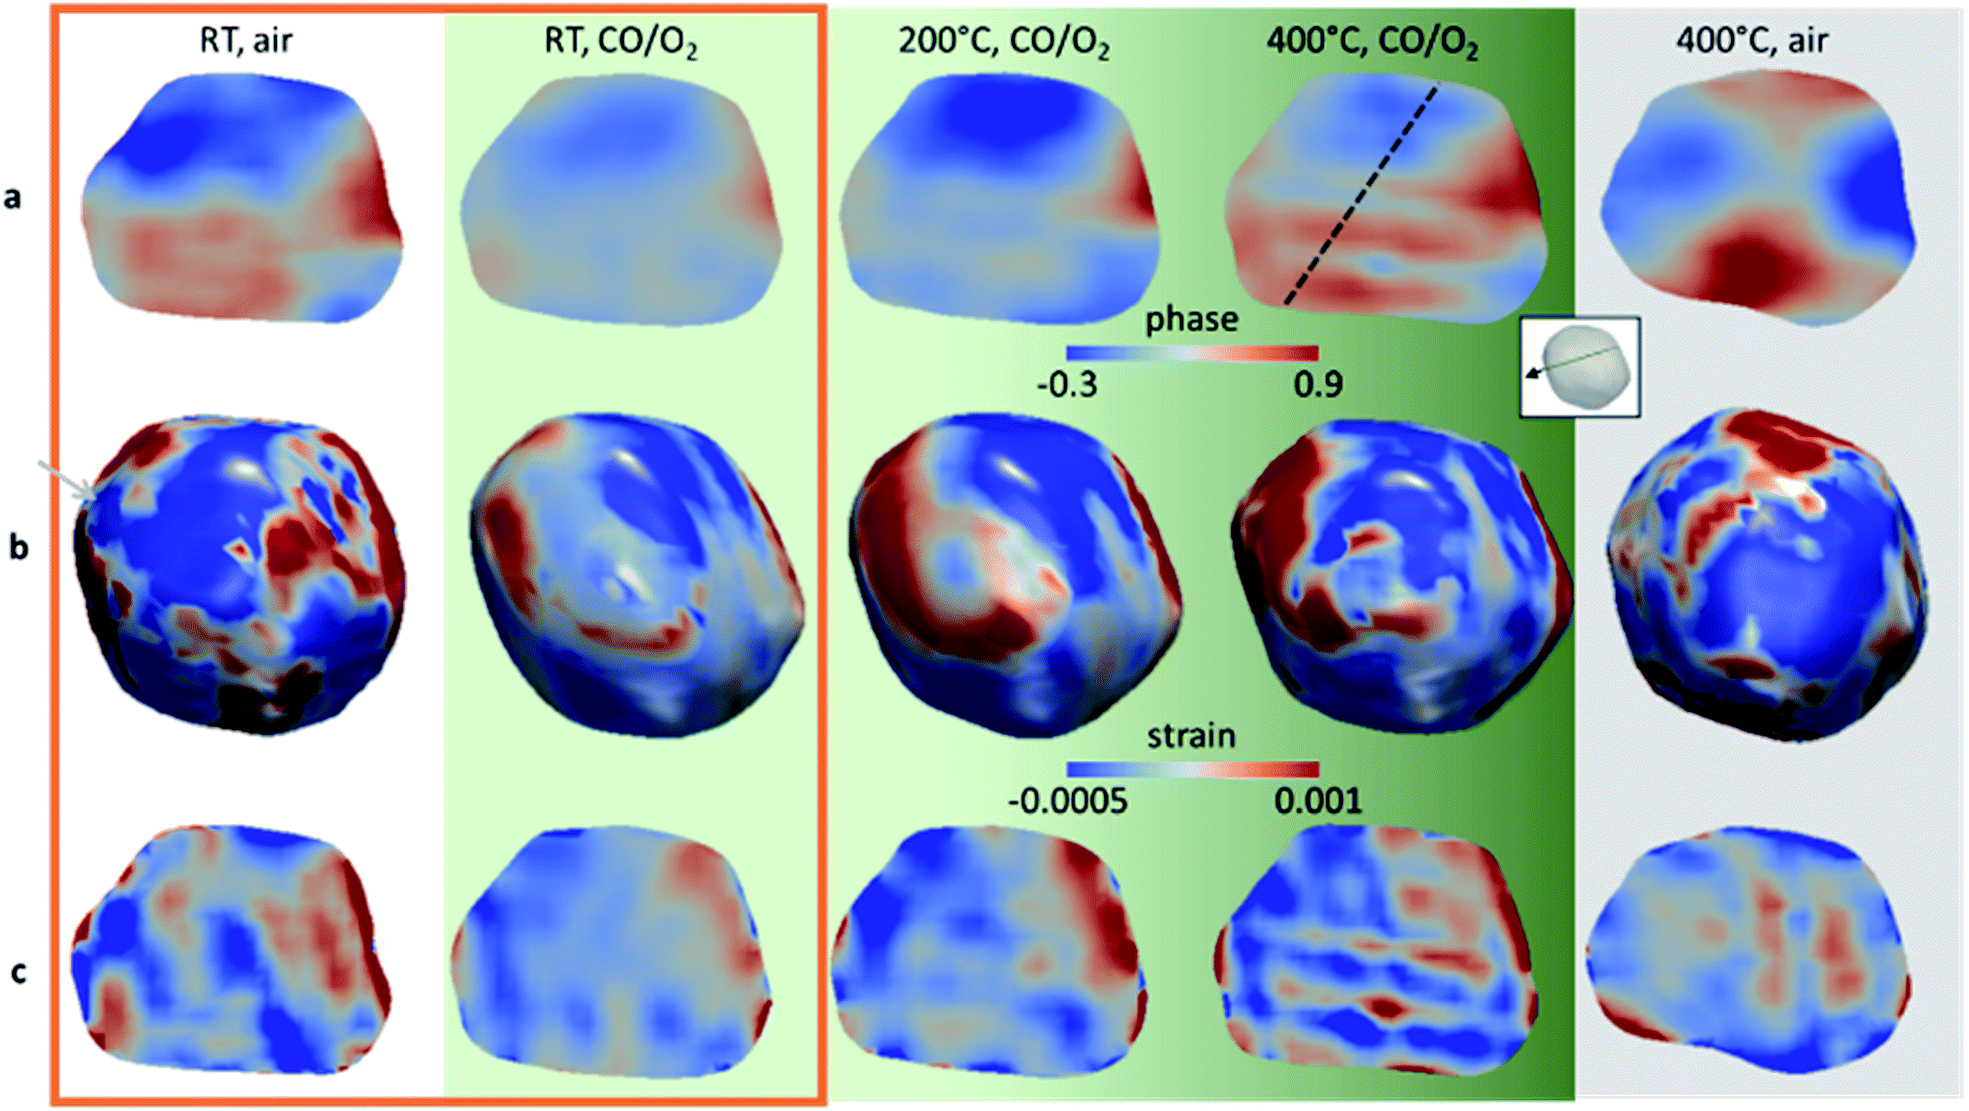 | ||
| Fig. 2 Distribution of the phase and strain field projected along the (111) direction of the same Au/TiO2 nanoparticle in air, at RT and 400 °C and under CO/O2 at RT, 200 °C and 400 °C. Particle cross sections of the inner structure of the nanoparticle corresponding to the atomic displacement (a) and the strain field projected along (111) (c). (b) 3D strain distribution of the strain field projected along (111) from the top view. While the green gradient illustrates the increase of catalytic activity with temperature, the orange rectangle emphasises the RT conditions and the grey background the state at 400 °C in air. In the inset, the green surface indicates the position of the cross section presented in (a) and (c) and the black arrow the orientation of the [111] Q-vector. The dashed black line in (a) shows the position of the line scan presented in Fig. 4. Animations showing the 3D reconstructed Bragg electron density and all cross sections along two axes of the gold nanocrystal, under CO/O2 at RT and 400 °C, are available in ESI Movies S1 and S2.† | ||
This pattern of displacement observed on the surface of the nanocrystal under CO/O2 can be attributed to the decrease of the surface stress, due to the annihilation of point defects. The surface stress σs can be estimated (ESI†) using the Young–Laplace equation.31 At the position indicated by the grey arrow in Fig. 2b, the surface stress of the nanocrystal in air is 2.4 ± 0.3 N m−1, typical of tensile surface stress of metals in the range of 2 N m−1.31,32 On the other hand, the surface stress at the same position under CO/O2 turns out to be compressive and equals to −1.7 ± 0.1 N m−1. The adsorbate-induced surface stress on the gold nanocrystal leads to a compressive stress change at RT of −4.1 N m−1, resulting in the inward displacement of the curved regions. The nanocrystal surface modification is directly influenced by the surface stress, modifying the proportion of under-coordinated sites and tuning the catalytic performance of the nanocrystals. Although effects induced by the presence of the support cannot be excluded, considering the size of the nanoparticle, the metal–support interface is negligible in comparison with the total Au surface.
Moreover, we succeeded in capturing in situ the surface restructuration of the same nanoparticle under CO/O2 at 200 °C and 400 °C. Though gold particles that are of interest for catalysis are smaller, we observed moderate catalytic activity (Fig. S5†) for our model sample loaded inside our in situ imaging cell.33 The catalyst presents an increased activity at 400 °C compared to 200 °C, and none at RT. Fig. 2b shows the three-dimensional strain field distribution of the same nanocrystal at 200 and 400 °C under CO/O2, revealing the nanocrystal surface dynamics. It is worth mentioning that 200 °C is higher than the Hüttig temperature (TH = 127 °C), above which the mobility of surface atoms becomes significant and 400 °C is slightly above the Tammann temperature (TT = 327 °C), above which the mobility of the crystal lattice becomes significant and solid-state diffusion takes place.34 At the highest temperature, we evidenced the reconstitution of sharper edges and corners. As previously stated, nanocrystal corners and edges are regions of low-coordinated atoms and the location of the active sites. A direct correlation between the surface modifications of the nanocrystal and its functional properties is uniquely unveiled here.
Furthermore, under working conditions, the surface modifications are also accompanied by a one-fold increase of the average surface strain, reaching 1.35 × 10⁻⁴ and with corner regions of surface stress > 6 N m−1. This is in agreement with “d-band center theory”.35 The increase of tensile strain strengthens the metal–adsorbate bond by shifting the d-band center toward the Fermi level and leads to improved catalytic activity. At the same time, strong lattice dynamics in the core structure of the nanocrystal, along with anisotropic strain patterns, are observed (Fig. 2). The temperature increase up to 200 °C is accompanied by a phase reorganisation with highly distorted lattice regions (Fig. 3) localised and concentrated at the surface of three edges of the nanoparticle. Edges and steps on the surface of the nanoparticle, rather than the facets, are known to be preferential sites for CO molecule adsorption.30 It is worth mentioning that 200 °C corresponds to a temperature just below the onset temperature of the conversion of CO into CO2 for this sample (Fig. S5†), confirming that the lattice reorganisation is a driven force building the active sites. At 400 °C, a network of highly distorted lattices connects those three edges (Fig. 3).
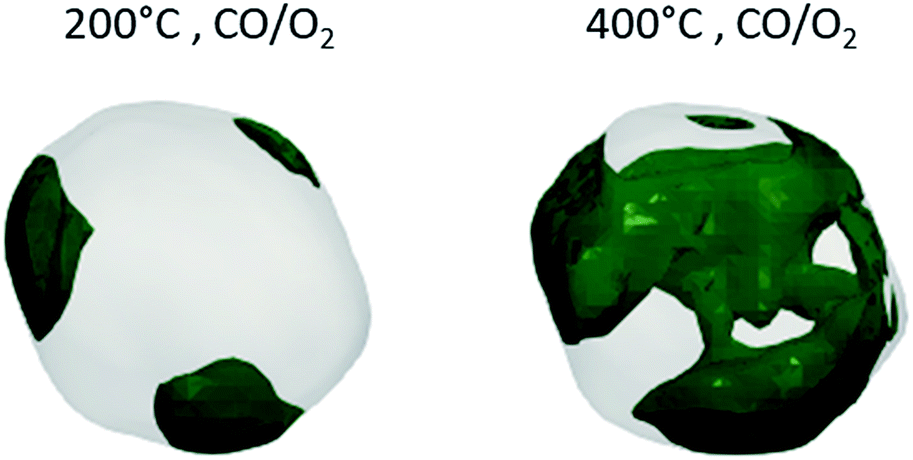 | ||
| Fig. 3 Distribution of the maximum phase shift [0.4–1.1 rad] of the same Au/TiO2 nanoparticle under CO/O2 at 200 °C and 400 °C from the bottom view. The crystal at 200 °C shows highly distorted areas concentrated at the surface of three edges. At 400 °C, a complex network is present with highly distorted areas crossing the entire volume of the crystal and connecting the three regions highlighted at 200 °C. | ||
The phase evolution between the nanocrystal at RT and its active state at 400 °C is emphasised in the line scan (Fig. 4), the latter exhibiting an oscillatory behaviour. Each phase oscillation corresponds to an atomically defective domain, spanning across the nanocrystal and forming a network of parallel stripes with strained interfaces. These defects enable accommodation of the tensile strain which builds up within the nanocrystal and is attributed to a nanotwin network. Indeed, twin domains are planar defects comprising at least two adjacent stacking faults. They occur when a stacking sequence of planes share one of these planes and follow a mirrored packing order.36 Twin domains should be “invisible” in the retrieved Bragg electron density maps since the twin crystal does not satisfy the Bragg condition.36 The phase offset between the parent crystals should be proportional to the twin width, although the twin boundary interfaces as well as the strain contribute to the phase variations, explaining the lower phase offset observed here. The nanotwins cannot be faithfully reconstructed since they are smaller than the resolution achieved here, but the network and its positions are indeed resolved to a much higher precision (Fig. S6†). It is important to note that this complex phase structure is not observed at 400 °C in air (Fig. 2, grey background and line scan Fig. S7†), emphasising that the defect formation is not solely induced and controlled by the temperature.
 | ||
| Fig. 4 Line scans of the phase at RT (black) and 400 °C (red) under CO/O2. The line scan corresponds to the values of the position of the dashed line shown (for 400 °C) in Fig. 2a. | ||
Therefore the nanotwins play a crucial role in the deformation mechanism, facetting process and catalytic behaviour of the gold nanocrystals. The large positive surface stress is the trigger to the surface reconstruction through a glide motion. According to dislocation theory,37 glide motion is performed by the movement of a dislocation or the formation of two partial dislocations (Shockley partials), the latter being energetically more favourable than a single dislocation in the case of FCC metals. When surface stress is applied, Shockley partial dislocations are emitted, leading to twin nucleation which propagates across the nanocrystal. In fact, the highly distorted regions observed at 200 °C (Fig. 3) are likely the nucleation sites of the Shockley partials leading to the twin nucleation which propagates across the core of the nanocrystal between 200 and 400 °C.
Conclusions
This work reports the first in situ 3D imaging of strain on a gold supported nanoparticle under CO oxidation conditions. We use Bragg CDI to image a gold nanocrystal at ambient pressure and reach a spatial resolution of 12 nm, which is not attainable with other techniques. We observe and quantify the adsorbate-induced surface stress on the gold nanocrystal leading to surface restructuration. Furthermore, the present study reveals the role of the nanotwin network in the deformation of the gold nanostructure and sheds further light on the defect dynamics responsible for its chemical properties. Considering the size of the nanoparticle, the metal–support interface is negligible in comparison with the total gold surface, but the effects of the support on the defective domains would deserve further investigation.With the advent of upgraded and fourth-generation synchrotron sources based on a multi-bend achromat lattice like the SIRIUS facility,38 the coherent flux available in the hard-X-ray regime can be expected to increase by two orders of magnitude in the near future.39 This will directly reduce the total data acquisition time, and enable performing time-resolved operando imaging and reaching close to atomic resolution.40 Improving the time-resolution will allow a more detailed analysis of the transient states and could potentially help to improve real world catalysts through a more comprehensive description of the mechanism of defect formation correlated with the active sites.
Author contributions
F. M. and A. R. conceived the project. F. M., A. F. S., E. M. and R. H. carried out the Bragg CDI imaging experiments at the 34-ID-C beamline. A. F. S. prepared the gold on TiO2 samples and performed with A. R. and A. R. P. the materials characterisation. F. M., A. F. S., A. R., A. R. P., J. P. Z., C. C. P. and R. H. analysed the imaging experiments. F. M., A. R., A. F. S. and A. R. P. wrote the paper with input from all authors.Conflicts of interest
There are no conflicts to declare.Acknowledgements
The Advanced Photon Source (APS) is acknowledged for providing beamtime at the 34-ID-C beamline (proposal GUP-53802). The SAXS1 beamline from the LNLS and the High-Performance Computing system are acknowledged (proposals 20150205 and 20180025). The authors would like to thank the LNNano for technical support during electron microscopy work (proposal SEM-21178). This research used resources of the Advanced Photon Source, a U.S. Department of Energy (DOE) Office of Science User Facility operated for the DOE Office of Science by Argonne National Laboratory under Contract No. DE-AC02-06CH11357. This work was supported by the Brazilian funding agency FAPESP (2014/25964-5, 2014/27127-3, 2017/23050-4, and 2018/08816-3).Notes and references
- S. N. Rashkeev, A. R. Lupini, S. H. Overbury, S. J. Pennycook and S. T. Pantelides, Phys. Rev. B: Condens. Matter Mater. Phys., 2007, 76, 035438 CrossRef.
- C. Y. Wu, W. J. Wolf, Y. Levartovsky, H. A. Bechtel, M. C. Martin, F. D. Toste and E. Gross, Nature, 2017, 541, 511 CrossRef CAS PubMed.
- M. Mavrikakis, B. Hammer and J. K. Nørskov, Phys. Rev. Lett., 1998, 81, 2819 CrossRef.
- A. Kuwabara, E. D. Boyes, M. L. Pay, P. L. Gai, M. J. Walsh and K. Yoshida, Nano Lett., 2012, 12, 2027 CrossRef PubMed.
- S. B. Vendelbo, C. F. Elkjær, H. Falsig, I. Puspitasari, P. Dona, L. Mele, B. Morana, B. J. Nelissen, R. Van Rijn, J. F. Creemer, P. J. Kooyman and S. Helveg, Nat. Mater., 2014, 13, 884 CrossRef CAS PubMed.
- K. F. Kalz, R. Kraehnert, M. Dvoyashkin, R. Dittmeyer, R. Gläser, U. Krewer, K. Reuter and J. D. Grunwaldt, ChemCatChem, 2017, 9, 17 CrossRef CAS PubMed.
- Y. He, J.-C. Liu, L. Luo, Y.-G. Wang, J. Zhu, Y. Du, J. Li, S. X. Mao and C. Wang, Proc. Natl. Acad. Sci. U. S. A., 2018, 115, 7700 CrossRef CAS PubMed.
- M. G. O'Brien, A. M. Beale, S. D. M. Jacques, M. Di Michiel and B. M. Weckhuysen, Appl. Catal., A, 2011, 391, 468 CrossRef.
- Y. Li, D. Zakharov, S. Zhao, R. Tappero, U. Jung, A. Elsen, P. Baumann, R. G. Nuzzo, E. A. Stach and A. I. Frenkel, Nat. Commun., 2015, 6, 7583 CrossRef CAS PubMed.
- F. Meirer and B. M. Weckhuysen, Nat. Rev. Mater., 2018, 3, 324 CrossRef.
- C. L. Johnson, E. Snoeck, M. Ezcurdia, B. Rodríguez-González, I. Pastoriza-Santos, L. M. Liz-Marzán and M. J. Hÿtch, Nat. Mater., 2008, 7, 120 CrossRef CAS PubMed.
- B. Goris, J. De Beenhouwer, A. De Backer, D. Zanaga, K. J. Batenburg, A. Sánchez-Iglesias, L. M. Liz-Marzán, S. Van Aert, S. Bals, J. Sijbers and G. Van Tendeloo, Nano Lett., 2015, 15, 6996 CrossRef PubMed.
- S. Baier, C. D. Damsgaard, M. Scholz, F. Benzi, A. Rochet, R. Hoppe, T. Scherer, J. Shi, A. Wittstock, B. Weinhausen, J. B. Wagner, C. G. Schroer and J.-D. Grunwaldt, Microsc. Microanal., 2016, 22, 178 CrossRef CAS PubMed.
- A. M. Wise, J. N. Weker, S. Kalirai, M. Farmand, D. A. Shapiro, F. Meirer and B. M. Weckhuysen, ACS Catal., 2016, 6, 2178 CrossRef CAS PubMed.
- M. A. Pfeifer, G. J. Williams, I. A. Vartanyants, R. Harder and I. K. Robinson, Nature, 2006, 442, 63 CrossRef CAS PubMed.
- I. Robinson and R. Harder, Nat. Mater., 2009, 8, 291 CrossRef CAS PubMed.
- M. Watari, R. A. McKendry, M. Vögtli, G. Aeppli, Y. A. Soh, X. Shi, G. Xiong, X. Huang, R. Harder and I. K. Robinson, Nat. Mater., 2011, 10, 862 CrossRef CAS PubMed.
- D. Kim, M. Chung, J. Carnis, S. Kim, K. Yun, J. Kang, W. Cha, M. J. Cherukara, E. Maxey, R. Harder, K. Sasikumar, S. K. R. S. Sankaranarayanan, A. Zozulya, M. Sprung, D. Riu and H. Kim, Nat. Commun., 2018, 9, 3422 CrossRef PubMed.
- A. Yau, W. Cha, M. W. Kanan, G. B. Stephenson and A. Ulvestad, Science, 2017, 356, 739 CrossRef CAS PubMed.
- U. Ulvestad, A. Singer, J. N. Clark, H. M. Cho, J. W. Kim, R. Harder, J. Maser, Y. S. Meng and O. G. Shpyrko, Science, 2015, 348, 1344 CrossRef PubMed.
- J. Ihli, J. N. Clark, N. Kanwal, Y.-Y. Kim, M. A. Holden, R. J. Harder, C. C. Tang, S. E. Ashbrook, I. K. Robinson and F. C. Meldrum, Chem. Sci., 2019, 10, 1176 RSC.
- H. J. Freund, G. Meijer, M. Scheffler, R. Schlögl and M. Wolf, Angew. Chem., Int. Ed., 2011, 50, 10064 CrossRef CAS PubMed.
- S. Huo, H. Ma, K. Huang, J. Liu, T. Wei, S. Jin, J. Zhang, S. He and X. J. Liang, Cancer Res., 2013, 73, 319 CrossRef CAS PubMed.
- R. W. Gerchberg and W. O. Saxton, Optik, 1972, 35, 237 Search PubMed.
- J. R. Fienup, Appl. Opt., 1982, 21, 2758 CrossRef CAS PubMed.
- C.-C. Chen, J. Miao, C. W. Wang and T. K. Lee, Phys. Rev. B: Condens. Matter Mater. Phys., 2007, 76, 064113 CrossRef.
- S. Marchesini, H. He, H. N. Chapman and S. P. Hau-Riege, Phys. Rev. B: Condens. Matter Mater. Phys., 2003, 68, 140101 CrossRef.
- J. Miao, P. Charalambous, J. Kirz and D. Sayre, Nature, 1999, 400, 342 CrossRef CAS.
- T. Uchiyama, H. Yoshida and N. Kamiuchi, Surf. Sci., 2017, 659, 16 CrossRef CAS.
- Y. Kuwauchi, H. Yoshida, T. Akita, M. Haruta and S. Takeda, Angew. Chem., Int. Ed., 2012, 51, 7729 CrossRef CAS PubMed.
- I. Robinson, J. Phys. Soc. Jpn., 2013, 82, 1 CrossRef.
- W. Haiss, Rep. Prog. Phys., 2001, 64, 591 CrossRef CAS.
- A. Rochet, A. F. Suzana, A. R. Passos, T. Kalile, F. Berenguer, C. V. Santilli, S. H. Pulcinelli and F. Meneau, Catal. Today, 2018 DOI:10.1016/j.cattod.2018.12.020.
- Y. Odarchenko, D. J. Martin, T. Arnold and A. M. Beale, Faraday Discuss., 2018, 208, 243 RSC.
- J. Sun, F. Wang, Y. Liu, Y. Ni, H. Zhou, C. F. Guo and S. Chen, RSC Adv., 2017, 7, 22479 RSC.
- A. Ulvestad, J. N. Clark, R. Harder, I. K. Robinson and O. G. Shpyrko, Nano Lett., 2015, 15, 4066 CrossRef CAS PubMed.
- D. Hull and D. J. Bacon, Introduction to dislocations, Oxford, 5th edn, 2011 Search PubMed.
- L. Liu, N. Milas, A. H. C. Mukai, X. R. Resende and F. H. de Sá, J. Synchrotron Radiat., 2014, 21, 904 CrossRef PubMed.
- M. Yabashi and H. Tanaka, Nat. Photonics, 2017, 11, 12 CrossRef CAS.
- S. H. Dietze and O. G. Shpyrko, J. Synchrotron Radiat., 2015, 22, 1498 CrossRef CAS PubMed.
Footnote |
| † Electronic supplementary information (ESI) available. See DOI: 10.1039/c9na00231f |
| This journal is © The Royal Society of Chemistry 2019 |