 Open Access Article
Interfacial engineering of carbon dots with benzenediboronic acid for fluorescent biosensing†
Min
Pan
,
Zhen
Xu
,
Qunying
Jiang
,
Jie
Feng
,
Junlin
Sun
,
Fuan
Wang
 and
Xiaoqing
Liu
 *
*
Key Laboratory of Analytical Chemistry for Biology and Medicine (Ministry of Education), College of Chemistry and Molecular Sciences, Wuhan University, Wuhan, Hubei 430072, P. R. China. E-mail: xiaoqingliu@whu.edu.cn; Fax: +86-27-68756307; Tel: +86-27-68756307
First published on 6th November 2018
Abstract
Glucose assay is highly important in clinical diagnostics of diabetes. Herein, we engineered the surface of carbon dots by complexation with functional ligand and constructed fluorescent biosensors for the detection of hydrogen peroxide and glucose. In this study, benzenediboronic acid is conjugated to the surface of citric acid-derived carbon dots through formation of boronate complexes with the nanoparticles. The oxidation of benzenediboronic acid with hydrogen peroxide effectively quenches fluorescence of carbon dots through electron transfer process. The sensing performance of the system according to different engineered surfaces of carbon dots was studied by using carbon dots derived from various precursors and different benzenediboronic acid analogues. As a simple mix-and-detect strategy, this system is facilely applied for glucose sensing as hydrogen peroxide is the product catalyzed by glucose oxidase. The benzenediboronic acid-conjugated carbon dots derived from citric acid act as excellent optical probes for sensitive analysis of glucose with detection limit of 0.4 μM. This sensing system shows great selectivity toward interferent species such as analogues of glucose, and can be used to determine glucose in human serum. Engineering the surface of carbon dots by complexation with ligand of interest provides a feasible way to facilitate the development of biological applications.
1. Introduction
Photoluminescent nanoparticles have attracted growing interest for sensing and biosensing, since the fluorescent nanoparticles can act as optical labels for biorecognition events, biocatalytic reactions and intracellular imaging.1–3 Various platforms based on fluorescence, fluorescence resonance energy transfer, chemiluminescence resonance energy transfer and electron transfer quenching are developed to follow the biorecognition and bioimaging processes both in vitro and in vivo.4–6 Recently, carbon dots (CDs) represent an emerging class of fluorescent materials. CDs possess excellent properties such as water solubility, chemical inertness, lacking of blinking and excellent biocompatibility compared with traditional organic dyes and inorganic semiconductor quantum dots.7–9 It has been reported that CDs are nontoxic substitutes of semiconductor quantum dots considering heavy metal component of the latter. Besides low cytotoxicity, carbon dots have attracted much attention due to their simple preparation procedure and tunable surface functional groups compared with quantum dots. Therefore, CDs are extensively used in various fields including sensors,10–13 optoelectronic devices14 and biomedical imaging.15 Specifically, the unique optical features of CDs make them particularly attractive for biosensors.16,17In order to develop novel biological sensing platforms, one of the fundamental factors is the surface modification and engineering CDs to initiate biorecognition events or biocatalytic transformations. Different synthetic strategies including both top-down and bottom-up synthesis are developed to control functional groups on the surface. Among these methods, thermal oxidation of precursors developed by Bourlinos is extensively explored for the simplicity.18,19 The precursors can be easily obtained from various materials such as graphite and organic molecules, which allows generation of carbon dots with tunable photoluminescence properties and control over different functional groups such as amino, carboxyl and hydroxyl on the surface of the CDs.20,21 More importantly, further engineering of CDs and tethering functional molecules onto the surface of CDs is challenging in order to construct functional nanoparticles and sensing platforms integrating both imaging and recognition functions.22 In recent years, certain smart approaches have been reported to functionalize CDs as fluorescent probes. For example, branched poly(ethylenimine) modified CDs were applied to detect copper ions, since the amino groups on the surface of carbon dots could bind copper ions to form cupric amine and resulted in strong fluorescence quenching of the quantum dots.23 Also, silver nanoparticles were grown on the surface of CDs, and in the presence of hydrogen peroxide the nanocomplexes were etched into silver ions, leading to a fluorescence change of the system. Therefore, engineering the surface resulted in quantitative analysis of hydrogen peroxide.24 Alternatively, dopamine was covalently modified onto the surface of CDs carrying carboxyl group for tyrosinase activity monitoring and its inhibitor screening.25 Overall, engineering surface of CDs is fundamental and remains a great challenge in developing new sensing platforms.
Diabetes is a serious, chronic disease that occurs when the body ineffectively produces or uses insulin to regulate blood sugar or glucose. The first World Health Organization Global report on diabetes issued in 2016 demonstrated that about 422 million adults were living with diabetes in 2014 globally, a number likely to more than double in the next 20 years.26 The National Diabetes Statistics Report of 2017 announced that an estimated 9.4% of the U.S. population had diabetes, and an estimated 33.9% of U.S. adults had prediabetes in 2015.27 Diabetes is reported to be one of the top 6 causes of death globally in 2015, therefore, it is highly important to develop glucose assay for the diagnosis and prevention of the disease. Approaches used for the sensing of glucose such as electrochemistry, colorimetry and fluorescence spectroscopy are generally based on labeled enzymes and substrates, enzymatic oxidation of glucose by glucose oxidase, or synthetic receptors as sensors.28–32
Different fluorescent probes have been successfully developed for glucose assay. For example, formation of boronated complexes between analyte and boronic acids covalently modified onto the surface of quantum dots will lead to fluorescence quenching of the fluorogen and enable glucose detection.33,34 Similarly, tetraphenyl ethane with two boronic acid units was synthesized as a novel fluorescent probe and was used specifically for analyzing glucose based on aggregation-induced emission.35 Among these methods, fluorescent glucose sensors relying on enzyme have attracted much attention due to the high selectivity, sensitivity and simplicity. Luminescent methods analyzing hydrogen peroxide and glucose have been reported by luminescence quenching of nanoprobes such as CdSe/ZnS quantum dots modified glucose oxidase, manganese dioxide nanosheet-modified upconversion nanoparticles and DNA-templated silver nanoclusters.36 However, simple, label-free and cost-effective strategies utilizing nanoparticles that possess excellent photoluminescent properties are still quite limited. It is vital to develop simple and effective approaches using luminescent nanoparticles with appropriate surface design for selective fluorescent glucose assay.37,38
In the present study, we prepare CDs using citric acid as a precursor, functionalize the CDs with a diboronic acid ligand, 1,4-benzenediboronic acid (BDBA), and propose a facile approach for H2O2 and glucose sensing. The CDs using citric acid as the carbon source bear numerous surface structures of alpha hydroxy acid and exhibit bright photoluminescent properties. In principle, BDBA will interact with the CDs through complexation of alpha hydroxy acid with boronic acid ligand to form boronate esters on the surface of CDs. Meanwhile, the boric acid ester bond is easily oxidized by H2O2 to form benzoquinone, which is in proximity to CDs. Thus, addition of the H2O2 can effectively quench fluorescence of the CDs through a process of electron transfer. Considering that hydrogen peroxide is a typical product of biological substrates catalyzed by enzymes, controlling the photoluminescent properties of CDs by H2O2 may provide a simple and versatile method to develop biosensors for enzymes and substrates. Glucose can be catalyzed by glucose oxidase with the production of H2O2, therefore, fluorescence intensity of CDs is directly depended on the concentration of glucose, which enables quantitative fluorescent assay of glucose by the boronate complexes associated with carbon dots (Scheme 1).
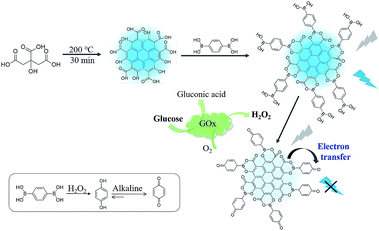 | ||
| Scheme 1 Schematic illustration for interfacial engineering of carbon dots with benzenediboronic acid to construct fluorescent biosensor. | ||
2. Experimental section
2.1 Chemicals and reagents
Citric acid, glucose, glucose oxidase, 1,4-benzenediboronic acid (BDBA), hydroquinone (H2Q), maltose, fructose, lactose, hydrogen peroxide (H2O2), sodium dihydrogen phosphate, disodium hydrogen phosphate, sucrose, dopamine, reduced glutathione, ascorbic acid, and various amino acids were obtained from Sigma-Aldrich. Glutamic acid, aspartic acid, 3-hydroxybutyrate and 4-hydroxyphenylboronic acid (HBA) were purchased from Aladdin. Ultrapure water purified by a Milli-Q apparatus (Millipore, Bedford, MA) was used throughout the study. Serum sample collections were approved by the institutional review board of Wuhan University, and all patients provided informed consent according to the Declaration of Helsinki.2.2 Characterizations
The fluorescence and absorption spectra were performed using a Cary Eclipse spectrometer (Varian Inc) and UV 2600 spectrometer (Shimadzu), respectively. Transmission electron microscope (TEM) observation was obtained by HT7700 microscope with a field emission gun operating at 200 kV. The X-ray diffractometer (XRD) patterns were recorded using a Rigaku Smart Lab X-ray diffractometer (λ = 0.151 nm). Fourier transform infrared (FT-IR) spectroscopy was carried out on a Nicolet iS10 FT-IR spectrophotometer, and X-ray photoelectron spectroscopy (XPS) measurements were performed by an ESCALAB 250Xi XPS spectrometer (Thermo Fisher). The fluorescence lifetime was measured on a FELIX32 system (Photon Technology International). The as-prepared CDs were scanned in a tapping mode by Multimode 8 Atomic Force Microscope with a Nano Scope V controller (Bruker Inc.).2.3 Synthesis of carbon dots
The CDs were prepared through a modified thermal pyrolysis route using citric acid, glutamic acid, aspartic acid and lysine as carbon source separately.39 Briefly, 2 g of the precursor was added into 25 mL Teflon-lined autoclave and was heated to 200 °C for 30 min. After the reaction cooled to room temperature, the obtained product was neutralized to pH 7.0 by adding 0.5 M NaOH. For further purification, the solution was dialyzed in a dialysis membrane for 4 h (molecular weight 1000 Da) against doubly distilled water. Finally, the powder of carbon dots was obtained by drying in the vacuum oven at 25 °C. The as-purified carbon dots were then dispersed in double distilled water with a concentration of 50 mg mL−1 and stored at 4 °C before use.2.4 Fluorescence detection of H2O2 and glucose
For H2O2 sensing, 100 μL of phosphate buffer solution (10 mM, pH 10), 5 μL of purified CDs, and 75 μL of BDBA (0.2 mM) were mixed together. Then, 20 μL of H2O2 with different concentrations were added and mixed adequately. The mixture was incubated at room temperature for 35 min before fluorescence measurement. For the detection of glucose, 25 μL of GOx (0.05 U L−1) was reacted with 125 μL of different concentrations of glucose in phosphate buffer (50 mM, pH 7.0) at 37 °C with shaking for 35 min. Meanwhile, 110 μL of phosphate buffer (10 mM, pH 10), 10 μL of purified CDs and 75 μL BDBA (0.4 mM) were incubated, and then 5 μL of the biocatalyzed product was added to the solution. The fluorescence spectra were recorded for a fixed time interval of 35 min. The emission spectra of CDs were acquired by exciting the samples at 365 nm, and the corresponding fluorescence emission spectra were collected from 390 to 560 nm. The fluorescence changes were recorded at a fixed emission wavelength of 460 nm with an excitation wavelength of 365 nm.2.5 Glucose detection in human serum
The human serum samples of healthy volunteers were obtained from Zhongnan Hospital of Wuhan University. Prior to analysis, the serum samples were centrifuged using an ultrafilter with a 3000-molecular weight cutoff at 5000 rpm for 15 min. Typically, 100 μL of 5% serum, 250 μL of glucose, and 25 μL of GOx (0.05 U L−1) were incubated in phosphate buffer (50 mM, pH 7.0) at 37 °C for 35 min. To 5 μL of this solution, 10 μL purified CDs and 75 μL BDBA (0.4 mM) were added and incubated for 30 min. The fluorescence spectra were recorded using excitation at 460 nm.3. Results and discussion
3.1 Preparation and characterization of CDs
The carbon dots with functional group of α-hydroxy acid were synthesized via directly pyrolyzing citric acid under 200 °C for 30 min in a Teflon-lined autoclave.39 The TEM image of the CDs in Fig. 1A shows that the as-prepared CDs are well-dispersed with an average diameter of 4 nm. The XRD patterns of CDs reveal a wide (002) peak around 0.34 nm (Fig. S1†), suggesting that carbonizing citric acid would produce graphite structures. As can be seen from Fig. 1B, the CDs exhibit absorption at 365 nm, whereas the precursor has no absorption in this range. The CDs solution shows a blue emission (460 nm) under 365 nm UV light (inset, Fig. 1B). The emission wavelength of CDs is nearly excitation-independent when the excitation wavelength varies from 320 to 420 nm (Fig. 1C). Moreover, the fluorescence quantum yield (Ex 365 nm/Em 460 nm) is 8.8% (using quinine sulfate as reference), similar to the value reported by previous studies.40FT-IR and XPS were used to investigate the surface structure and composition of the obtained CDs (Fig. S2†). The CDs exhibit distinct absorption bands at 3430, 2930, 1750, and 1080 cm−1, which can be attributed to O–H stretching vibration, C–H stretching vibration, C![[double bond, length as m-dash]](https://www.rsc.org/images/entities/char_e001.gif) O bending vibration and C–OH bending vibration, respectively. Compared with the FT-IR spectrum of the precursor, the CDs possess functional groups of citric acid such as carboxyl group and hydroxyl group. For a better demonstration of the functional group on the surface of the CDs, XPS measurement was performed. The wide XPS spectrum in Fig. S3A† shows two typical peaks at 285 and 532 eV, suggesting that the CDs are composed of C and O elements. As shown in Fig. S3B,† the C 1s peak mainly consists of three subpeaks at 284.7, 286.4 and 288.5 eV, which are attributed to the C–C, C–O and COO bonds, respectively. As shown in Fig. S3C,† O 1s peak is composed of two subpeaks at 531.3 and 534.2 eV that correspond to C
O bending vibration and C–OH bending vibration, respectively. Compared with the FT-IR spectrum of the precursor, the CDs possess functional groups of citric acid such as carboxyl group and hydroxyl group. For a better demonstration of the functional group on the surface of the CDs, XPS measurement was performed. The wide XPS spectrum in Fig. S3A† shows two typical peaks at 285 and 532 eV, suggesting that the CDs are composed of C and O elements. As shown in Fig. S3B,† the C 1s peak mainly consists of three subpeaks at 284.7, 286.4 and 288.5 eV, which are attributed to the C–C, C–O and COO bonds, respectively. As shown in Fig. S3C,† O 1s peak is composed of two subpeaks at 531.3 and 534.2 eV that correspond to C![[double bond, length as m-dash]](https://www.rsc.org/images/entities/char_e001.gif) O and C–O, respectively.
O and C–O, respectively.
3.2 Principle of the biosensor based on BDBA-conjugated CDs
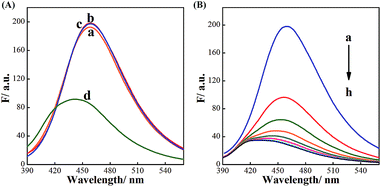
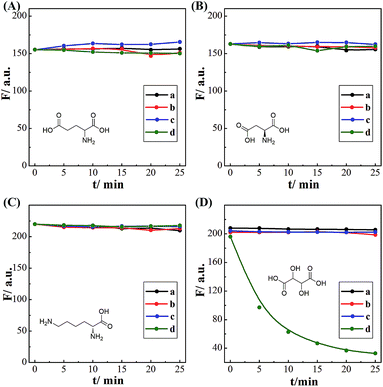
As illustrated in Scheme 1, BDBA is capable of interacting with CDs and forms boronate ester through complexation of α-hydroxy carboxylic acid on the surface of CDs with boronic acid (Fig. S2 and S3†). The as-formed boric acid ester bond is easily oxidized by H2O2 and turns into benzoquinone in alkaline condition,41,42 which may efficiently quench the fluorescence of CDs through electron transfer.36,37 Meanwhile, glucose can be oxidized by GOx and produce H2O2, and subjecting the reaction mixture to the BDBA conjugated CDs will quench the fluorescence in the system. Thus, quantitative assay of H2O2 and glucose can be achieved. Fluorescence spectra were then obtained to verify the mechanism. Fig. 2A shows that the fluorescence of CDs remains unchanged upon interaction separately with either BDBA or H2O2. However, after incubating the BDBA associated CDs with H2O2, the fluorescence intensity of CDs decreased sharply, indicating that H2O2 induced fluorescence quenching of the CDs. Besides, as the reaction time is prolonged, not only the fluorescence intensity of CDs was decreased but also the wavelength of CDs had a blue-shift from 460 nm to 430 nm (Fig. 2B). These results indicated that the presence of H2O2 changed the molecular energy levels of CDs.43,44 Morphology changes of the system were also characterized via atomic force microscopy (AFM) in order to investigate the principle of the biosensor. The CDs show highly ordered stripes over the entire surface (Fig. S4A†). In particular, the pitch of the stripes is measured to be ∼3 nm (Fig. S4A†). After incubation with BDBA for 30 min, the height of the CDs increased to 10 nm (Fig. S4B†). Once H2O2 was added to CDs–BDBA mixture to oxidize BDBA, the CDs re-dispersed, and the height of CDs recovered to ∼3 nm (Fig. S4C†). This result indicates that BDBA can be conjugated to the surface of CDs and probably mediate the interaction between adjacent carbon dots, while the oxidation of BDBA leads to the dissociation of the complex.To examine the specific interaction between CDs and BDBA, CDs derived from different precursor of citrate analogues were synthesized to obtain surfaces with different functional groups. Three different carbon sources were selected, including L-aspartic acid, L-tartrate and L-glutamic acid. Compared with citric acid, all of these substances have the same functional groups of amino and carboxy but without α-hydroxy acid group. As can be seen from Fig. 3, the fluorescent intensity of CDs derived from the control precursors remains unchanged upon incubation with H2O2 and BDBA separately or the mixture of H2O2 and BDBA. However, the fluorescence intensity of CDs using citric acid as a precursor decreased drastically in the presence of BDBA and H2O2. Evidently, the CDs derived from the citrate analogues cannot interact with BDBA to form boronate complexes because of the lack of functional group of α-hydroxy acid. The fluorescence performance of carbon dots originated from substances with beta-hydroxy acid group (3-hydroxybutyrate as a model) was also studied. As can be seen from the Fig. S5,† the fluorescent intensity of CDs derived from the 3-hydroxybutyrate remains unchanged upon incubation with H2O2 and BDBA separately or the mixture of H2O2 and BDBA. Evidently, the CDs derived from beta-hydroxy acid couldn't interact with BDBA since they lack the reaction site such as two hydroxyl groups in the adjacent position. Hence, it further illustrated the importance of alpha-hydroxy acid in complexation with BDBA. Only CDs modified with the group of α-hydroxy acid can specifically interact with BDBA and form BDBA-conjugated CDs for the sensing of H2O2.
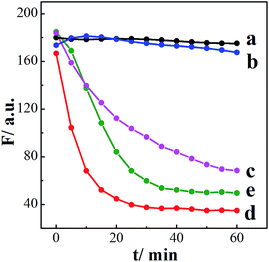
In addition to using different CDs derived from various precursors, two substances, including hydroquinone (H2Q), which is the oxidation product of BDBA, and 4-hydroxyphenylboronic acid (HBA), which belongs to monoboronic acid instead of diboronic acid like BDBA, were introduced for the control experiments in order to investigate the mechanism of the system. We investigated whether those two substances could quench the fluorescence of the CDs functionalized with α-hydroxy carboxylic acid. Fig. 4 compares the time-dependent fluorescence intensity changes of these systems. Both BDBA and HBA showed little influence on the fluorescence of CDs, while addition of H2O2 to the separate system led to decreased fluorescence (Fig. 4). In addition, the quenching efficiency of the BDBA-conjugated CDs is higher than that of the HBA-conjugated CDs. This indicates that BDBA binds more easily to α-hydroxy carboxylic acid on the surface of monoboronic acid. Furthermore, in the presence of H2Q, the fluorescence intensity of CDs decreased as incubation time increased (Fig. 4, curve e), because the quinone group can effectively quench the fluorescence of CDs. This result agrees well with the proposed mechanism that BDBA conjugated to the surface of CDs was oxidized by H2O2 and eventually form benzoquinone. Overall, these results clearly suggest that BDBA interacts strongly with citric acid-derived CDs. They were analyzed by the Stern–Volmer (S–V) expression in eqn (1), in which I0 and I are the fluorescence intensities in the absence and in the presence of the quenching agents [Q], respectively. KSV is the S–V quenching constant.
| I/I0 = 1 + KSV[Q] | (1) |
From the slopes of the linear plots of I0/I vs. [H2O2], the S–V quenching constants (KSV) was calculated as 5.8 × 10⁴ M−1 (Fig. S6†).
On the basis of the above observations, we preliminarily proved biosensing principle of the engineered interface. As mentioned above, the obtained CDs retained functional group of its precursor such as carboxyl group and hydroxyl group on the surface (Fig. S2†), and boronic acids had a strong interaction with the α-hydroxy acid group on the surface of CDs derived from citric aids. Once incubated with H2O2, boronic acid groups react with H2O2 to form phenol groups and subsequently benzoquinone, which effectively quenches the fluorescence of CDs.
For a better understanding of the mechanism of luminescence, fluorescence lifetime of the BDBA-conjugated CDs in the absence and presence of H2O2 was investigated. Fig. S7† shows the time-resolved fluorescence decay curves of CDs corresponding to different systems. The lifetime of CDs was 5.87 ns and remained nearly the same after incubation with BDBA (τ = 5.72 ns). With further incubation with H2O2, the lifetime of BDBA-associated CDs turned to be 4.62 ns. The lifetime changes upon subjection of the system to H2O2 suggested that electron transfer probably could be responsible for fluorescence quenching of the system.
3.3 Performance of the fluorescent H2O2 and glucose biosensors
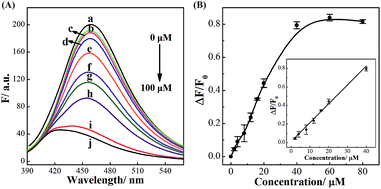
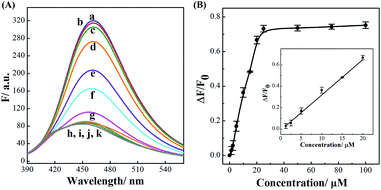
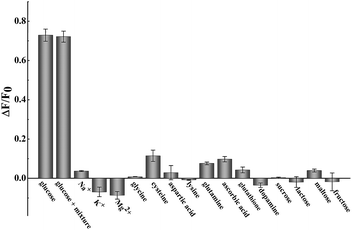
The successful surface engineering of CDs by complexation with BDBA allows development of H2O2 sensor, and various factors such as reaction pH, reaction time and concentration of BDBA are investigated and optimized (Fig. S8†). As shown in Fig. 5, the fluorescent intensity of CDs at 460 nm decreased with elevated concentration of H2O2 under optimistic conditions. There is a good linear relationship (R2 = 0.994) between the relatively decreased fluorescent intensity of CDs and H2O2 concentration in the range from 2 to 40 μM (Fig. 5B, inset). The equation was (F0 − F)/F0 = 0.0121 + 0.0203[H2O2], and the detection limit was 0.18 μM (signal-to-noise ratio of 3). The successful analysis of H2O2 by the BDBA-mediated fluorescence change enables the implementation of the BDBA-conjugated CDs as a versatile fluorescent probe to follow biocatalytic processes. For example, the system can be used for optical detection of oxidase activity and the corresponding H2O2-generating substrates. Glucose oxidase can catalyze the oxidation of glucose by O2 and generate gluconic acid and H2O2, thus, this system could be implemented to detect glucose. As shown in Fig. 6, a good linear relationship (R2 = 0.997) was achieved between the relatively decreased fluorescent intensity and glucose concentration in the range from 1.25 to 20 μM (Fig. 6B, inset). The equation was (F0 − F)/F0 = 0.0330 − 0.0107[glucose], and the detection limit was 0.4 μM (signal-to-noise ratio of 3). F0 and F represent the fluorescence intensity in the absence and presence of the glucose, respectively. Table S1† compares the detection limit of this study with other sensing platforms. It can be seen that the present study exhibits better or comparable sensitivity for the analysis of glucose.Selectivity is of great importance to evaluate the performance of fluorescent sensors. To investigate the specificity of the proposed sensing strategy, various interfering compounds including inorganic ions, amino acid and other common interferent species are employed. As shown in Fig. 7, separate Na+, K+, Mg2+, glycine, cysteine, aspartic acid, lysine, glutathione, dopamine, ascorbic acid, sucrose, lactose, maltose and fructose only generate negligible fluorescence signal, and have no or negligible influence on the detection of glucose. Additionally, the mixture of all the investigated interferent species produces no fluorescent signals for glucose assay. These results clearly showed that the proposed method for glucose detection had high selectivity. The good selectivity of the glucose is mainly attributed to the specific sensing mechanism that relies on the reaction between H2O2 and BDBA, and the introduction of enzyme to the system.
The performance of the glucose biosensor was further evaluated by standard addition of glucose to human serum. As shown in Table 1, by adding different concentrations of glucose into 5% serum samples, good recoveries were obtained in the range from 92.9% to 105.5% with RSD below 3%, which were acceptable for practical detection.
| Sample | Added (μM) | Found (μM) | Recovery (%) | RSD (n = 3, %) |
|---|---|---|---|---|
| 1 | 2 | 2.11 | 105.5% | 2.37 |
| 2 | 10 | 10.05 | 100.5% | 2.44 |
| 3 | 20 | 18.85 | 92.9% | 1.29 |
4. Conclusions
In summary, we have reported that BDBA can form boronate complexes with citric acid-derived CDs. The fluorescence of the BDBA-conjugated CDs was efficiently quenched by H2O2via electron transfer. The engineered CDs through complexation with ligand BDBA allow development of glucose biosensor with high sensitivity and excellent specificity. Furthermore, accurate quantitative assay of glucose in human serum sample was achieved. The approach based on BDBA-mediated fluorescence change of carbon dots is promising for sensing and has many envisioned applications, especially for enzyme activity, biological substrate and inhibitor assay.Conflicts of interest
There are no conflicts to declare.Acknowledgements
This study is supported by the National Natural Science Foundation of China (No. 21503151, 81602610, 81472735), the National Natural Science Foundation of Jiangsu Province, China (BK20161248, BK20160381), and 1000 Young Talent Program of China (F. W. and X. L.).References
- N. Hildebrandt, C. M. Spillmann, W. R. Algar, T. Pons, M. H. Stewart, E. Oh, K. Susumu, S. A. Diaz, J. B. Delehanty and I. L. Medintz, Chem. Rev., 2017, 117, 536–711 CrossRef CAS PubMed.
- X. Sun and Y. Lei, Trends Anal. Chem., 2017, 89, 163–180 CrossRef CAS.
- K. Hola, Y. Zhang, Y. Wang, E. P. Giannelis, R. Zboril and A. L. Rogach, Nano Today, 2014, 9, 590–603 CrossRef CAS.
- X. L. Huang, J. B. Song, B. C. Yung, X. H. Huang, Y. H. Xiong and X. Y. Chen, Chem. Soc. Rev., 2018, 47, 2873–2920 RSC.
- H. B. Wang, H. D. Zhang, Y. Chen and Y. M. Liu, Biosens. Bioelectron., 2015, 74, 581–586 CrossRef CAS PubMed.
- Y. Z. Zheng, D. K. Zhang, S. N. A. Shah, H. F. Li and J. M. Lin, Chem. Commun., 2017, 53, 5657–5660 RSC.
- Y. Lin, R. Chapman and M. M. Stevens, Adv. Funct. Mater., 2015, 25, 3183–3192 CrossRef CAS PubMed.
- K. Jiang, S. Sun, L. Zhang, Y. Lu, A. Wu, C. Cai and H. Lin, Angew. Chem., Int. Ed., 2015, 54, 5360–5363 CrossRef CAS PubMed.
- S. Y. Lim, W. Shen and Z. Gao, Chem. Soc. Rev., 2015, 44, 362–381 RSC.
- S. Qu, H. Chen, X. Zheng, J. Cao and X. Liu, Nanoscale, 2013, 5, 5514–5518 RSC.
- D. Zhao, C. Chen, J. Sun and X. Yang, Analyst, 2016, 141, 3280–3288 RSC.
- L. Zhang, Y. Han, J. Zhu, Y. Zhai and S. Dong, Anal. Chem., 2015, 87, 2033–2036 CrossRef CAS PubMed.
- H. B. Wang, Y. Chen, N. Li and Y. M. Liu, Microchim. Acta, 2017, 184, 369–388 CrossRef.
- F. Yuan, S. Li, Z. Fan, X. Meng, L. Fan and S. Yang, Nano Today, 2016, 11, 565–586 CrossRef CAS.
- G. Hong, S. Diao, A. L. Antaris and H. Dai, Chem. Rev., 2015, 115, 10816–10906 CrossRef CAS PubMed.
- N. Wang, A. Q. Zheng, X. Liu, J. J. Chen, T. Yang, M. L. Chen and J. H. Wang, ACS Appl. Mater. Interfaces, 2018, 9, 7901–7909 CrossRef PubMed.
- Z. Peng, E. H. Miyanji, Y. Zhou, J. Pardo, S. D. Hettiarachchi, S. Li, P. L. Blackwelder, I. Skromne and R. M. Leblanc, Nanoscale, 2017, 9, 17533–17543 RSC.
- A. B. Bourlinos, A. Stassinopoulos, D. Anglos, R. Zboril, V. Georgakilas and E. P. Giannelis, Chem. Mater., 2008, 20, 4539–4541 CrossRef CAS.
- A. B. Bourlinos, A. Stassinopoulos, D. Anglos, R. Zboril, M. Karakassides and E. P. Giannelis, Small, 2008, 4, 455–458 CrossRef CAS PubMed.
- H. Li, Z. Kang, Y. Liu and S. T. Lee, J. Mater. Chem., 2012, 22, 24230–24253 RSC.
- H. Li, X. He, Z. Kang, H. Huang, Y. Liu, J. Liu, S. Lian, C. H. Tsang, X. Yang and S. T. Lee, Angew. Chem., Int. Ed., 2010, 49, 4430–4434 CrossRef CAS PubMed.
- C. Ding, A. Zhu and Y. Tian, Acc. Chem. Res., 2014, 47, 20–30 CrossRef CAS PubMed.
- Y. Dong, R. Wang, G. Li, C. Chen, Y. Chi and G. Chen, Anal. Chem., 2012, 84, 6220–6224 CrossRef CAS PubMed.
- Y. Liu, M. Wei, Y. Li, A. Liu, W. Wei, Y. Zhang and S. Liu, Anal. Chem., 2017, 89, 3430–3436 CrossRef CAS PubMed.
- L. Chai, J. Zhou, H. Feng, C. Tang, Y. Huang and Z. Qian, ACS Appl. Mater. Interfaces, 2015, 7, 23564–23574 CrossRef CAS PubMed.
- L. Sminkey, First WHO Global Report on Diabetes: 422 Million Adults Live with Diabetes, Mainly in Developing Countries, http://www.who.int/mediacentre/news/releases/2016/world-health-day/en/, accessed: January, 2018 Search PubMed.
- Centers for Disease Control and Prevention, National Diabetes Statistics Report: Estimates of Diabetes and Its Burden in the United States, 2017, https://www.cdc.gov/diabetes/data/statistics/statistics-report.htm, accessed: January, 2018 Search PubMed.
- S. Viswanathan and J. A. Ho, Biosens. Bioelectron., 2007, 22, 1147–1153 CrossRef CAS PubMed.
- L. Saa, M. Coronado-Puchau, V. Pavlov and L. M. Liz-Marzan, Nanoscale, 2014, 6, 7405–7409 RSC.
- Y. Jiang, H. Zhao, Y. Lin, N. Zhu, Y. Ma and L. Mao, Angew. Chem., Int. Ed., 2010, 49, 4800–4804 CrossRef CAS PubMed.
- X. Sun and T. D. James, Chem. Rev., 2015, 115, 8001–8037 CrossRef CAS PubMed.
- H. B. Wang, Y. Chen, Y. Li and Y. M. Liu, RSC Adv., 2016, 6, 79526–79532 RSC.
- W. Wu, T. Zhou, A. Berliner, P. Banerjee and S. Zhou, Angew. Chem., Int. Ed., 2010, 49, 6554–6558 CrossRef CAS PubMed.
- P. Shen and Y. Xia, Anal. Chem., 2014, 86, 5323–5329 CrossRef CAS PubMed.
- Y. Liu, C. Deng, L. Tang, A. Qin, R. Hu, J. Z. Sun and B. Z. Tang, J. Am. Chem. Soc., 2011, 133, 660–663 CrossRef CAS PubMed.
- R. Gill, L. Bahshi, R. Freeman and I. Willner, Angew. Chem., Int. Ed., 2008, 120, 1700–1703 CrossRef.
- J. Yuan, Y. Cen, X. J. Kong, S. Wu, C. L. Liu, R. Q. Yu and X. Chu, ACS Appl. Mater. Interfaces, 2015, 7, 10548–10555 CrossRef CAS PubMed.
- X. Liu, F. Wang, A. Niazov-Elkan, W. Guo and I. Willner, Nano Lett., 2013, 13, 309–314 CrossRef CAS PubMed.
- Y. Dong, J. Shao, C. Chen, H. Li, R. Wang, Y. Chi, X. Lin and G. Chen, Carbon, 2012, 50, 4738–4743 CrossRef CAS.
- S. Zhu, Q. Meng, L. Wang, J. Zhang, Y. Song, H. Jin, K. Zhang, H. Sun, H. Wang and B. Yang, Angew. Chem., Int. Ed., 2013, 52, 3953–3957 CrossRef CAS PubMed.
- A. R. Lippert, G. C. Van de Bittner and C. J. Chang, Acc. Chem. Res., 2011, 44, 793–804 CrossRef CAS PubMed.
- B. C. Dickinson, C. Huynh and C. J. Chang, J. Am. Chem. Soc., 2010, 132, 5906–5915 CrossRef CAS PubMed.
- H. Ding, S. B. Yu, J. S. Wei and H. M. Xiong, ACS Nano, 2016, 10, 484–491 CrossRef CAS PubMed.
- F. Ehrat, S. Bhattacharyya, J. Schneider, A. Lof, R. Wyrwich, A. L. Rogach, J. K. Stolarczyk, A. S. Urban and J. Feldmann, Nano Lett., 2017, 17, 7710–7716 CrossRef CAS PubMed.
Footnote |
| † Electronic supplementary information (ESI) available. See DOI: 10.1039/c8na00166a |
| This journal is © The Royal Society of Chemistry 2019 |


