 Open Access Article
Creative Commons Attribution 3.0 Unported Licence
Ratiometric two-photon fluorescent probe for in situ imaging of carboxylesterase (CE)-mediated mitochondrial acidification during medication†
Ao
Jiang
a,
Guang
Chen
 *a,
Jie
Xu
a,
Yuxia
Liu
 a,
Guanghui
Zhao
a,
Zhenjun
Liu
a,
Tao
Chen
ab,
Yulin
Li
ab and
Tony D.
James
a,
Guanghui
Zhao
a,
Zhenjun
Liu
a,
Tao
Chen
ab,
Yulin
Li
ab and
Tony D.
James
 *ac
*ac
aThe Key Laboratory of Life-Organic Analysis, Key Laboratory of Pharmaceutical Intermediates and Analysis of Natural Medicine, College of Chemistry and Chemical Engineering, Qufu Normal University, The school attached to Qufu Normal University, Qufu 273165, China. E-mail: chenandguang@163.com
bKey Laboratory of Tibetan Medicine Research & Qinghai Key Laboratory of Qinghai-Tibet Plateau Biological Resources, Northwest Institute of Plateau Biology, Chinese Academy of Science, Xining 810001, Qinghai, P. R. China
cDepartment of Chemistry, University of Bath, Bath, BA2 7AY, UK. E-mail: t.d.james@bath.ac.uk
First published on 3rd September 2019
Abstract
We report on a dual ratiometric two-photon fluorescent probe for in situ sensing of mitochondrial CE activity and pH. Using the probe it is possible to visualize the CE-mediated acidification of hepatoma cells and hepatic tissues during medication with antipyretic anti-inflammatory drugs.
Carboxylesterase (CE) is an important enzyme for ester drugs including antipyretic and anti-inflammatory medicines.1 CE mainly exists in the endoplasmic reticulum as well as mitochondria. These two organelles are in close contact, resulting in high levels of CE near the mitochondria.2 During the metabolism of these drugs, CE participates in the hydrolysis of esters and the resultant acidic metabolites may cause the acidification of mitochondria. Mitochondria are one of the most vital organelles in cells,3 and their acidification is extremely dangerous especially for mitochondrial division.4 Therefore, exploring CE-mediated mitochondrial acidification is essential for understanding the enzyme triggered organelle aberrations.
During drug administration, the acidification of mitochondria can be caused by CE-generated metabolites. Therefore, a molecular probe is required that can successively respond to CE activity and pH, in order to visually explore CE-mediated pH variation during the administration of ester drugs. For many years, researchers have developed various molecular probes,5 many of which can be used for report CE activity6 or pH.7 Unfortunately, there is no molecular probe for the consecutive reporting of CE activity and pH. Therefore, with this research, we present the design of a ratiometric two-photon fluorescent probe for the in situ imaging the CE activity and pH in mitochondria.
Mitochondria-targeting groups are usually positive groups, that can exit the mitochondria during cellular acidification, therefore causing a loss of in situ information about the mitochondria. Therefore, with our design, we synthesized the 1-(4-(chloromethyl)benzyl)-4-methylpyridin-1-ium with 4-methylpyridine and 1,4-bis(chloromethyl)benzene (Fig. S1, ESI†). This molecule has both a positive charge for mitochondria targeting and a benzyl chloride group that can covalently lock the probe with the mitochondria, allowing for the in situ evaluation of mitochondrial information even under the acidic conditions. With this precursor, we next obtained the (E)-1-(4-(chloromethyl)benzyl)-4-(2-(7-hydroxy-2-oxo-2H-chromen-3-yl)pyridin-1-ium (HMT)). HMT responds to changes of pH in a reversible ratiometric manner. Finally, we transformed the hydroxyl of HMT into carboxylic esters to produce the CEMT probe. According to our design, CEMT can target and lock with the mitochondria, and be triggered by mitochondrial CE to produce HMT which can then reversibly monitor the variation of pH in the mitochondria (Scheme 1).
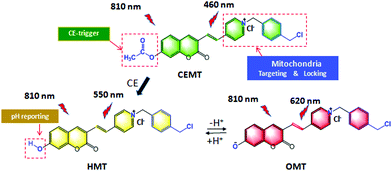 | ||
| Scheme 1 Design and sensing mechanism of a ratiometric two-photon mitochondria-locked probe CEMT toward carboxylesterase (CE) activity and pH. | ||
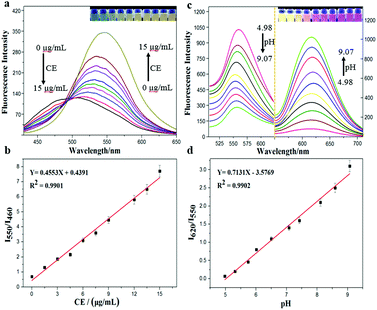
With the probe CEMT in hand, we investigated its properties. Fig. 1 shows that, with the increase of CE, the emission of CEMT at 460 nm (Ex = 410 nm) decreases gradually while the emission at 550 nm (Ex = 410 nm) increases linearly (I550/I460). The ratiometric response of ultraviolet absorption is observed (Fig. S4, ESI†), which is consistent with the fluorescence properties. Next, we investigated the fluorescence response of HMT to pH.
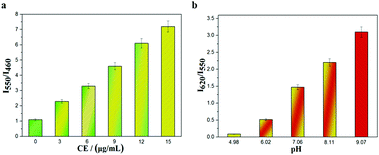
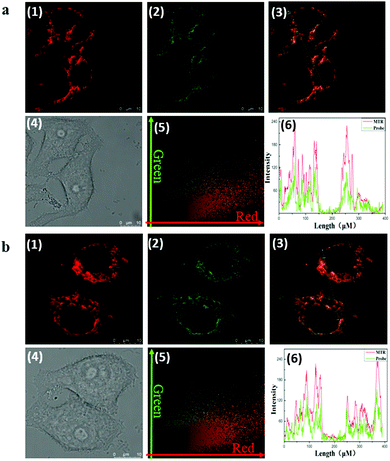
As Fig. 1 indicates, with increasing pH (5.0–9.0), the fluorescence intensity of HMT at 550 nm decreases, while the fluorescence intensity at 620 nm (Ex = 530 nm) increases, with good linear correlation towards pH for the I620/I550 ratio. The reversibility for reporting pH was satisfactory (Fig. S7, ESI†). We then evaluated the ability of CEMT to report CE activity and pH. As shown in Fig. 2, CEMT displayed a ratiometric response (I550/I460) towards increasing amounts of CE (0–15 μg mL−1). Subsequently, B–R buffer was added to generate pH values from 5.0 to 9.0, resulting in a ratiometric response (I620/I550). Thus, CEMT was suitable for the consecutive reporting of CE activity and pH. Finally, we validated the ability of CEMT to target and lock at the mitochondria. As shown in Fig. 3, the co-localization experiments of HMT with MTDR (mitochondrial targeting deep red dye: Ex = 640 nm; Em = 662 nm) indicates that the Pearson's co-localization coefficient was 0.91, demonstrating good targeting ability of CEMT. Subsequently, we changed the pH to 5.0 with B–R buffer and obtained the co-localization coefficients of HMT with MTDR as 0.89. These results demonstrate that although the mitochondria were acidified, probe leakage from the mitochondria was negligible. Therefore, CEMT can be used for the in situ imaging of mitochondrial CE activity and pH.
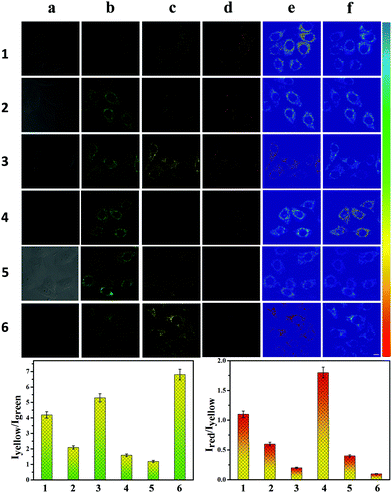
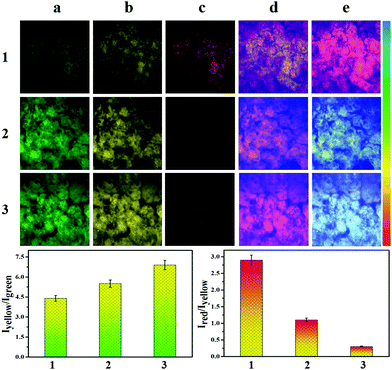
Therefore, we investigated the ability of CEMT to image CE-mediated acidification in cells. As shown in Fig. 4-1, the control group exhibited fluorescence in the yellow channel and the red channel. The two ratios, R1 (I550/I460) and R2 (I620/I550), indicate the CE activity and pH (Fig. 4-1). Then, enzyme inhibitor BNPP (bis-para-nitrophenylphosphate) was added to group 2 before incubation with CEMT. As shown in Fig. 4-2, compared to the control group, fluorescence of the green channel was significantly enhanced, while the fluorescence of both yellow channel and red channel was very weak. This result indicated that BNPP effectively inhibited CE activity, which confirmed that the yellow fluorescence in the control group was due to CE activity. In group 3, we added vinyl acetate, a well-known CE-mediated acidizing agent,8 to investigate the response pattern of CEMT to CE activity and pH. Compared with group 1, group 3 exhibited an enhanced green fluorescence intensity, indicating that CE participated in the metabolism of vinyl acetate and the activity of the CE decreased. However, the yellow fluorescence increased with decreasing red fluorescence, indicating that the metabolism of vinyl acetate resulted in a lowering of the pH. Accordingly, the two ratios R1 (I550/I460) and R2 (I620/I550), displayed upward and downward trends respectively (Fig. 4-3). To verify the result, we pre-treated the cells with inhibitor BNNP before incubation with vinyl acetate. From Fig. 4-4, we can see that, compared with group 3, this group displayed an enhanced fluorescence in the green channel and a weakened fluorescence in yellow channel, demonstrating the inhibition of CE. Finally, to verify that acidification was caused by the CE mediated metabolism of vinyl acetate, we used the B-R buffer to adjust the pH to 5.0 after the cells were pre-treated with BNNP. As shown in Fig. 4-5, compared with group 3, this group displayed a strong fluorescence in green channel, weak fluorescence in the yellow channel and negligible fluorescence in the red channel. Indicating, that CE facilitates acidification via mediation of the metabolism of vinyl acetate. Thus, we can use the signal of CEMT to detect acidification caused by CE-mediated hydrolysis of ester drugs. As an antipyretic drug, benorilate is widely used in the clinic. CE can metabolize benorilate to the acetylsalicylic acid resulting in a reduction of fever and inflammation. We then used the benorilate instead of vinyl acetate to perform the above imaging analysis. As Fig. 4-6 shows, compared with the control group 1, group 6 exhibited enhanced fluorescence in both the green and the yellow channel but weakened fluorescence in the red channel. Obviously, benorilate results in similar fluorescence changes to vinyl acetate, which indicates that benorilate participates in the CE-mediated metabolism and causes acidification. Moreover, the increased R1 (I550/I460) and the decreased R2 (I620/I550) further confirmed this result. Therefore, with its dual ratio signals, CEMT is able to reveal CE-mediated mitochondrial acidification. Considering the two-photon nature of CEMT, we then set out to test its applicability for tissue imaging. Since, the liver is responsible for drug metabolism, we used the probe to visualize the CE-mediated acidification during medication. Drug medication was performed with mice via the heart perfusion of vinyl acetate or benorilate (ESI†). As shown in Fig. 5, compared with group 1, group 2 (vinyl acetate) and group 3 (benorilate) displayed increased fluorescence intensity in the green channel, indicating a decreased activity of CE due to its participation in drug metabolism. Moreover, the fluorescence ratios Iyellow/Igreen and Ired/yellow exhibited upwards and downwards trends respectively. Thus, the two sets of data consistently demonstrated the CE mediated acidification during medication with ester drugs.
In summary, a dual ratiometric mitochondria-locked two-photon fluorescent molecular probe CEMT has been designed to detect CE activity and pH. During medication with ester drugs, CEMT responded to CE-mediated acidification with an upward R1 (I550/I460) and downward R2 (I620/I550). Moreover, the mitochondrial targeting function allowed visualization of in situ information during acidification. The CEMT probe is an effective tool for the visualization of the CE-mediated acidification of cells and tissue, which is of great significance for the exploration of subcellular environmental changes mediated by enzymes.
This work was supported by National Natural Science Foundation of China (No. 21475074, and 21403123), the China Postdoctoral Science Foundation (2017M622254; 2016M600531), the Open Funds of the Shandong Province Key Laboratory of Detection Technology for Tumor Markers (KLDTTM2015-6; KLDTTM2015-9), and the Natural Science Foundation of Shandong Province (ZR201709240033). T. D. J. thanks the Royal Society for a Wolfson Research Merit Award.
Conflicts of interest
There are no conflicts to declare.Notes and references
- M. Gutova, G. M. Shackleford, V. Khankaldyyan, K. A. Herrmann, X. H. Shi, K. Mittelholtz, Y. Abramyants, M. S. Blanchard, S. U. Kim, A. J. Annala, J. Najbauer, T. W. Synold, M. D'Apuzzo, M. E. Barish, R. A. Moats and K. S. Aboody, Gene Ther., 2012, 20, 143 CrossRef PubMed.
- (a) M. Hamasaki, N. Furuta, A. Matsuda, A. Nezu, A. Yamamoto, N. Fujita, H. Oomori, T. Noda, T. Haraguchi, Y. Hiraoka, A. Amano and T. Yoshimori, Nature, 2013, 495, 389 CrossRef CAS PubMed; (b) R. Malli and W. F. Graier, Nat. Cell Biol., 2019, 21, 667–668 CrossRef CAS PubMed.
- T. Lieber, S. P. Jeedigunta, J. M. Palozzi, R. Lehmann and T. R. Hurd, Nature, 2019, 570, 380–384 CrossRef CAS PubMed.
- J. E. Lee, L. M. Westrate, H. Wu, C. Page and G. K. Voeltz, Nature, 2016, 540, 139 CrossRef CAS PubMed.
- (a) S. Erbas-Cakmak, S. Kolemen, A. C. Sedgwick, T. Gunnlaugsson, T. D. James, J. Yoon and E. U. Akkaya, Chem. Soc. Rev., 2018, 47, 2228–2248 RSC; (b) H.-W. Liu, L. Chen, C. Xu, Z. Li, H. Zhang, X.-B. Zhang and W. Tan, Chem. Soc. Rev., 2018, 47, 7140–7180 RSC; (c) J. Ning, W. Wang, G. Ge, P. Chu, F. Long, Y. Yang, Y. Peng, L. Feng, X. Ma and T. D. James, Angew. Chem., Int. Ed., 2019, 58, 9959 CrossRef CAS PubMed; (d) W. Zhang, J. Zhang, P. Li, J. Liu, D. Su and B. Tang, Chem. Sci., 2019, 10, 879–883 RSC; (e) X. Wang, P. Li, Q. Ding, C. Wu, W. Zhang and B. Tang, J. Am. Chem. Soc., 2019, 141, 2061–2068 CrossRef CAS PubMed; (f) J. Ning, T. Liu, P. Dong, W. Wang, G. Ge, B. Wang, Z. Yu, L. Shi, X. Tian, X. Huo, L. Feng, C. Wang, C. Sun, J. Cui, T. D. James and X. Ma, J. Am. Chem. Soc., 2019, 141, 1126–1134 CrossRef CAS PubMed; (g) F. Ding, Z. Chen, W. Y. Kim, A. Sharma, C. Li, Q. Ouyang, H. Zhu, G. Yang, Y. Sun and J. S. Kim, Chem. Sci., 2019, 10, 7023–7028 RSC; (h) Z. Liu, X. Zhou, Y. Miao, Y. Hu, N. Kwon, X. Wu and J. Yoon, Angew. Chem., Int. Ed., 2017, 56, 5812–5816 CrossRef CAS PubMed; (i) K. Dou, Q. Fu, G. Chen, F. Yu, Y. Liu, Z. Cao, G. Li, X. Zhao, L. Xia, L. Chen, H. Wang and J. You, Biomaterials, 2017, 133, 82–93 CrossRef CAS PubMed.
- (a) E. A. Halabi, Z. Thiel, N. Trapp, D. Pinotsi and P. Rivera-Fuentes, J. Am. Chem. Soc., 2017, 139, 13200–13207 CrossRef CAS PubMed; (b) S. J. Park, H. W. Lee, H.-R. Kim, C. Kang and H. M. Kim, Chem. Sci., 2016, 7, 3703–3709 RSC; (c) Q. Jin, L. Feng, D.-D. Wang, Z.-R. Dai, P. Wang, L.-W. Zou, Z.-H. Liu, J.-Y. Wang, Y. Yu, G.-B. Ge, J.-N. Cui and L. Yang, ACS Appl. Mater. Interfaces, 2015, 7, 28474–28481 CrossRef CAS PubMed; (d) Q. Jin, L. Feng, D.-D. Wang, J.-J. Wu, J. Hou, Z.-R. Dai, S.-G. Sun, J.-Y. Wang, G.-B. Ge, J.-N. Cui and L. Yang, Biosens. Bioelectron., 2016, 83, 193–199 CrossRef CAS PubMed; (e) L. Feng, Z.-M. Liu, L. Xu, X. Lv, J. Ning, J. Hou, G.-B. Ge, J.-N. Cui and L. Yang, Chem. Commun., 2014, 50, 14519–14522 RSC; (f) W. Chyan and R. T. Raines, ACS Chem. Biol., 2018, 13, 1810–1823 CrossRef CAS PubMed; (g) S. J. Park, Y. J. Kim, J. S. Kang, I. Y. Kim, K. S. Choi and H. M. Kim, Anal. Chem., 2018, 90, 9465–9471 CrossRef CAS PubMed; (h) D.-D. Wang, Q. Jin, L.-W. Zou, J. Hou, X. Lv, W. Lei, H.-L. Cheng, G.-B. Ge and L. Yang, Chem. Commun., 2016, 52, 3183–3186 RSC; (i) J. Wang, Q. Chen, N. Tian, W. Zhu, H. Zou, X. Wang, X. Li, X. Fan, G. Jiang and B. Z. Tang, J. Mater. Chem. B, 2018, 6, 1595–1599 RSC.
- (a) A. Wallabregue, D. Moreau, P. Sherin, P. Moneva Lorente, Z. Jarolímová, E. Bakker, E. Vauthey, J. Gruenberg and J. Lacour, J. Am. Chem. Soc., 2016, 138, 1752–1755 CrossRef CAS PubMed; (b) D. Xu, Y. Li, C.-Y. Poon, H.-N. Chan, H.-W. Li and M. S. Wong, Anal. Chem., 2018, 90, 8800–8806 CrossRef CAS PubMed; (c) M. H. Lee, N. Park, C. Yi, J. H. Han, J. H. Hong, K. P. Kim, D. H. Kang, J. L. Sessler, C. Kang and J. S. Kim, J. Am. Chem. Soc., 2014, 136, 14136–14142 CrossRef CAS PubMed; (d) A. R. Sarkar, C. H. Heo, L. Xu, H. W. Lee, H. Y. Si, J. W. Byun and H. M. Kim, Chem. Sci., 2016, 7, 766–773 RSC; (e) X. Liu, Y. Su, H. Tian, L. Yang, H. Zhang, X. Song and J. W. Foley, Anal. Chem., 2017, 89, 7038–7045 CrossRef CAS PubMed; (f) M.-Y. Wu, K. Li, Y.-H. Liu, K.-K. Yu, Y.-M. Xie, X.-D. Zhou and X.-Q. Yu, Biomaterials, 2015, 53, 669–678 CrossRef CAS PubMed; (g) L. Wang, X. Zhu, C. Xie, N. Ding, X. Weng, W. Lu, X. Wei and C. Li, Chem. Commun., 2012, 48, 11677–11679 RSC; (h) G. Chen, Q. Fu, F. Yu, R. Ren, Y. Liu, Z. Cao, G. Li, X. Zhao, L. Chen, H. Wang and J. You, Anal. Chem., 2017, 89, 8509–8516 CrossRef CAS PubMed; (i) A.-M. Luo, Y. Shao, K.-J. Zhang, Y.-W. Wang and Y. Peng, Chin. Chem. Lett., 2017, 28, 2009–2013 CrossRef CAS; (j) X. Sun, Y.-W. Wang and Y. Peng, Org. Lett., 2012, 14, 3420–3423 CrossRef CAS PubMed.
- J. R. Kuykendall, M. L. Taylor and M. S. Bogdanffy, Toxicol. Appl. Pharmacol., 1993, 123, 283–292 CrossRef CAS PubMed.
Footnote |
| † Electronic supplementary information (ESI) available. See DOI: 10.1039/c9cc05759e |
| This journal is © The Royal Society of Chemistry 2019 |

