Tanshinones inhibit hIAPP aggregation, disaggregate preformed hIAPP fibrils, and protect cultured cells
Baiping
Ren†
ab,
Yonglan
Liu†
b,
Yanxian
Zhang
b,
Mingzhen
Zhang
b,
Yan
Sun
c,
Guizhao
Liang
d,
Jianxiong
Xu
*ab and
Jie
Zheng
 *b
*b
aHunan Key Laboratory of Biomedical Nanomaterials and Devices, College of Life Science and Chemistry, Hunan University of Technology, Zhuzhou 412007, P. R. China. E-mail: xujianxiong8411@163.com
bDepartment of Chemical & Biomolecular Engineering, The University of Akron, Ohio 44325, USA. E-mail: zhengj@uakron.edu
cDepartment of Biochemical Engineering, Key Laboratory of Systems Bioengineering of the Ministry of Education School of Chemical Engineering and Technology, Tianjin University, Tianjin 300072, China
dKey Laboratory of Biorheological Science and Technology, Ministry of Education College, Chongqing University, Chongqing 400044, China
First published on 18th November 2017
Abstract
Misfolding and aggregation of amyloid peptides are the key pathological events in many neurodegenerative diseases. The development of effective inhibitors and drugs to prevent amyloid peptide aggregation is considered as an important therapeutic strategy for treating these diseases. We previously reported on tanshinones, ingredients from the Chinese herb Danshen (Salvia miltiorrhiza Bunge), as a potent inhibitor against amyloid-β1–42 (Aβ) aggregation and toxicity. Considering the common structural and aggregation features, and the correlation of type II diabetes (T2D) and Alzheimer's disease (AD), herein we examine the inhibition activity of two tanshinone I (TS1) and IIA (TS2) components on the aggregation and toxicity of hIAPP1–37 using combined experimental and computational approaches. Collective experimental data from ThT, CD, and AFM confirm that both tanshinones show comparable inhibition ability to reduce hIAPP aggregates by inhibiting the fibrillation process and changing the fibrillogenesis pathway, leading to the formation of some amorphous aggregates. More importantly, both tanshinones are capable of disassembling preformed hIAPP fibrils, but TS1 shows better potency in fibril dissembling than TS2. MTT and LDH assays also show that the tanshinones at very low concentrations of 5 μM can reduce the hIAPP-induced cell toxicity. Molecular dynamics (MD) simulations further reveal that both tanshinones preferentially bind to β-sheets to prevent lateral association of hIAPP aggregates and thus to inhibit fibril growth, explaining experimental observations. This work discovers that tanshinones act as common inhibitors to inhibit the aggregation of both hIAPP and Aβ, disaggregate preformed hIAPP and Aβ amyloid fibrils, and protect cells from hIAPP- and Aβ-induced toxicity, making them very promising agents against AD, T2D, and probably other amyloid-misfolding diseases.
1. Introduction
Type 2 diabetes mellitus (T2DM) is characterized histopathologically by the presence of fibrillar amyloid deposits that are mainly composed of human islet amyloid polypeptide (hIAPP).1 It has been widely reported that the misfolding and aggregation of hIAPP are involved in the pathology of diabetes mellitus, thus hIAPP is considered as a causative agent of type-II diabetes (T2D).2–4 hIAPP is a neuropancreatic hormone, consists of 37-amino acids, and is secreted from β-cells within the islet of Langerhans in the pancreas. For healthy people, hIAPP adopts random coil structures and is nontoxic to islet β-cells.5,6 However, under certain disease conditions, hIAPP undergoes structural transition from random coils of monomers to β-sheet-rich conformations of small amyloid oligomers and mature fibrils. It is generally accepted that transient, soluble amyloid oligomers are more toxic to neuron cells, while insoluble mature fibrils are either less toxic or relatively inert to cells.7 The presence of these hIAPP oligomers with typical β-sheet-rich structures in β-cells leads to their apoptosis and ultimately T2D.8 Significant efforts have been made to develop different inhibitors from bench to bedside (e.g. polymers,9–13 nanoparticles,14,15 peptides16,17 and small organic molecules18–21) to interfere with the expression and aggregation of hIAPP peptides or to eliminate the existing hIAPP aggregates. Additionally, the structure and function-inspired rational design also leads to some inhibitors, including a multifunctional ligand (ML)22 and Z-Phe-Ala-diazomethylketone (PADK).23 While most inhibitors present specific inhibitory effects on one amyloid peptide, some of them have been reported to have dual or multiple inhibition effects on different amyloid peptides. A well-known example is EGCG. EGCG can interact with natively unfolded polypeptides and alter their self-assembly pathways to form nontoxic unstructured oligomers, resulting in the inhibition of the fibrillogenesis of α-synuclein, amyloid-β and tau proteins. More promisingly, the high binding affinity makes EGCG capable of disassembling the preformed amyloid fibrils into nontoxic, smaller, and amorphous protein aggregates.24–26 Similarly, 1,2,3,4,6-penta-O-galloyl-D-glucopyranose (PGG) presented a dual inhibition ability to prevent the misfolding and aggregation of hIAPP and Aβ, as well as to disassemble the preformed Aβ fibrils.27,28 Curcumin also exhibited the inhibition and disassembly ability against the fibril formation of Aβ and α-synuclein in a dose manner. All these small organic inhibitors often contain multiple benzene-ring-like groups to form a planar structure, which allows selective binding to aromatic rings of amyloid peptides to interfere with their initial misfolding and subsequent aggregation.29,30 Unfortunately, none of these inhibitors, even with their promising inhibitory ability, has passed large-scale clinical trials due to complicated and unknown reasons, including poor biocompatibility, low binding affinity and selectivity, and/or low permeability across the blood–brain barrier (BBB). On the other hand, inhibition of hIAPP structural transition and aggregation, as well as the clearance of the preformed hIAPP aggregates, is still considered as a promising strategy to possibly cure or reverse T2D.Tanshinones, extracted from the dry roots of Salvia miltiorrhiza Bge, have been widely used as approved pharmacological compounds in China and other Asian countries. Tanshinones include the two major compounds, tanshinone I (TS1) and tanshinone IIA (TS2), which have often been used alone or in combination with other herbal drugs to treat cardiovascular diseases (angina pectoris), myocardial infarction, and stroke since 1970s.31–34 For instance, Fufang Tanshinone Diwan ( ), a very popular Chinese Cardiotonic Pill, combines tanshinones and two other traditional Chinese herbs of pseudo-ginseng and borneol for both the prevention and the active management of cardiovascular diseases.35 Tanshinones were also reported to have a very excellent neuroprotection effect. Shi and co-workers36 found that TS2 protected neurons from Aβ25–35-induced neurotoxicity, increased the viability of neurons, decreased the expression of phosphorylated tau in neurons induced by Aβ25–35, improved the impairment of the cell cultrastructure, maintained the normal expression of P35 on peripheral membranes, and decreased p25 expression in the cytoplasm. Li and co-workers37 injected Aβ1–40 into the hippocampus of rats and treated the rats with tanshinones to study the effect of tanshinones on the neuropathological changes. The result showed that the level of AChE positive fibers of each subfield in Aβ1–40-injected hippocampus decreased significantly as compared with those of control. After treatment with tanshinones, the results showed a significant negative correlation between the area percentage of AChE positive fibers and the number of iNOS positive neural cells in CA, CA2, CA3, and dentate gyrus subfields. Xia and co-workers38 injected TS2 into hypoxia-ischemia brain damaged rat. After the treatment they found that TS2 significantly reduced the severity of brain injury, as indicated by the increase in ipsilateral brain weight and neuron density, compared with those of sham-operated animals.
Apart from their neuroprotection effect, tanshinones also show an ability to kill different human tumor cells. Chen and co-workers39 reported that tanshinone I not only inhibited the migration, invasion, and gelatinase activity of macro-phage-conditioned medium-stimulated CL1-5 cells in vitro, but also reduced tumorigenesis and metastasis in CL1-5-bearing immunodeficient mice. Fu and co-workers40 found that tanshinone IIA increased oxygen free radical scavengers, prevented lipid peroxidation, up-regulated the Bcl-2/Bax ratio, and finally protected myocytes against oxidative stress-induced damage and apoptosis in adult rats. Wang and co-workers41 injected tanshinone IIA into mice bearing human breast cancer xenografts to examine its anticancer activity. Tanshinone IIA exhibited a dose- and time-dependent inhibitory effect on cell growth, in which it significantly inhibited the colony formation and BrdU incorporation of human breast cancer cells. These studies have demonstrated tanshinone-based drugs due to their safety, biocompatibility, and BBB crossing and targeting abilities.
Our previous work has shown that tanshinone I (TS1) and tanshinone IIA (TS2) present strong inhibition to prevent Aβ aggregation, disaggregate Aβ fibers, and reduce Aβ-induced cell toxicity in vitro.42 In addition, emerging evidence from clinical studies has shown that T2DM and Alzheimer's disease (AD) are closely related to each other.18,19 AD patients show a higher risk to develop T2D, and vice versa. Considering the common structural and aggregation features, and the correlation of T2D and AD,43–46 herein we hypothesize that TS1 and TS2 should have a similar inhibition effect on hIAPP aggregation. To test this hypothesis, we combined experimental and computational methods to examine the inhibition effects of two tanshinone molecules on hIAPP aggregation and toxicity using thioflavin T (ThT) fluorescence, atomic force microscopy (AFM), circular dichroism (CD), cell viability assays (MTT), cytotoxicity assays (LDH), and molecular dynamics (MD) simulations. Our experimental data confirm the new functions of tanshinones, i.e. both TS1 and TS2 can inhibit hIAPP aggregation, disaggregate the preformed hIAPP fibrils, and protect cells from hIAPP-induced toxicity. MD simulations further reveal different binding information (binding sites, affinities, and populations) between TS1–hIAPP and TS2–hIAPP, which provides atomic insights into the underlying inhibition mechanisms. In line with our previous study, tanshinones are very promising anti-amyloidogenic inhibitors for inhibiting both hIAPP and Aβ aggregation in AD and T2D.
2. Materials and methods
Materials
Human islet amylin (hIAPP1–37) with more than 95% purity was purchased from Bachem AG (Bubendorf Switzerland). Tanshinone I (97%), tanshinone IIA (97%) 1,1,1,3,3,3-hexafluoro-2-propanol (HFIP, 99.9%), 10 mM PBS buffer (PH = 7.4), dimethyl sulfoxide (DMSO, 99.9%), and thioflavin T (ThT, 98%) were purchased from Sigma-Aldrich (St. Louis, MO). All other chemicals used in this work were of the highest grade.Peptide preparation
Human islet amylin (hIAPP1–37) peptides were purchased in lyophilized form and stored at −20 °C immediately after arrival. In order to break the preformed hIAPP1–37 aggregations and obtain the monomer, 1.0 mg of pre-packaged hIAPP1–37 was dissolved into 1 ml of HFIP for 2 h, sonicated for 30 minutes, and centrifuged at 14![[thin space (1/6-em)]](https://www.rsc.org/images/entities/char_2009.gif) 000 rpm and 4 °C for 30 minutes. 156 μl of the supernatant was extracted, sub-packaged, frozen in a refrigerator at −80 °C and then lyophilized using a freeze-dryer. 30 μl of DMSO was used to dissolve 0.156 mg of sub-packaged hIAPP1–37 peptide. In order to prepare 20 μM hIAPP1–37 solution, 30 μl of DMSO-hIAPP1–37 solution was dissolved into 2 ml of PBS buffer (10 mM).
000 rpm and 4 °C for 30 minutes. 156 μl of the supernatant was extracted, sub-packaged, frozen in a refrigerator at −80 °C and then lyophilized using a freeze-dryer. 30 μl of DMSO was used to dissolve 0.156 mg of sub-packaged hIAPP1–37 peptide. In order to prepare 20 μM hIAPP1–37 solution, 30 μl of DMSO-hIAPP1–37 solution was dissolved into 2 ml of PBS buffer (10 mM).
Thioflavin T (ThT) fluorescence assay
Solutions of hIAPP1–37/tanshinone I/tanshinone IIA/hIAPP1–37–tanshinone I/hIAPP1–37–tanshinone IIA were prepared in 10 μM ThT–Tris buffer (2 mM ThT solution was prepared as stock solution and then diluted in tris-buffer to 10 μM concentration) and ThT assays were performed using a LS-55 fluorescence spectrometer (Petkin-Elmer Corp, Waltham, MA). The ThT fluorescence emission intensity of each sample was recorded between 470 and 500 nm and the excitation wavelength was 450 nm. Each of the ThT fluorescence experiment was tested at least three times.Fibril elimination assay
20 μM hIAPP1–37 monomers were incubated for 48 h to form mature fibrils. To test the effect of tanshinone I and tanshinone IIA on the extent of elimination of hIAPP1–37 fibrils, 10 μM of tanshinone I and tanshinone IIA were added to the pre-prepared fibril solutions, respectively. All the samples were incubated at 37 °C for 30 h and the time-dependent fibril amount change was tested by using the ThT assay.Dynamic light scattering (DLS) size distribution assay
The self-aggregation properties of tanshinone I and tanshinone IIA were evaluated in PBS solution using the dynamic light scattering (DLS) method. Samples were prepared at the concentrations of 5 μM, 10 μM, 20 μM, 40 μM and 100 μM. The size distribution was measured on a Zetasizer (Malvern, UK) with incubation times of 0 h and 20 h.Tapping-mode atomic force microscopy (AFM)
AFM images of the morphology changes of hIAPP1–37 peptides mediated by tanshinone I and tanshinone IIA at different incubation periods over 20 h was acquired by using a Nanoscope III multimode AFM with an Extender electronics module (Veeco Corp, Santa Barbara, CA). Breifly, 20 μl of sample from each incubation time was deposited on a piece of mica for 1 min. The sample was then washed several times with DI water, and no additional amyloids were added so that no unincorporated amyloids were left before imaging. Imaging was carried out in tapping mode (at 512 × 512 pixel resolution with a typical scan rate of 1.0–2.0 Hz and the vertical tip oscillation frequency of 250–350 kHz). More than six different locations were scanned and recorded.Circular dichroism (CD) spectroscopy
All spectra were obtained using a J-1500 spectropolarimeter (Jasco Inc, Japan) under the continuous scanning mode at room temperature. The spectra of the solution samples were recorded over a wavelength range of 190–250 nm using a cuvette of 1 mm pathlength at a scan speed of 50 nm min−1 and a time constant of 0.125 s. All spectra were corrected by subtracting the buffer baseline and/or the absorbance from tanshinone I and tanshinone IIA. Briefly, 150 μl of hIAPP1–37/tanshinone I/tanshinoneIIA/hIAPP1–37–tanshinone I/hIAPP1–37–tanshinone IIA samples that were incubated for 0 h, 5 h, 10 h, and 20 h were measured individually. The secondary structure contents of each sample were calculated by using the self-consistent method (CDSSTR program) in CDpro analysis software.Cell culture
Rat insulinoma cells were purchased from ATCC (Manassas, VA, USA). Cells were maintained in a humidified incubator with 5% CO2 at 37 °C in the sterile-filtered RPMI-1640 medium supplemented with 10% fetal bovine serum and 1% penicillin/streptomycin. Cells were plated at a T75 flask until they have covered over 80% of the surface area and then transferred to a 96-well cell culture plate with a density of 105 per well.MTT and LDH cell toxicity assay
Cells were plated in 96-well plates (104 per well) for 24 h before carrying out the MTT and LDH assays. After removing the medium, cells were washed twice using PBS buffer. Then hIAPP1–37, tanshinone I, tanshinone IIA, hIAPP1–37–tanshinone I, hIAPP1–37–tanshinone IIA solutions were separately added into the wells, followed by incubation for 24 h and 48 h. In the MTT experiment the culture medium was removed and 100 μl of fresh medium and 20 μl of MTT solution (5 mg ml−1) were added to the wells. After incubation for 4 h, the medium was removed and 150 μl of DMSO was added to the wells to dissolve the formazan crystals. Finally, absorbance was recorded at 570 nm using a microplate reader (Bio-RAD 680, USA). In the LDH experiment cytotoxicity was assessed using the LDH assay kit (Thermo, USA) according to the manufacturer's instructions. Briefly, 10 μl of Lysis Buffer (10×) was added to the wells containing untreated control cells prior to the assay to induce maximum LDH release. After incubation for 45 min, 50 μl of the supernatant form each well (including untreated control, treated and maximum LDH release groups) was transferred to a new 96-well plate. Subsequently, 50 μl of the reaction mixture was added to each sample well and incubated at room temperature for 30 minutes in the dark place. Stop solution (50 ml) was added to each well and the absorbance was measured using a microplate reader (Bio-RAD 680, USA) at the wavelengths of 490 nm and 680 nm. Both of these two assays were carried out with 12 replicates for each culture.Molecular dynamics simulations
The initial hIAPP1–37 pentamer structure was kindly provided by Tycko's group.47 The molecular structures of TS1 and TS2 were generated using the Gaussian program, and the force field parameters of TS1 and TS2 were developed in a format compatible to the CHARMM27 force field.48 In order to better map possible binding sites between TS1 or TS2 and hIAPP1–37, Patchdock and Firedock49 were conducted in the implicit-solvent environments. Ten binding sites with the highest scorings in docking were chosen to establish the hIAPP:TS1 or hIAPP:TS2 complexes. Such a modeling protocol allows obtaining the comprehensive examination of binding sites of TS towards hIAPP by assigning the most possible initial coordinates. Then, each hIAPP–tanshinone was solvated in the explicit solvent box with a minimal margin of 15 Å from any edge of water box to any solute atom. Cl− and Na+ ions were added to neutralize the system and mimic 150 mM ionic strength. Each simulation system was minimized in energy using the combined Steepest decent and conjugate gradient methods. After energy minimization, the explicit-solvent all-atom MD simulations were conducted using the NAMD2.91 program, the CHARMM27 force field and the CMAP potential correction.50 The Langevin method was used to maintain the temperature of 300 K and the pressure of 1 atm in the NPT simulation systems. Short-range van der Waals (vdW) interactions and long-range electrostatic forces were described using the switch functions and force-shifted methods with a cutoff of 14 Å, respectively. The trajectories were saved every 2 ps for the analysis. All analyses were performed using the CHARMM scripts, VMD, and in-house Tcl codes.3. Results and discussion
3.1. Tanshinones inhibits hIAPP1–37 fibrillization
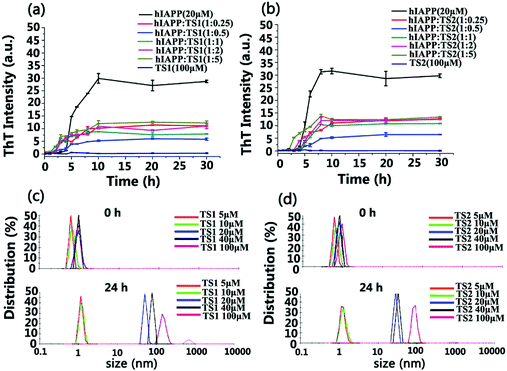
Scheme 1 showed that both tanshinone I (TS1) and tanshinone IIA (TS2) possess a similar aromatic backbone, and only differ by a pendent group (–CH3). First, we used the ThT fluorescence assay to examine the ability of both TS1 and TS2 to modulate hIAPP1–37 aggregation kinetics (Fig. 1a and b). hIAPP at a fixed concentration of 20 μM was incubated with TS1 or TS2 at different hIAPP![[thin space (1/6-em)]](https://www.rsc.org/images/entities/char_2009.gif) :
:![[thin space (1/6-em)]](https://www.rsc.org/images/entities/char_2009.gif) TS molar ratios (1
TS molar ratios (1![[thin space (1/6-em)]](https://www.rsc.org/images/entities/char_2009.gif) :
:![[thin space (1/6-em)]](https://www.rsc.org/images/entities/char_2009.gif) 0.25, 1
0.25, 1![[thin space (1/6-em)]](https://www.rsc.org/images/entities/char_2009.gif) :
:![[thin space (1/6-em)]](https://www.rsc.org/images/entities/char_2009.gif) 0.5, 1
0.5, 1![[thin space (1/6-em)]](https://www.rsc.org/images/entities/char_2009.gif) :
:![[thin space (1/6-em)]](https://www.rsc.org/images/entities/char_2009.gif) 1, 1
1, 1![[thin space (1/6-em)]](https://www.rsc.org/images/entities/char_2009.gif) :
:![[thin space (1/6-em)]](https://www.rsc.org/images/entities/char_2009.gif) 2, and 1
2, and 1![[thin space (1/6-em)]](https://www.rsc.org/images/entities/char_2009.gif) :
:![[thin space (1/6-em)]](https://www.rsc.org/images/entities/char_2009.gif) 5) at 37 °C for 30 h. As a control, either TS1 or TS2 did not produce any ThT signals, suggesting that tanshinones have no influence on ThT fluorescence. Pure hIAPP1–37 aggregation presented a typical nucleation–polymerization aggregation profile, starting with a lag phase of ∼4 h, followed by a rapid growth phase from 4 to 10 h, and ending at a stable plateau of ∼30 after 10 h. When incubating freshly prepared hIAPP with either tanshinone at all different concentrations, both tanshinones imposed strong inhibition effects on the growth phase by decreasing its aggregation rate and the final fibrillization phases by reducing its fibril formation, but they had little influence on the lag phase. In all TS1 and TS2 cases, the inhibition effect of both tanshinones on hIAPP fibrillation kinetics was also sensitive to the molar ratios of tanshinones:hIAPP, i.e. both tanshinones at all different concentrations showed an obvious inhibition effect on hIAPP fibrillation to different extents. Both tanshinones exhibited an optimal molar ratio of hIAPP
5) at 37 °C for 30 h. As a control, either TS1 or TS2 did not produce any ThT signals, suggesting that tanshinones have no influence on ThT fluorescence. Pure hIAPP1–37 aggregation presented a typical nucleation–polymerization aggregation profile, starting with a lag phase of ∼4 h, followed by a rapid growth phase from 4 to 10 h, and ending at a stable plateau of ∼30 after 10 h. When incubating freshly prepared hIAPP with either tanshinone at all different concentrations, both tanshinones imposed strong inhibition effects on the growth phase by decreasing its aggregation rate and the final fibrillization phases by reducing its fibril formation, but they had little influence on the lag phase. In all TS1 and TS2 cases, the inhibition effect of both tanshinones on hIAPP fibrillation kinetics was also sensitive to the molar ratios of tanshinones:hIAPP, i.e. both tanshinones at all different concentrations showed an obvious inhibition effect on hIAPP fibrillation to different extents. Both tanshinones exhibited an optimal molar ratio of hIAPP![[thin space (1/6-em)]](https://www.rsc.org/images/entities/char_2009.gif) :
:![[thin space (1/6-em)]](https://www.rsc.org/images/entities/char_2009.gif) tanshinones = 1
tanshinones = 1![[thin space (1/6-em)]](https://www.rsc.org/images/entities/char_2009.gif) :
:![[thin space (1/6-em)]](https://www.rsc.org/images/entities/char_2009.gif) 0.5 to induce the strongest inhibition of hIAPP fibrillization, and TS1 and TS2 reduced ∼77% and ∼80% of hIAPP fibrils, respectively, clearly indicating the inhibition of fibril formation or less β sheet formation due to the presence of tanshinones. In comparison with other flavonoid derivates, TS exhibited a much higher inhibition efficiency at the same molar ratio of TS
0.5 to induce the strongest inhibition of hIAPP fibrillization, and TS1 and TS2 reduced ∼77% and ∼80% of hIAPP fibrils, respectively, clearly indicating the inhibition of fibril formation or less β sheet formation due to the presence of tanshinones. In comparison with other flavonoid derivates, TS exhibited a much higher inhibition efficiency at the same molar ratio of TS![[thin space (1/6-em)]](https://www.rsc.org/images/entities/char_2009.gif) :
:![[thin space (1/6-em)]](https://www.rsc.org/images/entities/char_2009.gif) hIAPP (1
hIAPP (1![[thin space (1/6-em)]](https://www.rsc.org/images/entities/char_2009.gif) :
:![[thin space (1/6-em)]](https://www.rsc.org/images/entities/char_2009.gif) 0.5).51,52 However, at a lower molar ratio of hIAPP
0.5).51,52 However, at a lower molar ratio of hIAPP![[thin space (1/6-em)]](https://www.rsc.org/images/entities/char_2009.gif) :
:![[thin space (1/6-em)]](https://www.rsc.org/images/entities/char_2009.gif) tanshinones = 1
tanshinones = 1![[thin space (1/6-em)]](https://www.rsc.org/images/entities/char_2009.gif) :
:![[thin space (1/6-em)]](https://www.rsc.org/images/entities/char_2009.gif) 0.25, TS1 and TS2 reduced the total amount of hIAPP fibrils by ∼63% and ∼60%, respectively, suggesting that tanshinones may not have sufficient amounts to interact with hIAPP and thus to prevent hIAPP aggregation effectively. At the higher hIAPP
0.25, TS1 and TS2 reduced the total amount of hIAPP fibrils by ∼63% and ∼60%, respectively, suggesting that tanshinones may not have sufficient amounts to interact with hIAPP and thus to prevent hIAPP aggregation effectively. At the higher hIAPP![[thin space (1/6-em)]](https://www.rsc.org/images/entities/char_2009.gif) :
:![[thin space (1/6-em)]](https://www.rsc.org/images/entities/char_2009.gif) tanshinone ratios of 1
tanshinone ratios of 1![[thin space (1/6-em)]](https://www.rsc.org/images/entities/char_2009.gif) :
:![[thin space (1/6-em)]](https://www.rsc.org/images/entities/char_2009.gif) 1, 1
1, 1![[thin space (1/6-em)]](https://www.rsc.org/images/entities/char_2009.gif) :
:![[thin space (1/6-em)]](https://www.rsc.org/images/entities/char_2009.gif) 2, and 1
2, and 1![[thin space (1/6-em)]](https://www.rsc.org/images/entities/char_2009.gif) :
:![[thin space (1/6-em)]](https://www.rsc.org/images/entities/char_2009.gif) 5, TS1 reduced 70%, 63%, and 58% of hIAPP fibrils, while TS2 reduced 69%, 66%, and 60% of hIAPP fibrils. So, the overall inhibition efficiency of both tanshinones decreased with their concentrations.
5, TS1 reduced 70%, 63%, and 58% of hIAPP fibrils, while TS2 reduced 69%, 66%, and 60% of hIAPP fibrils. So, the overall inhibition efficiency of both tanshinones decreased with their concentrations.
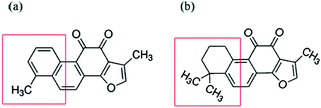 | ||
| Scheme 1 Chemical structure of (a) tanshinone I (TS1) and (b) tanshinone IIA (TS2). Structural differences are highlighted in a red box. | ||
Regarding the reduced inhibition efficiency for high concertation of tanshinones, we speculate that tanshinones may self-aggregate into some aggregates as their concentration increased. To support this speculation, we characterized the size distribution of TS1 and TS2 in PBS solutions at different concentrations of 5, 10, 20, 40 and 100 μM using dynamic light scattering (DLS). As shown in Fig. 1c and d, the initial size peaks of both TS1 and TS2 of different concentrations at 0 h were located in a small range of 0.5–1.0 nm. Upon 24 h of incubation, both TS1 and TS2 at the lower concentrations of 5 or 10 μM were able to retain their initial sizes, as indicated by a sharp peak centered at ∼1 nm. However, when increasing tanshinone concentrations above 40 μM, significant size changes of tanshinones were observed. TS1 shifted its major peaks to 48 nm at 20 μM, 79 nm at 40 μM, and 105 nm at 100 μM, while TS2 shifted its peaks to 28 nm at 20 μM, 34 nm at 40 μM, and 85 nm at 100 μM. So, the size changes of both tanshinones with time clearly indicate that both tanshinones can self-aggregate into larger species at high concentrations, and it is likely that the presence of hydrophobic aromatic rings in tanshinones is a major driving force for their self-aggregation, which in turn reduce active binding sites to hIAPP and cause the decrease of hIAPP inhibition efficiency.
Furthermore, we applied AFM and CD spectroscopy to characterize the tanshinone-induced structural transition and morphological change of hIAPP aggregates. Based on the ThT data, we only focused on the strong inhibition cases at the molar ratio of hIAPP![[thin space (1/6-em)]](https://www.rsc.org/images/entities/char_2009.gif) :
:![[thin space (1/6-em)]](https://www.rsc.org/images/entities/char_2009.gif) tanshinones = 1
tanshinones = 1![[thin space (1/6-em)]](https://www.rsc.org/images/entities/char_2009.gif) :
:![[thin space (1/6-em)]](https://www.rsc.org/images/entities/char_2009.gif) 0.5 or 1
0.5 or 1![[thin space (1/6-em)]](https://www.rsc.org/images/entities/char_2009.gif) :
:![[thin space (1/6-em)]](https://www.rsc.org/images/entities/char_2009.gif) 1. As shown in Fig. 2, pure hIAPP (20 μM) can quickly form many short, straight protofibrils within 5 h incubation, consistent with the ThT result. After 10 h more hIAPP protofibrils were formed, and after 20 h highly densed mature fibrils were formed. But when tanshinones are co-incubated with hIAPP solutions, the aggregation kinetics and morphologies of hIAPP were dramatically changed. In the cases of hIAPP
1. As shown in Fig. 2, pure hIAPP (20 μM) can quickly form many short, straight protofibrils within 5 h incubation, consistent with the ThT result. After 10 h more hIAPP protofibrils were formed, and after 20 h highly densed mature fibrils were formed. But when tanshinones are co-incubated with hIAPP solutions, the aggregation kinetics and morphologies of hIAPP were dramatically changed. In the cases of hIAPP![[thin space (1/6-em)]](https://www.rsc.org/images/entities/char_2009.gif) :
:![[thin space (1/6-em)]](https://www.rsc.org/images/entities/char_2009.gif) tanshinones = 1
tanshinones = 1![[thin space (1/6-em)]](https://www.rsc.org/images/entities/char_2009.gif) :
:![[thin space (1/6-em)]](https://www.rsc.org/images/entities/char_2009.gif) 1, at the first 5 h, both hIAPP–TS1 and hIAPP–TS2 mixtures exhibited a large amount of spherical aggregates with average sizes of 3–5 nm. Upon 20 h of incubation, samples containing TS1 or TS2 contained only a very small amount of small fibrils (Fig. 2, the 2nd and 3rd rows). Such tanshinone-induced inhibition effect became even more pronounced at hIAPP
1, at the first 5 h, both hIAPP–TS1 and hIAPP–TS2 mixtures exhibited a large amount of spherical aggregates with average sizes of 3–5 nm. Upon 20 h of incubation, samples containing TS1 or TS2 contained only a very small amount of small fibrils (Fig. 2, the 2nd and 3rd rows). Such tanshinone-induced inhibition effect became even more pronounced at hIAPP![[thin space (1/6-em)]](https://www.rsc.org/images/entities/char_2009.gif) :
:![[thin space (1/6-em)]](https://www.rsc.org/images/entities/char_2009.gif) tanshinones = 1
tanshinones = 1![[thin space (1/6-em)]](https://www.rsc.org/images/entities/char_2009.gif) :
:![[thin space (1/6-em)]](https://www.rsc.org/images/entities/char_2009.gif) 0.5. It can be seen that during 20 h of incubation, almost no hIAPP fibrils were observed (Fig. 2, the 4th and 5th rows). Consistent with the ThT data, the samples containing TS1 or TS2 (10 μM) significantly slowed down hIAPP fibrillization and were almost devoid of fibrils during the entire aggregation procedure.
0.5. It can be seen that during 20 h of incubation, almost no hIAPP fibrils were observed (Fig. 2, the 4th and 5th rows). Consistent with the ThT data, the samples containing TS1 or TS2 (10 μM) significantly slowed down hIAPP fibrillization and were almost devoid of fibrils during the entire aggregation procedure.
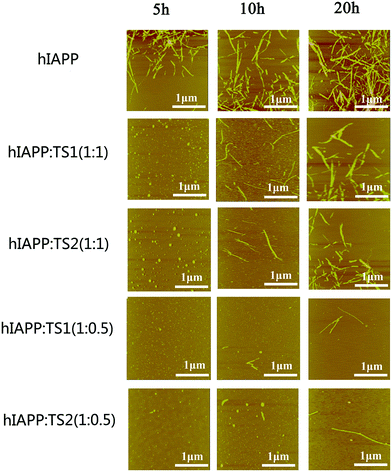 | ||
Fig. 2 AFM images for aggregated samples from pure hIAPP1–37 (20 μM) and mixed hIAPP–tanshinones at different molar ratios of hIAPP![[thin space (1/6-em)]](https://www.rsc.org/images/entities/char_2009.gif) : :![[thin space (1/6-em)]](https://www.rsc.org/images/entities/char_2009.gif) tanshinones (1 tanshinones (1![[thin space (1/6-em)]](https://www.rsc.org/images/entities/char_2009.gif) : :![[thin space (1/6-em)]](https://www.rsc.org/images/entities/char_2009.gif) 0.5 and 1 0.5 and 1![[thin space (1/6-em)]](https://www.rsc.org/images/entities/char_2009.gif) : :![[thin space (1/6-em)]](https://www.rsc.org/images/entities/char_2009.gif) 1) upon 5, 10, and 20 h of incubation. 1) upon 5, 10, and 20 h of incubation. | ||
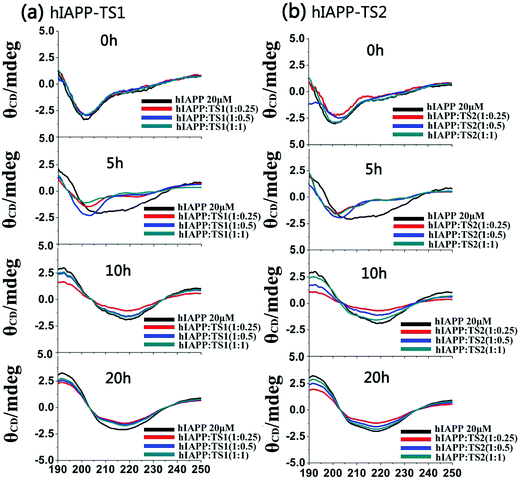
Fig. 3 shows the CD spectra of hIAPP1–37 in the absence and presence of tanshinones at different molar ratios (1![[thin space (1/6-em)]](https://www.rsc.org/images/entities/char_2009.gif) :
:![[thin space (1/6-em)]](https://www.rsc.org/images/entities/char_2009.gif) 0.25, 1
0.25, 1![[thin space (1/6-em)]](https://www.rsc.org/images/entities/char_2009.gif) :
:![[thin space (1/6-em)]](https://www.rsc.org/images/entities/char_2009.gif) 0.5, and 1
0.5, and 1![[thin space (1/6-em)]](https://www.rsc.org/images/entities/char_2009.gif) :
:![[thin space (1/6-em)]](https://www.rsc.org/images/entities/char_2009.gif) 1). To be consistent with the timescale used in ThT and AFM tests, CD data were recorded at 0, 5, 10, and 20 h, which cover the lag, growth, and equilibrium phases during the entire hIAPP1–37 aggregation process. Clearly, during 20 h of incubation, pure hIAPP experienced a typical structural transition from the initial random coils (at peak ∼198 nm) to the β-sheet structures (two characteristic peaks at 195 nm and 215 nm). The initial/final secondary structure contents of hIAPP at 0/20 h were 23%/48% of β-sheet, 20%/33% of α-helix, and 57%/19% of random coil, indicating that hIAPP increases its β-sheet and α-helical structures at the expense of random coils. However, in the presence of TS1, there was a decreased shift toward the β-sheet dominated structure, as indicated by the reduction of peak intensities at 195 nm and 215 nm. As a result, upon 20 h of incubation, TS1-treated hIAPP samples contained ∼37%, 33%, and 35% of β-sheet structures at hIAPP
1). To be consistent with the timescale used in ThT and AFM tests, CD data were recorded at 0, 5, 10, and 20 h, which cover the lag, growth, and equilibrium phases during the entire hIAPP1–37 aggregation process. Clearly, during 20 h of incubation, pure hIAPP experienced a typical structural transition from the initial random coils (at peak ∼198 nm) to the β-sheet structures (two characteristic peaks at 195 nm and 215 nm). The initial/final secondary structure contents of hIAPP at 0/20 h were 23%/48% of β-sheet, 20%/33% of α-helix, and 57%/19% of random coil, indicating that hIAPP increases its β-sheet and α-helical structures at the expense of random coils. However, in the presence of TS1, there was a decreased shift toward the β-sheet dominated structure, as indicated by the reduction of peak intensities at 195 nm and 215 nm. As a result, upon 20 h of incubation, TS1-treated hIAPP samples contained ∼37%, 33%, and 35% of β-sheet structures at hIAPP![[thin space (1/6-em)]](https://www.rsc.org/images/entities/char_2009.gif) :
:![[thin space (1/6-em)]](https://www.rsc.org/images/entities/char_2009.gif) TS1 = 1
TS1 = 1![[thin space (1/6-em)]](https://www.rsc.org/images/entities/char_2009.gif) :
:![[thin space (1/6-em)]](https://www.rsc.org/images/entities/char_2009.gif) 0.25, 1
0.25, 1![[thin space (1/6-em)]](https://www.rsc.org/images/entities/char_2009.gif) :
:![[thin space (1/6-em)]](https://www.rsc.org/images/entities/char_2009.gif) 0.5, and 1
0.5, and 1![[thin space (1/6-em)]](https://www.rsc.org/images/entities/char_2009.gif) :
:![[thin space (1/6-em)]](https://www.rsc.org/images/entities/char_2009.gif) 1, respectively. Similarly, TS2 also exhibited a similar inhibition ability to interfere with the structural transition of hIAPP from random coils to β-sheets, leading to the final β-sheet content of ∼36–38% in all three cases. The change in the CD spectra consisted of the ThT and AFM data for hIAPP aggregation. These results indicate that the addition of tanshinones inhibits the conformational change of hIAPP and thereby inhibits amyloid formation.
1, respectively. Similarly, TS2 also exhibited a similar inhibition ability to interfere with the structural transition of hIAPP from random coils to β-sheets, leading to the final β-sheet content of ∼36–38% in all three cases. The change in the CD spectra consisted of the ThT and AFM data for hIAPP aggregation. These results indicate that the addition of tanshinones inhibits the conformational change of hIAPP and thereby inhibits amyloid formation.
3.2. Tanshinones disassemble preformed hIAPP1–37 fibrils
The removal or remodeling of the existing amyloid fibrils is another important therapeutic strategy to treat amyloid diseases. In our previous work, tanshinones can not only inhibit Aβ aggregation, but also disassemble the preformed Aβ fibrils. Thus, it is possible that tanshinones could disintegrate the preformed hIAPP fibrils. To test this possibility, we added TS1 or TS2 (10 μM) to a solution containing hIAPP1–37 fibrils that were produced by incubation of the hIAPP monomer (20 μM) solution for 24 h. In Fig. 4a, the fluorescence signal dropped immediately from a plateau value of 31 to new plateau values of 5 for the TS1-treated hIAPP sample and 12 for the TS2-treated hIAPP sample within 10 h, while the ThT fluorescence intensity almost did not change after 10 h. A comparison of the ThT data before and after adding tanshinones showed that TS1 and TS2 reduced ∼83% and 67% of the preformed hIAPP fibrils, respectively. Parallel evidence from AFM images (Fig. 4b) also confirmed that upon incubation of hIAPP fibrils with TS1 for 5 h, the preformed fibrils were either significantly truncated into shorter fibrils or disintegrated into small spherical particles of 2–5 nm and large amorphous aggregates of 3–15 nm. This effect became more pronounced at 10 h, so that almost no mature fibrils were observed. TS2 showed similar AFM images for hIAPP disaggregation to TS1. The disaggregation results showed that both tanshinones were capable of dissociating preformed hIAPP fibrils, while TS1 showed the better disassemble ability to disrupt hIAPP fibrils than TS2 as indicated by ThT data.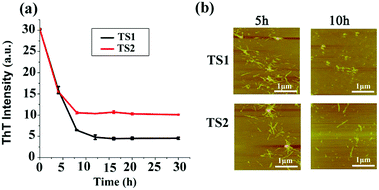 | ||
| Fig. 4 Disaggregation effect of TS1 (10 μM) and TS2 (10 μM) on hIAPP mature fibers as characterized by (a) ThT fluorescence and (b) AFM. (b) Fibers at 5 and 10 h. | ||
3.3. Tanshinones reduce hIAPP-induced cell toxicity
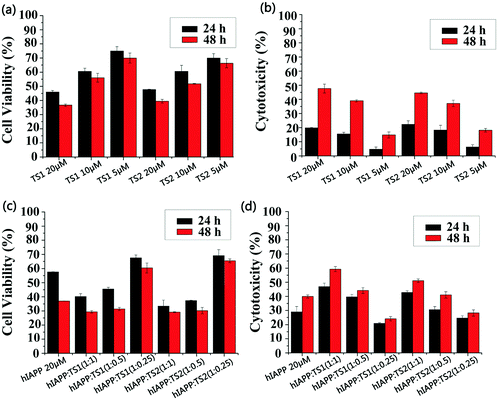
We used MTT and LDH assays to investigate whether tanshinones can protect neuronal cells from hIAPP-induced toxicity. First, the RIN-m5F cell line was used to study the cell toxicity, in which the absorbance of the cell media containing RIN-m5F cells was measured, and the value is regarded as 100% of the cells being viable. Pure hIAPP was co-incubated with RIN-m5F cells for 24 h and 48 h. Two control experiments were conducted. First, pure hIAPP (20 μM) led to 57% and 37% cell viability (MTT assay, Fig. 5c) and 29% and 40% cell apoptosis (LDH assay, Fig. 5d) upon 24 h and 48 h of incubation with cells, indicating that hIAPP aggregates are highly toxic to the cells. In Fig. 5a, both TS1 and TS2 alone presented dose-dependent cell toxicity. Specifically, upon 24 h of incubation of cells with TS1 of different concentrations, TS1-induced cell viability decreased from 75% to 46% and TS1-induced cell apoptosis increased from 4% to 20% as the TS1 concentrations increased from 5 μM to 20 μM. When incubation time increased to 48 h, cell viability was slightly reduced to 70–36% using the MTT assay, while cell apoptosis was largely increased to 16–48% using the LDH assay. A similar trend was also observed that as the TS2 concentrations increased from 5 μM to 20 μM, the cell viability decreased from 70% (65%) to 47% (38%) at 24 h (48 h), while cell apoptosis increased from 6% (18%) to 22% (45%) at 24 h (48 h). The side effects of high-dosage tanshinones have been noted in cancer therapy, because cancer therapy typically requires high dosage of tanshinones (30 mg kg−1, 3 times per week).41 However, the relatively low concentration of tanshinones of 5 μM enables achieving high cell viability and low cell apoptosis, both of which are better than those induced by hIAPP alone.When hIAPP (20 μM) was co-incubated with TS1 for 24 h, the cell viability was 67%, 45%, and 40% at hIAPP![[thin space (1/6-em)]](https://www.rsc.org/images/entities/char_2009.gif) :
:![[thin space (1/6-em)]](https://www.rsc.org/images/entities/char_2009.gif) TS1 ratios of 1
TS1 ratios of 1![[thin space (1/6-em)]](https://www.rsc.org/images/entities/char_2009.gif) :
:![[thin space (1/6-em)]](https://www.rsc.org/images/entities/char_2009.gif) 0.25, 1
0.25, 1![[thin space (1/6-em)]](https://www.rsc.org/images/entities/char_2009.gif) :
:![[thin space (1/6-em)]](https://www.rsc.org/images/entities/char_2009.gif) 0.5 and 1
0.5 and 1![[thin space (1/6-em)]](https://www.rsc.org/images/entities/char_2009.gif) :
:![[thin space (1/6-em)]](https://www.rsc.org/images/entities/char_2009.gif) 1 (Fig. 5c). Consistent with MTT results, cell apoptosis was 20%, 40% and 47% at the hIAPP
1 (Fig. 5c). Consistent with MTT results, cell apoptosis was 20%, 40% and 47% at the hIAPP![[thin space (1/6-em)]](https://www.rsc.org/images/entities/char_2009.gif) :
:![[thin space (1/6-em)]](https://www.rsc.org/images/entities/char_2009.gif) TS1 ratios of 1
TS1 ratios of 1![[thin space (1/6-em)]](https://www.rsc.org/images/entities/char_2009.gif) :
:![[thin space (1/6-em)]](https://www.rsc.org/images/entities/char_2009.gif) 0.25, 1
0.25, 1![[thin space (1/6-em)]](https://www.rsc.org/images/entities/char_2009.gif) :
:![[thin space (1/6-em)]](https://www.rsc.org/images/entities/char_2009.gif) 0.5 and 1
0.5 and 1![[thin space (1/6-em)]](https://www.rsc.org/images/entities/char_2009.gif) :
:![[thin space (1/6-em)]](https://www.rsc.org/images/entities/char_2009.gif) 1 (Fig. 5d). A further increase of incubation time to 48 h led to a minor decrease of cell viability to 60–62% and a minor increase of cell apoptosis to 27–30%. Among all cell viability and apoptosis data, only 5 μM TS1 (i.e. hIAPP
1 (Fig. 5d). A further increase of incubation time to 48 h led to a minor decrease of cell viability to 60–62% and a minor increase of cell apoptosis to 27–30%. Among all cell viability and apoptosis data, only 5 μM TS1 (i.e. hIAPP![[thin space (1/6-em)]](https://www.rsc.org/images/entities/char_2009.gif) :
:![[thin space (1/6-em)]](https://www.rsc.org/images/entities/char_2009.gif) TS1 = 1
TS1 = 1![[thin space (1/6-em)]](https://www.rsc.org/images/entities/char_2009.gif) :
:![[thin space (1/6-em)]](https://www.rsc.org/images/entities/char_2009.gif) 0.25) enables achieving the higher cell viability and the lower cell apoptosis than pure hIAPP (cell viability = 67% and cell apoptosis = 20%). The same optimal hIAPP
0.25) enables achieving the higher cell viability and the lower cell apoptosis than pure hIAPP (cell viability = 67% and cell apoptosis = 20%). The same optimal hIAPP![[thin space (1/6-em)]](https://www.rsc.org/images/entities/char_2009.gif) :
:![[thin space (1/6-em)]](https://www.rsc.org/images/entities/char_2009.gif) TS2 ratio was found at 1
TS2 ratio was found at 1![[thin space (1/6-em)]](https://www.rsc.org/images/entities/char_2009.gif) :
:![[thin space (1/6-em)]](https://www.rsc.org/images/entities/char_2009.gif) 0.25, under which the maximum cell viability (67% at 24 h and 64% at 48 h) and the minimum cell apoptosis (28% at 24 h and 30% at 48 h) were obtained (Fig. 5c and d). Since pure hIAPP samples showed 40% cell death, our result clearly demonstrated the cell protection effects of tanshinones at low concentrations, which could be attributed to (i) the inhibition of the formation of toxic hIAPP aggregates and (ii) the formation of less- or non-toxic hIAPP–tanshinone complexes.
0.25, under which the maximum cell viability (67% at 24 h and 64% at 48 h) and the minimum cell apoptosis (28% at 24 h and 30% at 48 h) were obtained (Fig. 5c and d). Since pure hIAPP samples showed 40% cell death, our result clearly demonstrated the cell protection effects of tanshinones at low concentrations, which could be attributed to (i) the inhibition of the formation of toxic hIAPP aggregates and (ii) the formation of less- or non-toxic hIAPP–tanshinone complexes.
3.4. MD simulations of the interaction of tanshinones with hIAPP
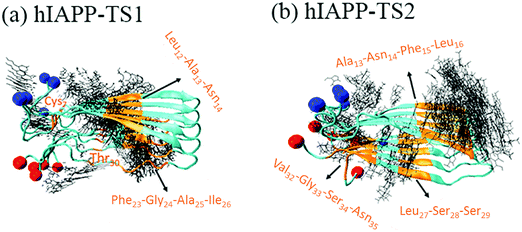
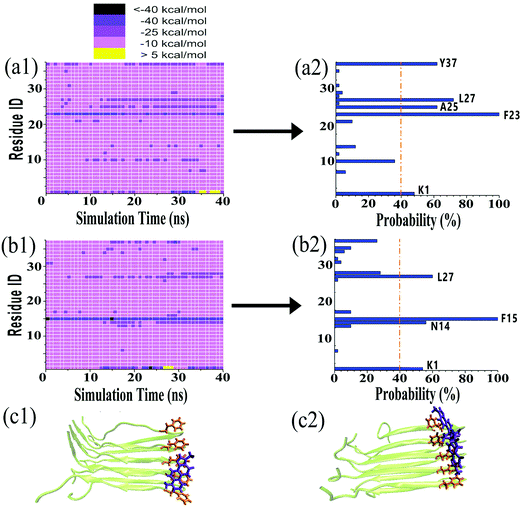
It is generally accepted that almost all inhibition effects stem from the interactions of inhibitors with hosts. To better understand the hIAPP inhibition mechanism by tanshinones, we performed all-atom MD simulations to study how TS1 or TS2 interacts with a hIAPP pentamer and to determine the specific binding modes between TS1 and hIAPP and between TS2 and hIAPP. Fig. 6 shows the binding distribution of (a) TS1 and (b) TS2 molecules around 3.6 Å of the hIAPP pentamer, where accumulative positions of TS1 or TS2 molecules were sampled by every 4 ps snapshots from the last 20 ns of two independent MD trajectories. In Fig. 6a, TS1 tended to bind to the interior β-sheet of an U-bent cavity, including Leu12, Ala13, and Asn14 residues at the N-terminal β-sheet and Phe23, Gly24, Ala25, and Ile26 residues at the C-terminal β-sheet. In addition, TS1 also exhibited the second favorable binding sites near both N- and C-terminal residues of Cys2 and Thr30. Different from TS1, TS2 preferred to interact with the external side of the N-terminal β-sheet, particularly four residues of Ala13, Asn14, Phe15, and Leu16 (Fig. 6b). TS2 also exhibited preferential interactions with the C-terminal β-sheet residues of Leu27, Ser28, and Ser29 and the C-terminal residues of Val32, Gly33, Ser34, and Asn35. It appears that independent of the initial positions and orientations of tanshinone molecules, the β-sheet regions of hIAPP are the major binding sites for both tanshinones, so the binding of tanshinones to hIAPP β-sheets is expected to prevent the lateral association of hIAPP aggregates via β-sheet stacking and thus to inhibit fibril growth.Visual inspection of MD trajectories showed that some tanshinones had relatively large movement to walk around the favorable binding sites, suggesting that some favorable binding sites do not necessarily imply strong binding sites between tanshinones and hIAPP. To further quantitatively identify whether TS1 and TS2 have strong binding preferences to certain hIAPP residues, we calculated the nonbonded interaction energy between each hIAPP residue and tanshinones, and the interaction energy landscapes of hIAPP–TS1 and hIAPP–TS2 systems are shown in Fig. 7a and b, respectively. Inhomogeneous interaction energy landscapes between tanshinones and hIAPP residues clearly indicate that tanshinones tended to interact strongly and persistently with several hIAPP residues over others. To more precisely determine the strong and persistent binding residues, for any given residue at any timeframe, if its interaction energy with tanshinones is <−25 kcal mol−1 (i.e. any small square colored with dark purple, medium purple and black in Fig. 7a1 and b1), this residue is defined as a single strong contact in this timeframe. If the accumulation of these single strong contacts occupies more than 40% of the total contacts in the entire 20 ns timeframes, this residue is considered as the strong and persistent binding residue. Upon conversion of Fig. 7a1 to a2, we can easily observe that TS1 exhibited the stronger and more stable (longer time) interactions with Y37(62%), L27(72%), A25(62%), F23(100%), and K1(48%), while TS2 exhibited the stronger and more stable interactions with L27(60%), F15(100%), N14(56%), and K1(54%). Apparently, strong binding residues were mainly located at the N-terminal β-sheet residues F23–L27 and C-terminal β-sheet residues N14–F15 regions, as well as two N-/C-termini. In particular, Phe23 and Phe15 were found to have the strongest interaction with TS1 and TS2, respectively. Visual inspection showed that Phe23 and TS1 formed parallel π–π stacking Fig. 7c1, while Phe15 and TS2 formed the T-shaped π–π stacking between Fig. 7c2.53 A number of studies have also found that the Phe residue is the crucial binding target for drug design against amyloid diseases because aromatic Phe is likely to interact with small molecules with an aromatic ring structure via π–π stacking.54,55
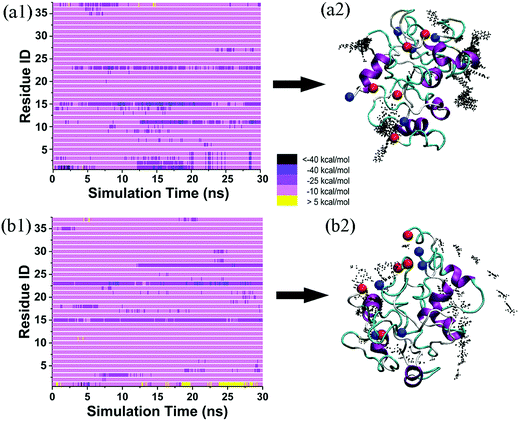
To examine the structure-dependent binding behavior of tanshinone molecules, we further reconstructed disordered hIAPP oligomers using the annealing MD simulations, and then performed two additional 30 ns MD simulations of the TS1 + disordered hIAPP pentamer and the TS2 + disordered hIAPP pentamer in explicit water. As shown in Fig. 8, visual inspection of MD trajectories showed that almost ten TS1 or TS2 molecules were present within ∼7.5 Å of the disordered hIAPP pentamer, with several preferential and strong bindings to some residues. Specifically, TS1 molecules were mostly populated around Arg11, Phe15, and Phe23 of the disordered hIAPP pentamer (Fig. 8a1), among which Phe15 was found to bind to both ordered and disordered hIAPP pentamers, but with weaker binding affinity to the disordered hIAPP pentamer. Differently, TS2 molecules tended to bind to Phe15, Phe23, Leu27 of the disordered hIAPP pentamer (Fig. 8b1), showing the two same (Phe15 and Phe23) and one different (Leu27) binding residues in comparison to the ordered TS2–hIAPP system. A comparison of binding affinity and distribution between four different hIAPP + tanshinones systems (Fig. 8a2–b2) suggests that tanshinone molecules tend to bind more and diverse residues of the disordered hIAPP pentamer with relatively weak binding affinity as compared to the ordered hIAPP pentamer. Meanwhile, regardless of hIAPP structures, both TS1 and TS2 molecules enable physical interaction with hIAPP peptides and enclose the hydrophobic sites of hIAPP peptides, but in different ways, indicating that the binding of tanshinone molecules to hydrophobic residues of hIAPP (either the ordered β-sheet or disordered structure) could possibly block the continuous growth and structural transition of the pleated β-sheet structure, thus inhibiting hIAPP fibrillation.
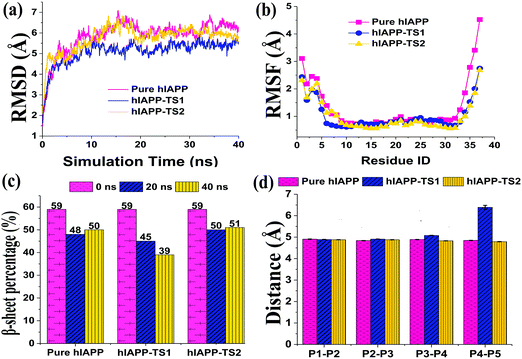
In addition, binding of tanshinones to hIAPP did not largely disturb the structural integrity of the hIAPP pentamer, i.e. the hIAPP pentamer still well retained its overall and secondary structures during 40 ns simulations, and only its N-/C-termini exhibited minor twists. The time-dependent root-mean-square deviation (RMSD) profiles of the hIAPP pentamer in the absence and presence of TS1 or TS2 were similar, all of which finally achieved a similar plateau of 5.5–6.5 Å (Fig. 9a). RMSF profiles showed some common characteristics of small fluctuations for the central peptides whereas relatively large fluctuations for the edge peptides (Fig. 9b). hIAPP peptides were able to retain their overall U-shaped conformations and dominant β-sheet contents. Specifically, during 40 ns simulations, in all three systems, hIAPP pentamers decreased their β-sheet percentages from 59% to 48% at 20 ns to 50% at 40 ns without tanshinones, from 59% to 45% at 20 ns to 39% at 40 ns with TS1, and from 59% to 50% at 20 ns to 51% at 40 ns with TS2, respectively (Fig. 9c). Statistically, the presence of both tanshinones did not significantly change or reduce the β-sheet content of hIAPP. To further characterize the peptide associations, we calculated and compared the interpeptide distance (dstrand) between all adjacent peptides for the hIAPP pentamer with and without tanshinones. The dstrand is calculated by averaging the mass center distance between each residue in a β-strand and its corresponding residue in the adjacent β-strand. As shown in Fig. 9d, regardless of the presence or absence of tanshinones, separation distances between each pair of neighboring peptides of the hIAPP pentamer in all three systems were well retained as similar values of ∼4.9 Å with very small fluctuations, except for the separation distance between peptide 4 and peptide 5 in the hIAPP–TS1 system. It seems that the edge peptide tended to disassociate with each other, while a complete peptide disassociation was not observed. It is also likely that the hundred-nanosecond timescale in MD simulations is too short to directly observe peptide dissociation in all three ordered systems.
4. Conclusions
It is challenging and critical to develop or discover amyloid inhibitors that can inhibit the aggregation and toxicity of different amyloid peptides. Motivated by our previous work that tanshinones, natural products derived from traditional Chinese herbs, disrupt Aβ1–42 aggregation and ameliorate Aβ aggregate-induced cytotoxicity, herein we strive to examine whether tanshinones possess similar inhibition activity against hIAPP aggregation and toxicity. The ThT assay and AFM results demonstrated that both TS1 and TS2 tanshinones at different concentrations showed different inhibitory effects on Aβ fibrillization and fibril disassembly. At an optimal hIAPP![[thin space (1/6-em)]](https://www.rsc.org/images/entities/char_2009.gif) :
:![[thin space (1/6-em)]](https://www.rsc.org/images/entities/char_2009.gif) tanshinone molar ratio of 1
tanshinone molar ratio of 1![[thin space (1/6-em)]](https://www.rsc.org/images/entities/char_2009.gif) :
:![[thin space (1/6-em)]](https://www.rsc.org/images/entities/char_2009.gif) 0.5, TS1 and TS2 reduced ∼75% and 80% of hIAPP fibril formation, and they also disassembled ∼83% and 67% of the preformed hIAPP fibrils into small amorphous aggregates. CD spectra revealed that the addition of tanshinones inhibited the conformational transition of hIAPP towards β-sheets, thus reducing hIAPP aggregation. MTT and LDH assays showed that a small amount of tanshinones (e.g., 5 μM) increased cell viability from 37% to 66% and decreased cell apoptosis from 40% to 24%. MD simulations further confirm that tanshinones preferentially and strongly interact with the β-sheet regions of hIAPP mainly containing aromatic and hydrophobic residues. The various binding sites explain the diverse inhibitory effects of tanshinones on hIAPP aggregation. Since our in vitro studies demonstrate that two tanshinone components enable the inhibition of amyloid fibrillogenesis, disaggregate mature fibrils, and reduce cell toxicity by both Aβ and hIAPP, they could be very promising candidates for anti-AD and anti-T2D drug development via future in vivo and clinical studies. Another future study of great interest is to examine a general inhibitory efficacy of tanshinones for other amyloid peptides.
0.5, TS1 and TS2 reduced ∼75% and 80% of hIAPP fibril formation, and they also disassembled ∼83% and 67% of the preformed hIAPP fibrils into small amorphous aggregates. CD spectra revealed that the addition of tanshinones inhibited the conformational transition of hIAPP towards β-sheets, thus reducing hIAPP aggregation. MTT and LDH assays showed that a small amount of tanshinones (e.g., 5 μM) increased cell viability from 37% to 66% and decreased cell apoptosis from 40% to 24%. MD simulations further confirm that tanshinones preferentially and strongly interact with the β-sheet regions of hIAPP mainly containing aromatic and hydrophobic residues. The various binding sites explain the diverse inhibitory effects of tanshinones on hIAPP aggregation. Since our in vitro studies demonstrate that two tanshinone components enable the inhibition of amyloid fibrillogenesis, disaggregate mature fibrils, and reduce cell toxicity by both Aβ and hIAPP, they could be very promising candidates for anti-AD and anti-T2D drug development via future in vivo and clinical studies. Another future study of great interest is to examine a general inhibitory efficacy of tanshinones for other amyloid peptides.
Conflicts of interest
There are no conflicts to declare.Acknowledgements
This work was financially supported by NSF (CBET-1510099), Alzheimer's Association New Investigator Research Grant (2015-NIRG-341372), and National Natural Science Foundation of China (NSFC-21528601), and partially from NSF (DMR-1607475).References
- M. R. Hayden, J. Pancreas, 2002, 3, 126–138 Search PubMed.
- M. F. Tomasello, A. Sinopoli and G. Pappalardo, J. Diabetes Res., 2015, 2015, 918573 CrossRef PubMed.
- L. Haataja, T. Gurlo, C. J. Huang and P. C. Butler, Endocr. Rev., 2008, 29, 303–316 CrossRef CAS PubMed.
- R. Hu, B. Ren, M. Zhang, H. Chen, Y. Liu, L. Liu, X. Gong, B. Jiang, J. Ma and J. Zheng, ACS Omega, 2017, 2, 784–792 CrossRef CAS.
- M. Zhang, R. Hu, H. Chen, Y. Chang, X. Gong, F. Liu and J. Zheng, Phys. Chem. Chem. Phys., 2015, 17, 10373–10382 RSC.
- A. Kapurniotu, Pept. Sci., 2001, 60, 438–459 CrossRef CAS.
- P. Cao, P. Marek, H. Noor, V. Patsalo, L. H. Tu, H. Wang, A. Abedini and D. P. Raleigh, FEBS Lett., 2013, 587, 1106–1118 CrossRef CAS PubMed.
- A. S. Pithadia, A. Bhunia, R. Sribalan, V. Padmini, C. A. Fierke and A. Ramamoorthy, Chem. Commun., 2016, 52, 942–945 RSC.
- Y. L. Ma, Y. J. Sun, Y. J. Fu, G. Z. Fang, X. R. Yan and Z. H. Guo, Chemosphere, 2016, 163, 610–619 CrossRef CAS PubMed.
- Y. L. Ma, J. X. Dai, L. L. Wu, G. Z. Fang and Z. H. Guo, Polymer, 2017, 114, 113–121 CrossRef CAS.
- C. Cabaleiro-Lago, I. Lynch, K. Dawson and S. Linse, Langmuir, 2009, 26, 3453–3461 CrossRef PubMed.
- E. N. Gurzov, B. Wang, E. H. Pilkington, P. Chen, A. Kakinen, W. J. Stanley, S. A. Litwak, E. G. Hanssen, T. P. Davis and F. Ding, Small, 2016, 12, 1615–1626 CrossRef CAS PubMed.
- Y. L. Ma, L. Lv, Y. R. Guo, Y. J. Fu, Q. Shao, T. T. Wu, S. J. Guo, K. Sun, X. K. Guo, E. K. Wujcik and Z. H. Guo, Polymer, 2017, 128, 12–23 CrossRef CAS.
- K. Debnath, S. Shekhar, V. Kumar, N. R. Jana and N. R. Jana, ACS Appl. Mater. Interfaces, 2016, 8, 20309–20318 CAS.
- J. Guo, J. Li, Y. Zhang, X. Jin, H. Liu and X. Yao, PLoS One, 2013, 8, e65579 CAS.
- X. Zhou, C. Cao, Q. Chen, Q. Yu, Y. Liu, T. Yin and J. Liu, J. Mater. Chem. B, 2015, 3, 7055–7067 RSC.
- M. Tatarek-Nossol, L.-M. Yan, A. Schmauder, K. Tenidis, G. Westermark and A. Kapurniotu, Chem. Biol., 2005, 12, 797–809 CrossRef CAS PubMed.
- B. Cheng, H. Gong, X. Li, Y. Sun, X. Zhang, H. Chen, X. Liu, L. Zheng and K. Huang, Biochem. Biophys. Res. Commun., 2012, 419, 495–499 CrossRef CAS PubMed.
- Y. Porat, A. Abramowitz and E. Gazit, Chem. Biol. Drug Des., 2006, 67, 27–37 CAS.
- B. Ren, B. Jiang, R. Hu, M. Zhang, H. Chen, J. Ma, Y. Sun, L. Jia and J. Zheng, Phys. Chem. Chem. Phys., 2016, 18, 20476–20485 RSC.
- B. P. Ren, M. Z. Zhang, R. D. Hu, H. Chen, M. L. Wang, Y. F. Lin, Y. Sun, L. Y. Jia, G. Z. Liang and J. Zheng, ACS Omega, 2017, 2, 243–250 CrossRef CAS.
- S. Lee, X. Zheng, J. Krishnamoorthy, M. G. Savelieff, H. M. Park, J. R. Brender, J. H. Kim, J. S. Derrick, A. Kochi, H. J. Lee, C. Kim, A. Ramamoorthy, M. T. Bowers and M. H. Lim, J. Am. Chem. Soc., 2014, 136, 299–310 CrossRef CAS PubMed.
- X. Zheng, M. M. Gessel, M. L. Wisniewski, K. Viswanathan, D. L. Wright, B. A. Bahr and M. T. Bowers, J. Biol. Chem., 2012, 287, 6084–6088 CrossRef CAS PubMed.
- J. Bieschke, J. Russ, R. P. Friedrich, D. E. Ehrnhoefer, H. Wobst, K. Neugebauer and E. E. Wanker, Proc. Natl. Acad. Sci. U. S. A., 2010, 107, 7710–7715 CrossRef CAS PubMed.
- H. J. Wobst, A. Sharma, M. I. Diamond, E. E. Wanker and J. Bieschke, FEBS Lett., 2015, 589, 77–83 CrossRef CAS PubMed.
- M. Zhang, B. Ren, H. Chen, Y. Sun, J. Ma, B. Jiang and J. Zheng, Isr. J. Chem., 2017, 57, 586–601 CrossRef CAS.
- E. Bruno, C. Pereira, K. P. Roman, M. Takiguchi, P.-Y. Kao, L. A. Nogaj and D. A. Moffet, Amyloid, 2013, 20, 34–38 CrossRef CAS PubMed.
- H. Fujiwara, M. Tabuchi, T. Yamaguchi, K. Iwasaki, K. Furukawa, K. Sekiguchi, Y. Ikarashi, Y. Kudo, M. Higuchi and T. C. Saido, J. Neurochem., 2009, 109, 1648–1657 CrossRef CAS PubMed.
- K. Ono, K. Hasegawa, H. Naiki and M. Yamada, J. Neurosci. Res., 2004, 75, 742–750 CrossRef CAS PubMed.
- K. Ono and M. Yamada, J. Neurochem., 2006, 97, 105–115 CrossRef CAS PubMed.
- L. Zhou, Z. Zuo and M. S. S. Chow, J. Clin. Pharmacol., 2005, 45, 1345–1359 CrossRef CAS PubMed.
- H. Wang, X. Gao and B. Zhang, J. Ethnopharmacol., 2005, 99, 93–98 CrossRef CAS PubMed.
- A. K. Wan, S. W. Leung, D.-Y. Zhu and R. Y. Man, J. Nat. Prod., 2008, 71, 1825–1828 CrossRef CAS PubMed.
- Y.-F. Bi, H.-W. Xu, X.-Q. Liu, X.-J. Zhang, Z.-J. Wang and H.-M. Liu, Bioorg. Med. Chem. Lett., 2010, 20, 4892–4894 CrossRef CAS PubMed.
- Z. Liu, S. Gao, J. Deng and H. Li, Chin. Tradit. Pat. Med., 1997, 19, 20–21 Search PubMed.
- L.-L. Shi, W.-N. Yang, X.-L. Chen, J.-S. Zhang, P.-B. Yang, X.-D. Hu, H. Han, Y.-H. Qian and Y. Liu, Neurochem. Int., 2012, 61, 227–235 CrossRef CAS PubMed.
- L. Li, J. Dai, L. Ru, G. Yin and B. Zhao, Acta Pharmacol. Sin., 2004, 25, 861–868 CAS.
- W. J. Xia, M. Yang, T. F. Fok, K. Li, W. Y. Chan, P.-C. Ng, H. K. Ng, K. W. Chik, C. C. Wang and G. J. S. Gu, Pediatr. Res., 2005, 58, 784–790 CrossRef CAS PubMed.
- C.-Y. Lee, H.-F. Sher, H.-W. Chen, C.-C. Liu, C.-H. Chen, C.-S. Lin, P.-C. Yang, H.-S. Tsay and J. J. Chen, Mol. Cancer Ther., 2008, 7, 3527–3538 CrossRef CAS PubMed.
- J. Fu, H. Huang, J. Liu, R. Pi, J. Chen and P. Liu, Eur. J. Pharmacol., 2007, 568, 213–221 CrossRef CAS PubMed.
- X. Wang, Y. Wei, S. Yuan, G. Liu, Y. Lu, J. Zhang and W. Wang, Int. J. Cancer, 2005, 116, 799–807 CrossRef CAS PubMed.
- Q. Wang, X. Yu, K. Patal, R. Hu, S. Chuang, G. Zhang and J. Zheng, ACS Chem. Neurosci., 2013, 4, 1004–1015 CrossRef CAS PubMed.
- R. Hu, M. Zhang, H. Chen, B. Jiang and J. Zheng, ACS Chem. Neurosci., 2015, 6, 1759–1768 CrossRef CAS PubMed.
- M. Zhang, R. Hu, H. Chen, Y. Chang, J. Ma, G. Liang, J. Mi, Y. Wang and J. Zheng, Phys. Chem. Chem. Phys., 2015, 17, 23245–23256 RSC.
- M. Zhang, R. Hu, H. Chen, X. Gong, F. Zhou, L. Zhang and J. Zheng, J. Chem. Inf. Model., 2015, 55, 1628–1639 CrossRef CAS PubMed.
- M. Zhang, R. Hu, B. Ren, H. Chen, B. Jiang, J. Ma and J. Zheng, ACS Chem. Neurosci., 2017, 8, 524–537 CrossRef CAS PubMed.
- S. Luca, W.-M. Yau, R. Leapman and R. Tycko, Biochemistry, 2007, 46, 13505–13522 CrossRef CAS PubMed.
- A. D. MacKerell, D. Bashford, M. Bellott, R. L. Dunbrack, J. D. Evanseck, M. J. Field, S. Fischer, J. Gao, H. Guo, S. Ha, D. Joseph-McCarthy, L. Kuchnir, K. Kuczera, F. T. K. Lau, C. Mattos, S. Michnick, T. Ngo, D. T. Nguyen, B. Prodhom, W. E. Reiher, B. Roux, M. Schlenkrich, J. C. Smith, R. Stote, J. Straub, M. Watanabe, J. Wiorkiewicz-Kuczera, D. Yin and M. Karplus, J. Phys. Chem. B, 1998, 102, 3586–3616 CrossRef CAS PubMed.
- E. Mashiach, D. Schneidman-Duhovny, N. Andrusier, R. Nussinov and H. J. Wolfson, Nucleic Acids Res., 2008, 36, W229–W232 CrossRef CAS PubMed.
- L. Kale, R. Skeel, M. Bhandarkar, R. Brunner, A. Gursoy, N. Krawetz, J. Phillips, A. Shinozaki, K. Varadarajan and K. Schulten, J. Comput. Phys., 1999, 151, 283–312 CrossRef CAS.
- B. Cheng, H. Gong, H. Xiao, R. B. Petersen, L. Zheng and K. Huang, Biochim. Biophys. Acta, Gen. Subj., 2013, 1830, 4860–4871 CrossRef CAS PubMed.
- P. Cao and D. P. Raleigh, Biochemistry, 2012, 51, 2670–2683 CrossRef CAS PubMed.
- E. Gazit, FASEB J., 2002, 16, 77–83 CrossRef CAS PubMed.
- H. H. Lee, T. S. Choi, S. J. Lee, J. W. Lee, J. Park, Y. H. Ko, W. J. Kim, K. Kim and H. I. Kim, Angew. Chem., Int. Ed. Engl., 2014, 53, 7461–7465 CrossRef CAS PubMed.
- N. E. de Almeida, T. D. Do, M. Tro, N. E. LaPointe, S. C. Feinstein, J. E. Shea and M. T. Bowers, ACS Chem. Neurosci., 2016, 7, 218–226 CrossRef CAS PubMed.
Footnote |
| † The authors contribute equally to this work. |
| This journal is © The Royal Society of Chemistry 2018 |

