 Open Access Article
Layered structure graphene oxide/methylcellulose composites with enhanced mechanical and gas barrier properties†
Rama Kanta
Layek
 *,
Karthik Ram
Ramakrishnan
 ,
Essi
Sarlin
 ,
Olli
Orell
 ,
Mikko
Kanerva
 ,
Jyrki
Vuorinen
 and
Mari
Honkanen

Tampere University of Technology, Laboratory of Materials Science, P.O. Box 589, 33101 Tampere, Finland. E-mail: rama.layek@tut.fi; Tel: +35850 4478355
First published on 29th May 2018
Abstract
Layered structure graphene oxide (GO)/methylcellulose (MC) composite films with excellent mechanical and gas barrier properties were achieved for the first time by a simple solvent evaporation assisted assembly of GO/MC composite solutions. 1, 3 and 5 wt% of GO composites with respect to MC were fabricated and denoted as GO1, GO3 and GO5, respectively. The interactions of the hydrophobic associated domains of MC (formed during solvent evaporation) with the π cloud of GO (hydrophobic interaction) and the oxygen-containing groups of MC with the oxygen-containing functional groups of GO (H-bonding interaction) govern the formation of self-assembled thick MC coated layered structure GO/MC composites. The obtained composite films were highly flexible and characterized by field emission scanning electron microscopy (FESEM), Fourier transform infrared spectroscopy (FTIR), wide angle X-ray scattering (WAXS), Simultaneous Thermal Analysis (STA), and mechanical and oxygen gas permeation studies. The FESEM analysis shows the formation of a layered structure as well as good dispersion of thick MC coated GO sheets in the MC matrix. WAXS studies also illustrate that the GO sheets remain in a highly exfoliated state in the MC matrix. The FTIR results indicate the presence of interfacial interaction between the GO and MC molecules. The GO/MC composite films exhibit a significant enhancement of mechanical properties compared to pure MC films. The stress at break and Young's modulus of GO5 were determined to be 104 ± 3 MPa and 3.8 ± 0.2, respectively. In addition to the mechanical properties, the oxygen gas barrier properties of the composites were also enhanced significantly. The GO1 film shows a 98% decrease of oxygen permeation with respect to pure MC films.
Introduction
Superior mechanical properties and ultra-low gas permeability are required to utilize polymeric materials in a wide variety of technological applications such as packaging films, flexible electronics, protective coating, laminates, and transport of preservable goods (medicine, health, beauty, cosmetic, foods etc.).1–4 Generally, for these purposes petroleum derived synthetic polymeric materials are preferred over bio-based polymers due to their higher mechanical and gas barrier properties. However, the demand for the replacement of petroleum-derived plastics by renewable biopolymers is increasing year by year due to growing environmental consciousness.5,6Among the various types of biopolymers, cellulose is the most abundant renewable polymer in the world, gaining remarkable attention to emerge as an alternative for petroleum derived polymers due to its biocompatibility and biodegradability. Generally most of the cellulose based polymers produce brittle film. However, celluloses can simply be transformed into ester or ether derivatives to improve the film-forming ability and to bring flexibility and transparency.7a,b Methylcellulose (MC) is one of the most significant derivatives of cellulose that produces good quality films8a,b and used to fabricate polymer composites for the enhancement of antimicrobial and mechanical properties.8b However, pure MC films are mechanically weak and their gas barrier properties are very low which limits their applications as an alternative of petroleum derived polymers in the field of consumer products and packaging applications. Very recent studies have shown that the layered structure nacre-like biopolymer composites with impermeable fillers such as clay, nanocellulose and graphene are very promising to enhance the mechanical and gas barrier properties of biopolymer composites that can compete with fossil fuel derived polymers.9–12
Graphene is a two-dimensional nanostructure of carbon with a large aspect ratio, and high gas barrier properties.13 The high electron density and very low geometric pore size of graphene make it a promising impermeable filler13 for the fabrication of superior gas barrier polymer composites and currently it is one of the fastest growing research areas of material science. Recently both theoretical14 and experimental15 examinations have shown that truly defect free graphene is impermeable towards any gas molecules. Nevertheless, it is very challenging to produce a defect free or less defective graphene on a large scale. Hence, currently, layered structure polymer composites with graphene are directed mainly by defective derivatives of graphene such as graphene oxide (GO) and reduced graphene oxide (rGO) that are produced on a large scale and show a significant enhancement of mechanical and gas-barrier properties.16–20
Very recently, Grunlan et al. have reported layered structure GO/polyethyleneimine composites with significant enhancement of gas barrier properties by alternative deposition of PEI and GO using LBL assembly.16 The coating of layered structure GO/polyvinyl alcohol (PVA) nanocomposites on a polyethylene terephthalate (PET) substrate enhanced the gas barrier properties significantly.17 Nacre-like layered structure GO/PVA composites with excellent mechanical and electrical properties, and biocompatibility have been fabricated using a simple solvent evaporation technique.18 Brinson et al. have fabricated a brick wall structure by orienting graphene sheets parallel to the surface of the composite films via a vacuum assisted self-assembly (VASA) process which shows dramatic enhancement of mechanical properties.19 For layered structure rGO/PEI composite papers, Liu et al. have shown significant enhancement of hydrogen gas barrier properties.20 However, a large concentration of graphene sheets (10–80 wt%) is required to achieve these types of layered structure graphene/polymer composites with superior mechanical and gas barrier properties. Xu et al. have fabricated layered structure GO/PVA composite films with enhanced mechanical performance using vacuum filtration assisted assembly at a low concentration of graphene loading (3.5 wt%).21 Nevertheless, in extensive research efforts dedicated to develop layered structure GO/polymer composites, to the best of our knowledge, there is no report of layered structure GO/polymer composites with significant enhancement of mechanical and gas barrier properties at low concentrations of GO fabricated using a simple solvent evaporation technique.
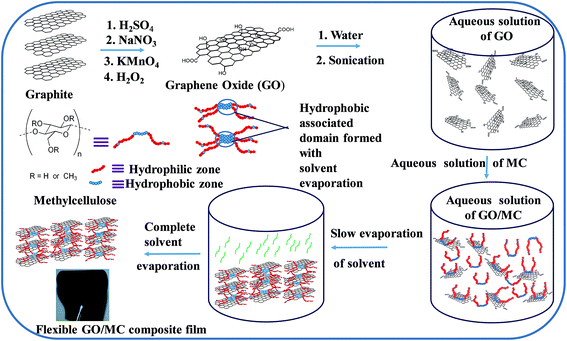
Here, for the first time, we report low GO concentration layered structure GO/MC composites with significant enhancement of mechanical and gas barrier properties through a simple solvent evaporation assisted assembly (Scheme 1). The solvent evaporation assembly procedure is very simple, less time consuming and energy efficient than that of previously reported vacuum assisted assemblies to prepare nacre-like layered structure composite films19–21 and a layer-by-layer (LBL) deposition assembly procedure.16 MC was chosen due to its amphiphilic nature. It consists of a hydrophobic axial plane and a hydrophilic equatorial plane of repeated glucopyranose and hydrophobic methylated units22,23 that govern the solubility of methylcellulose in aqueous solutions. GO has been selected due to its several hydroxyl, epoxy and carboxyl groups and unoxidized hydrophobic graphitic domains24 that can interact with MC by both hydrophobic and H-bonding sites. This interfacial interaction between GO and MC as well as homogeneous dispersion of thick MC coated GO sheets in the MC matrix enables the fabrication of high performance layered structure GO/MC composites with significantly enhanced mechanical and gas barrier properties. The improved mechanical and oxygen gas barrier properties of the GO/MC composites may be attractive for many consumer products, packaging and engineering applications.
Experimental section
Samples
Graphite was received from TIMCAL Ltd., Switzerland. Sodium nitrate and hydrogen peroxide were purchased from Sigma Aldrich and used as received. Potassium permanganate was purchased from Merck, Germany. Sulphuric acid was purchased from VWR international Oy, Finland. Methylcellulose was received from British Drug Houses and used without further purification. Water used for sample preparation was collected from a MilliQ system.Synthesis of GO
GO was prepared by oxidizing the graphite powder using a modified Hummers' method.25 In this typical method, initially an ice bath was prepared and kept on a magnetic stirrer. 46 mL of concentrated sulfuric acid (H2SO4) was taken in a round bottom flask (RB) and placed in the ice bath at 0 °C to cool the H2SO4. It was stirred by using a bar magnet. 0.1 g of sodium nitrate was mixed with this ice cooled H2SO4 with constant stirring. Then, 2 g of graphite powder was mixed into the reaction mixture with constant stirring and then 6 g of potassium permanganate was slowly added to the reaction mixture. Throughout the KMnO4 addition period, the temperature of the reaction mixture was maintained between 0 and 5 °C. After that, the ice bath was removed. Then, the reaction mixture was stirred at 25 °C for an additional 6 hours to make a thick paste and 92 mL of MilliQ water was added to it followed by continuous stirring. With addition of water, the temperature of the reaction mixture increased to ∼90 °C. Then, the reaction mixture was stirred further for 30 minutes and an additional 280 mL of water added to it. After that, H2O2 (3 mL of 30%) was added to the reaction mixture that changes its colour from dark brown to yellow. The obtained product was centrifuged and the bottom fraction was collected. The collected bottom fraction was re-dispersed in water and centrifuged several times until the pH of the supernatant solution reached ∼7. Finally, GO was obtained by collecting the bottom fraction from the centrifuge tube and drying it in a vacuum at ∼50 °C.Preparation of GO/MC composites
1 g of MC (20 mg mL−1) was dispersed in 50 mL of ice cool water by ultra-sonication for 2 minutes. A homogeneous aqueous solution of MC was prepared by keeping it in a refrigerator at 4 °C for 2 h followed by stirring using a bar magnet at room temperature for 30 minutes. Then, 10 mg, 30 mg and 50 mg of GO were dispersed in 10 mL of water by ultra-sonication and mixed with MC solution to produce 1, 3 and 5 wt% GO composites with respect to MC. After that the mixture was sonicated for 5 minutes to produce homogeneous solutions of GO/MC composites. The resulting GO/MC composite solutions were poured on Petri dishes and evaporated slowly at 30 °C to obtain the composite films of GO/MC. The obtained composite films were kept in a vacuum for 2 days to eliminate trapped water if any in the composite films. The resulting composite films were labelled GO1, GO3 and GO5 and this indicates that 1 wt%, 3 wt% and 5 wt% of the GO are present, respectively, with respect to MC in the composite films. The pure MC film was also prepared in the same manner without taking any GO. The thickness of the films was ∼80 μm.Characterization
The transmission electron microscopy (JEOL TEM 2010) study of GO was conducted by casting a drop of dilute aqueous solution of GO (0.05% w/v) on a carbon-coated copper grid and evaporating the solvent at room temperature. A similar 0.01%, w/v aqueous solution of GO was cast on a mica surface and the solvent was evaporated at room temperature for examination with Atomic Force Microscopy (AFM). The AFM study of this dried sample was performed using noncontact mode with a resonance frequency of 250 kHz of the tip. The cross-sectional morphology of the composite films was investigated by using a field emission scanning electron microscope (SEM Zeiss ULTRA Plus). The composite films were freeze-fractured by dipping the composite films in liquid nitrogen. The fracture surface was sputtered with gold prior to examining the morphology using FESEM. The ATR FTIR spectra of GO and GO/MC composite films were recorded using a Tensor 27 Bruker instrument in the wavelength range of 4000–400 cm−1. The X-ray diffraction pattern of the GO and GO/MC composites were acquired by using a Panalytical Empyrean Multipurpose Diffractometer with zero background. The samples for X-ray diffraction measurements were prepared by attaching the GO and GO/MC composite films on an amorphous sample holder. The instrument was operated at 40 kV and 40 mA current and used Kα (λ = 0.154 nm) as the radiation source. The X-ray diffraction measurements were performed from 2θ = 5° to 40° at a scan rate of 2° min−1. The thermal stabilities of the GO and GO/MC composites were measured using a Simultaneous Thermal Analysis instrument (Netzsch STA 409) at a heating rate of 10 °C min−1 under a nitrogen environment. The mechanical testing of the composite films of uniform thickness was performed using a universal testing machine (Instron 5967) at a strain rate of 2 mm min−1 at 30 °C. The samples for mechanical testing were prepared by cutting the composite films in a dumb-bell shape with a narrow region specimen size of 16 mm × 4 mm × 0.08 mm. Measurements were repeated five times for each composite type to check the reproducibility and to calculate statistical average of mechanical parameters. The oxygen permeation measurements of the MC and different GO/MC composite films were performed by using a permeability testing (MOCON OX-TRAN 2/21SS) instrument.Results and discussion
Composite of MC with GO
MC is a semi-synthetic biopolymer composed of a linear-chain of polysaccharides with partial transformation of hydroxyl groups of cellulose by methoxy functional groups.22 The less substituted hydroxyl region of MC produce a hydrophilic zone and highly substituted regions produce a hydrophobic zone.26a,b It shows a good solubility in water especially at low temperatures due to the increase of hydrogen bonding between functional groups of MC and water molecules. GO also has several oxygen-containing functional groups (–OH, –COOH, and epoxide groups) and unoxidized hydrophobic graphitic domains.23,24 The mixing of an aqueous dispersion of GO with an aqueous solution of MC produces a stable homogenous aqueous dispersion. The good dispersibility of the GO/MC hybrid in aqueous solution is mainly due to better interaction between the GO and MC in the aqueous solution. The oxygen-containing functional groups of MC can interact with the oxygen-containing functional groups of GO via H-bonding interaction and the hydrophobic domain of GO (π conjugated region) interacts with the hydrophobic zone of MC by hydrophobic interaction (CH–π interaction).22,27a,b It is reported that a water-soluble cellulose derivative such as carboxymethylcellulose and methylcellulose is deposited on the graphitic surface of highly ordered pyrolytic graphite by hydrophobic interaction (CH–π interaction) between the cellulosic molecules and the π-conjugated system of HOPG.22,27a GO has many unoxidised graphitic domains. Hence, there is a possibility of hydrophobic interaction of the MC molecules with the unoxidised graphitic domain similar to the HOPG surface. These interactions may facilitate the fabrication of GO/MC composites. The evaporation of solvent from the aqueous solution of pure MC and GO/MC hybrids at room temperature produces good quality flexible films of uniform thickness (∼80 μm). The digital photograph of pure MC and GO/MC composite films are shown in ESI Fig. 1.† There are other references proving that MC can be used to produce films.8a,b With increase of GO content the colour of the composite films changed from light yellow (GO1) to dark brown (GO5). The characterization of the various GO/MC composite films was performed by FTIR, WAXS, STA, and studying the morphology and mechanical and gas barrier properties of the composites.Morphology studies
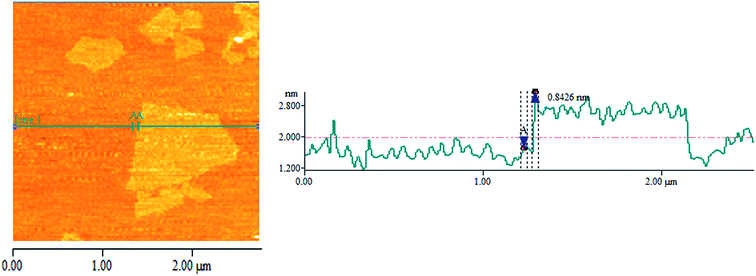
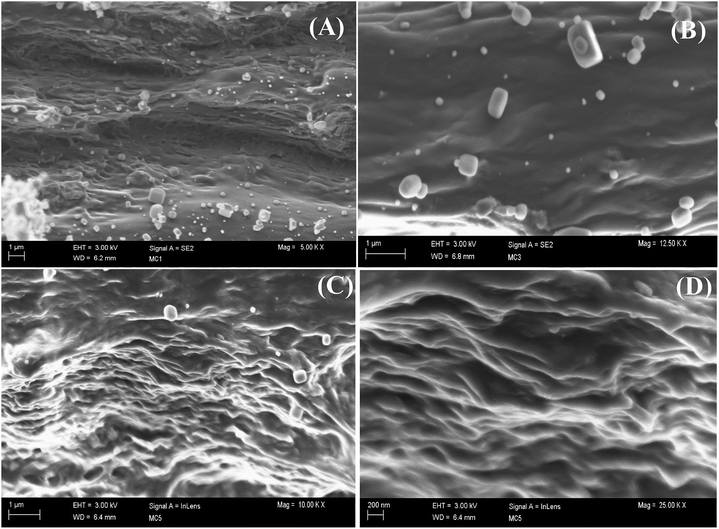
To observe the morphology, a TEM study of GO was performed and is presented in Fig. 1(A) and it shows that GO persists as exfoliated sheets in dilute aqueous solution. The several oxygen-containing functional groups (–OH, –COOH, and epoxide groups) of GO interact with polar aqueous medium to produce exfoliation of GO sheets and produce a stable homogeneous dispersion in aqueous medium. The TEM image also shows that there exist some wrinkled structures on the GO sheets and this indicates that GO sheets are highly flexible in nature.28 Due to the flexible nature and wrinkled structure of the GO sheets, it is feasible to perform a high magnification TEM study of the cross-section of the GO sheet from the edge. The high resolution TEM (HRTEM) image is generally used to see the crystalline nature (lattice fringes) of GO. We have used lanthanum hexaboride filament TEM and, it is very difficult to see the lattice fringes of the crystalline GO from the enlarged TEM image (Fig. 1(B)) using this TEM. However the selected area electron diffraction (SAED) pattern of the GO sheet in Fig. 1(C), shows a diffraction of crystalline nature with a hex-fold symmetry similar to graphite.29,30 Again, there is no clear single line observed at the edge of the cross-section and therefore we cannot claim the presence of single layer GO sheets in dilute aqueous solution from the enlarged TEM images (Fig. 1(B)). To claim the presence of a single layer GO sheet, the AFM image and the corresponding height profile of GO are presented in Fig. 2. The figure shows the sheet-like structure of the GO. It is also obvious from the AFM study that the average thickness of the GO sheet is ∼0.84 nm that correspond to the presence of a single GO sheet31,32 and it indicates the GO sheets remain individually dispersed in dilute aqueous solution (presence of a single layer GO sheet).To investigate the morphology of the GO/MC composite films & dispersion of the GO sheets within the MC matrix, the cross-sectional FESEM images of the pure MC film and the composite films were examined and are presented in ESI Fig. S2† and 3. MC shows a very smooth cross-section with fewer particles.8a In the aqueous solution of MC, there may be a few colloidal particles of MC due to the lower solubility of MC at room temperature. Hence, the evaporation of solvent at room temperature produces a MC film with fewer MC particles. In the composite film, there also exist fewer particles similar to MC. However, in the composite films the amount of particles decreases and with increase of GO concentration the amount of particles reduces significantly. This may be due to enhancement of the solubility of colloidal particles of MC in the presence of GO. The cross-sectional FESEM images of the composites shows thick MC coated GO sheets in the MC matrix. The GO/MC composites are self-assembled during the solvent evaporation to produce layered structure GO/MC composite films. The evaporation of solvent from the high GO content GO/polymer solution18 produces an ultra-strong layered structure GO paper due to the alignment of the GO sheets that originated from gravitational forces exerted by the GO nanosheets. However, in our composite system, the preferential alignment of the GO sheets occurs at a low concentration of GO loading in the MC matrix with the surface of the composite film to produce a layered structure and this may be due to the combined effect of self-alignment of GO sheets in the MC matrix during the evaporation of solvent and the exerted gravitational forces similar to GO/polymer composite paper.18,33
It is reported that the MC molecules are deposited from the dilute aqueous solution onto the HOPG surface by the hydrophobic interaction and the deposited MC molecules remain as individually ordered chains with crosswise overlapping.22 However, with increase of concentration, the oxygen-containing functional groups of MC interact with the water molecules whereas association of the hydrophobic domains between the single MC molecules produces a thermodynamic stable ordered hydrophobic region. Therefore, hydrophobic association of the MC molecules occurs with the progress of evaporation of the solvent due to the increase in concentration of MC in the solution. With evaporation of GO/MC solutions, the hydrophobic associated domains of MC interact with the π cloud of GO22,27 whereas the oxygen-containing functional groups of GO interact with the oxygen-containing functional groups of MC to produce thick MC coated GO sheets (Scheme 1). With further progress of evaporation of this MC coated GO sheet solution, the MC coated GO sheets come closer and form a thermodynamically stable state resulting in a self-assembled structure in highly ordered layered GO/MC composites with complete evaporation of solvent (Scheme 1).
WAXS study
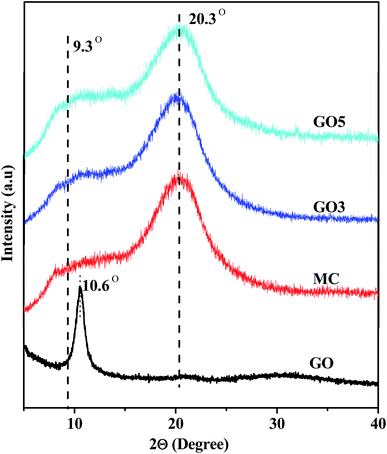
To understand the dispersion of GO and structure of the composite films the WAXS study of GO, MC and various GO/MC composite films was performed and the results are presented in Fig. 4. GO exhibits a typical X-ray diffraction peak at 2θ = 10.6°, and this signifies that the spacing between the interlayer of GO is 0.83 nm.34 MC is a semi-crystalline polymer and it shows characteristic broad hump-like diffraction peaks at 2θ = 9.3° and 20.3 that represent the (110) plane and the (020) plane of MC, respectively.35 The peak at 9.3° corresponds to the trimethylglucose repeating unit of MC and the peak at 2θ = 20.3° corresponds to the intermolecular structure of MC. The composite films show diffraction peaks similar to pure MC films. Generally in layered structure GO/polymer composites the diffraction peak of GO appears due to close stacking of the GO layers in the composites. However, there is no characteristic diffraction peak of GO, in our GO/MC composite films. This indicates that the GO sheets remain individually exfoliated without any aggregation in the polymer matrix and it is reported in numerous literature.36–38FTIR study
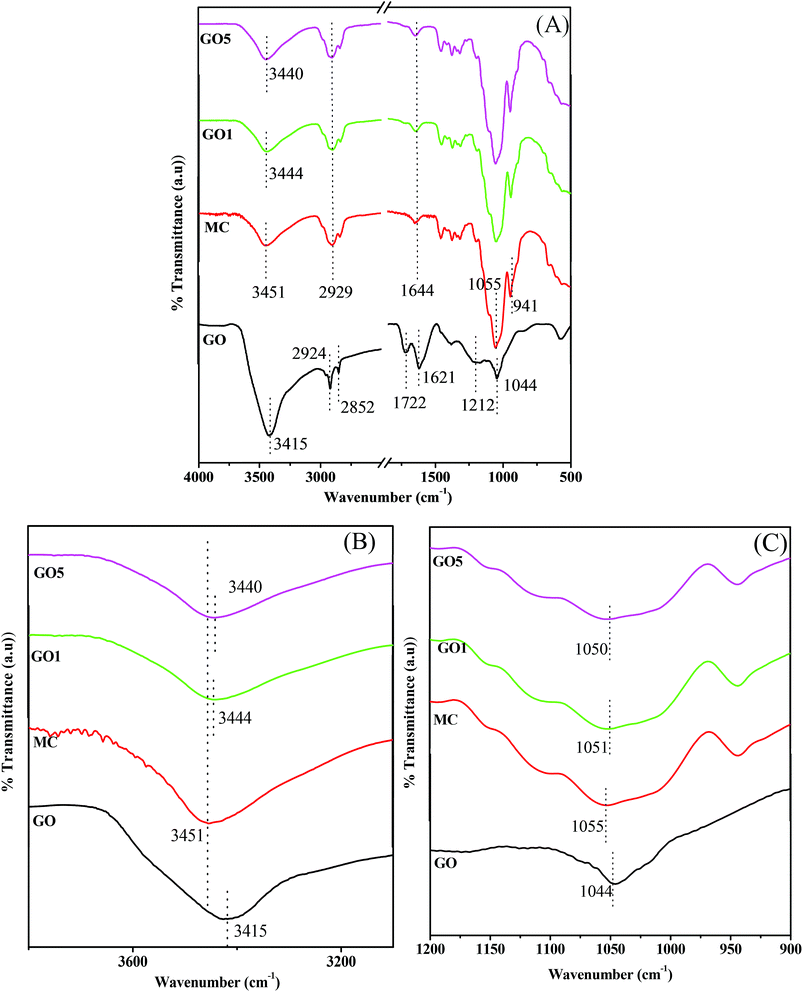
To examine the interaction between MC and GO, the FTIR spectra of GO, pure MC, and the composite films were recorded and are presented in Fig. 5(A). The FTIR spectra of GO mainly shows the characteristic peaks for the different types of oxygen-containing functional groups.39,40 The typical C![[double bond, length as m-dash]](https://www.rsc.org/images/entities/char_e001.gif) O stretching vibration band of carboxylic functional groups appear at ∼1722 cm−1. The characteristic broad band with highest intensity peak at 3415 cm−1 appears due to the O–H stretching vibration of hydroxyl groups of GO and intercalated water molecules present in GO. Beside this, the absorption bands at ∼1212 cm−1 and ∼1044 cm−1 are assigned to the C–OH stretching vibrations of the hydroxyl group and C–O stretching vibrations of epoxy groups, respectively. The skeletal vibration band of the oxidized graphitic zone is visible at ∼1620 cm−1.39,40 Furthermore, the band at ∼2924/2852 cm−1 appears due to C–H stretching of CH2/CH groups that proves the existence of fewer CH2/CH in the GO. The pure MC film shows characteristic broad bands at ∼3451 cm−1 and ∼1055 cm−1 that correspond to the O–H stretching vibration of the hydroxyl group & C–O–C stretching vibration of glucosidic units of MC.8b,41 Furthermore, the absorption bands at ∼2929 cm−1 for the asymmetric C–H stretching of the pyranose unit, 1644 cm−1 for C–H bending vibration, and 941 cm−1 for the OCH3 functional group also appear in the FTIR spectra of the pure MC film.8b,42 In the composite films, the characteristic band of GO is not clear and this may be due to the presence of relatively low proportion of GO compared to MC. The highest intensity position of the peak is considered as the peak position of the broad O–H stretching band. To examine the H-bonding interaction between the functional groups of GO and MC, the shift of this O–H stretching band is observed. In the GO5 composite films, the O–H stretching band appears at ∼3440 cm−1 and it signifies that there is a shift of the O–H stretching band in the GO5 composite film to a lower frequency compared to the pure MC film.. To observe the clear shift of the O–H stretching band, the FTIR spectra of GO, the pure MC film and the GO/MC composite films were enlarged from 3800 cm−1 to 3100 cm−1 and a dotted line was placed at the peak position of MC to observe the clear shift of the peak position in GO5 with respect to MC (Fig. 5(B)). The evidence of H bonding interaction between the filler and polymer matrices, in several types of composite systems, is also supported by the shift of O–H stretching band due to H-bonding interaction between the functional groups of the filler and functional groups of polymers.43,44 Beside this, in the composite films there are peaks of some other functional groups of MC that were also shifted with respect to the pure MC film due to the interaction between the functional groups of GO and MC. The pure MC shows a C–O–C stretching vibration peak at 1055 cm−1, whereas GO5 shows at 1050 cm−1. The lone pair electrons of the ethereal oxygen atom (C–O–C bond) can interact with the H atom of hydroxyl and carboxyl groups via H-bonding interaction. This may cause a slight shift of the C–O–C stretching vibrations peak in GO5 with respect to pure MC (Fig. 5(C)).
O stretching vibration band of carboxylic functional groups appear at ∼1722 cm−1. The characteristic broad band with highest intensity peak at 3415 cm−1 appears due to the O–H stretching vibration of hydroxyl groups of GO and intercalated water molecules present in GO. Beside this, the absorption bands at ∼1212 cm−1 and ∼1044 cm−1 are assigned to the C–OH stretching vibrations of the hydroxyl group and C–O stretching vibrations of epoxy groups, respectively. The skeletal vibration band of the oxidized graphitic zone is visible at ∼1620 cm−1.39,40 Furthermore, the band at ∼2924/2852 cm−1 appears due to C–H stretching of CH2/CH groups that proves the existence of fewer CH2/CH in the GO. The pure MC film shows characteristic broad bands at ∼3451 cm−1 and ∼1055 cm−1 that correspond to the O–H stretching vibration of the hydroxyl group & C–O–C stretching vibration of glucosidic units of MC.8b,41 Furthermore, the absorption bands at ∼2929 cm−1 for the asymmetric C–H stretching of the pyranose unit, 1644 cm−1 for C–H bending vibration, and 941 cm−1 for the OCH3 functional group also appear in the FTIR spectra of the pure MC film.8b,42 In the composite films, the characteristic band of GO is not clear and this may be due to the presence of relatively low proportion of GO compared to MC. The highest intensity position of the peak is considered as the peak position of the broad O–H stretching band. To examine the H-bonding interaction between the functional groups of GO and MC, the shift of this O–H stretching band is observed. In the GO5 composite films, the O–H stretching band appears at ∼3440 cm−1 and it signifies that there is a shift of the O–H stretching band in the GO5 composite film to a lower frequency compared to the pure MC film.. To observe the clear shift of the O–H stretching band, the FTIR spectra of GO, the pure MC film and the GO/MC composite films were enlarged from 3800 cm−1 to 3100 cm−1 and a dotted line was placed at the peak position of MC to observe the clear shift of the peak position in GO5 with respect to MC (Fig. 5(B)). The evidence of H bonding interaction between the filler and polymer matrices, in several types of composite systems, is also supported by the shift of O–H stretching band due to H-bonding interaction between the functional groups of the filler and functional groups of polymers.43,44 Beside this, in the composite films there are peaks of some other functional groups of MC that were also shifted with respect to the pure MC film due to the interaction between the functional groups of GO and MC. The pure MC shows a C–O–C stretching vibration peak at 1055 cm−1, whereas GO5 shows at 1050 cm−1. The lone pair electrons of the ethereal oxygen atom (C–O–C bond) can interact with the H atom of hydroxyl and carboxyl groups via H-bonding interaction. This may cause a slight shift of the C–O–C stretching vibrations peak in GO5 with respect to pure MC (Fig. 5(C)).
Thermal properties
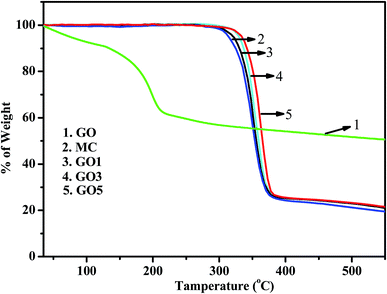
To examine the degree of functionalization of GO and the thermal stability of GO & GO/MC composites the Simultaneous Thermal Analysis (STA) studies of GO and GO/MC composites were performed. The STA thermograms are shown in Fig. 6. From the figure it is clear that GO is highly unstable with temperature and it begins to lose its weight at temperatures less than 100 °C due to the elimination of intercalated water existing in the GO molecules.45,46 Furthermore, within the temperature range of 100–250 °C, the thermogram of GO shows a fast degradation (loss of weight) due to the elimination of functional groups (easy removal of oxygen-containing moieties) of GO.45,46 Within this temperature region, the thermogram of GO shows 31.2% loss of weight and this signifies that 31.2 wt% oxygen-containing functional moieties are present in GO.The thermogram of pure MC shows an onset degradation temperature of ∼322 °C. GO5 shows an onset degradation temperature of 330 °C. This signifies that with the integration of GO in the MC matrix, the onset degradation temperature enhanced slightly for the GO5 film compared to the pure MC film. The char residue of the MC and GO/MC composites at 550 °C has been calculated and are presented in ESI Table S1.† From the thermogram, it is obvious that GO5 shows 3 wt% higher residual weight compared to pure MC. There is a very small amount of enhancement of the char residues of the composites compared to pure MC. The pure MC shows a char residue of 19.3 wt%, whereas GO5 shows a char residue of 22.3 wt%. Hence, the thermal stability of the GO/composite is enhanced slightly compared to that of pure MC. The interfacial interaction between the functional groups GO and MC molecules may cause this slight enhancement of the thermal stability of GO/MC composites. Our GO/MC composite system is very similar to other GO based polymer composite systems that enhanced the thermal stability of the polymer composites due to H-bonding interaction between the GO and polymer matrix.24
Mechanical properties
Appropriate mechanical properties of the GO/MC composite films are essential for envisioned application of this biopolymer composite for consumer products, packaging, and various engineering applications. The mechanical properties of the composites were examined by performing tensile testing. The determined stress–strain curves of the pure MC film and the various GO/MC composite films are presented in Fig. 7(A). The characteristic values of the mechanical parameters, i.e. stress at break and the Young's modulus, were obtained from instrumental software in terms of engineering stress. Each series of films were examined five times and five different values of stress at break and Young's modulus were tabulated. The representative mean stress at break and Young's modulus of the pure MC film and the various GO/MC composite films are presented in a bar diagram with error bars based on the standard deviation (Fig. 7(B and C)).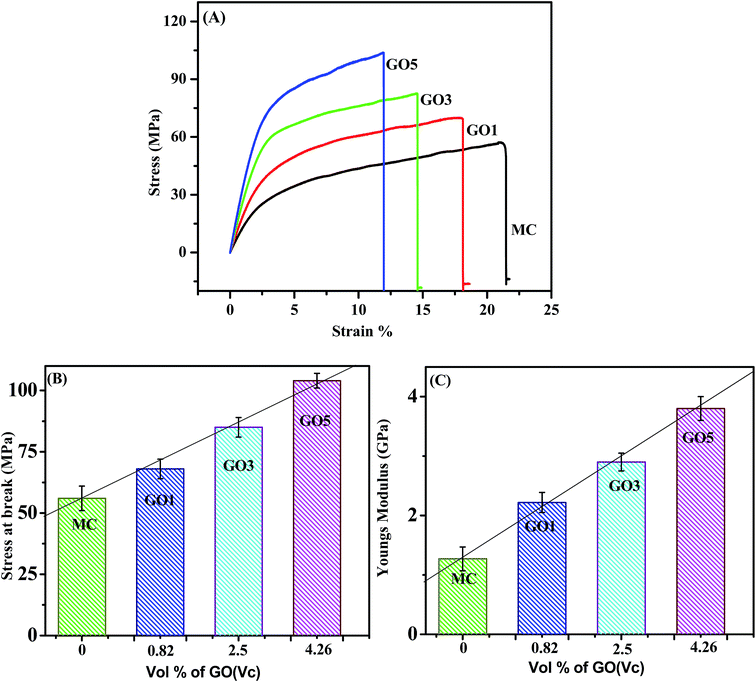 | ||
| Fig. 7 (A) Stress–strain curve of the various GO/MC composites, statistical average bar diagram with error bars of the (B) stress at break and (C) Young's modulus with the vol% of GO. | ||
According to the graphs, it is clear that the stress at break of the composite films increased, and the elongation at break decreased, with increasing GO loading compared to the pure MC film. The pure MC film experienced an elongation at break of 22 ± 4% whereas the GO5 film experienced an elongation at break of 11.6 ± 3%. These strain levels indicate that the composite films became stiffer and more brittle compared to pure MC films. It should be noted that the stress at break and Young's modulus of the layered GO/MC composite film were enhanced significantly compared to the conventional polymer/graphene composite systems reported in the literature.47 The pure MC film showed a stress at break and Young's modulus of 56 ± 4 MPa and 1.27 ± 0.2 GPa, respectively. The GO5 composite showed an enhancement of stress at break and Young's modulus with values of 104 ± 3 MPa and 3.8 ± 0.2 GPa. The effect of reinforcement of small volume fractions (Vf) of GO in the MC matrix can be quantitatively assessed by evaluating the rates of increase of Young's modulus (dYc/dVf) and tensile stress (drc/dVf).48,49 It is well established that according to a simple shear lag model the ductile polymer composites show linear relationships of mechanical properties with the volume fraction of two-dimensional nanofillers.50 The integration of carbon nanotubes (one-dimensional nanofillers) into the polymer matrix also shows a similar type of phenomenon.51 The composite films show a higher stress at break and Young's modulus compared to pure MC films. With increasing GO concentration, both the stress at break and Young's modulus of the composites increase linearly (see Fig. 7(B) and (C)). Hence, the dYc/dVf and drc/dVf values can be calculated from the slope of the linear fitting plot of Yc and rcversus the volume fraction of GO. Here, the calculated drc/dVf and dYc/dVf are 1.17 GPa and 60 MPa respectively. The effective integration of graphene sheets improves the mechanical properties of the graphene based polymer composite films and this reinforcement behaviour is very common.24,51 The homogeneous nanointegration and strong interfacial interaction between the nanomaterial and polymer matrices can transfer load from the nanomaterial to the polymer matrix. The enhancement of the mechanical performance of polymer composites has been recently reported for several graphene/polymer composite systems.36,52 There are a few recent articles in the literature showing that the layered structure in GO/polymer composites plays a significant role in the enhancement of the mechanical properties and this type of layered structure formation can occur via vacuum filtration or via solvent evaporation at a high concentration of graphene content in the polymer matrix.19,21 However, in our case, the cross-sectional FESEM images of GO/MC composites clearly show a layered-structure morphology with molecular level dispersion of GO sheets in the MC matrix at a low concentration of GO loading (5 wt% and lower). Hence, not only GO integration & strong interfacial interaction between GO and the MC matrix but also the formation of a layered structure in GO/polymer composites play a significant role in the enhancement of the mechanical properties of GO/MC composites.
The mechanical properties of the nanoparticle reinforced composites are dependent on the size, shape and orientation of the fillers, and the load transfer efficiency between the particle and the polymer matrix. A variety of micromechanical models have been developed to analyze and predict the mechanical properties of polymer nanocomposites. Simple models such as the Halpin–Tsai model provide analytical, closed form predictions of the composite modulus based on the moduli of the matrix and reinforcement, the volume fraction of filler, and a filler shape factor (e.g., aspect ratio).53 Even though these models make many assumptions such as idealized filler geometries, dispersion and perfect interfacial adhesion, there is considerable literature showing that these micromechanical models can give good predictions of the modulus.
The Halpin–Tsai method is very popular in both micro and nanomechanics because of its simplicity and it is possible to calculate the longitudinal and transverse properties of the composites. Shokrieh and Moshrefzadeh-Sani54 reported that for platelet reinforcements such, as graphene, the relation for the longitudinal and transverse moduli is given by:
where, Em and EG are the elastic moduli of the matrix and graphene oxide reinforcement, respectively. Also, ζ is the shape factor and is 2l/t (where l and t are the length and thickness of the platelet reinforcement, respectively). For the GO-MC composite, the matrix modulus was 1180 MPa, while a modulus of 208 GPa was used for the graphene-oxide filler based on literature values.55,56 The aspect ratio (length/thickness) for the graphene-oxide is found to be 1500 and the similar type of aspect ratio is also reported in the literature.54
The composite modulus Ec is calculated from the longitudinal and transverse moduli using the relation
| Ec = aEL + (1 − a)ET |
Additionally, a modified Halpin–Tsai equation was also used to consider the maximum volumetric packing fraction of the filler, i.e. true volume of the filler/apparent volume occupied by the filler.57 This is accomplished by including ϕm to the Halpin–Tsai equation and for graphene nanocomposites a value of 0.05 has been recommended.
Shokrieh and Moshrefzadeh-Sani54 developed another modified version of the Halpin–Tsai equation to avoid using a constant value for the orientation factor a. They developed a relation for platelet reinforcements based on back-calculating the value of a with a Mori–Tanaka Laminated analogy model.
Another method used for finding the effective properties of nanocomposites is the use of Mean-Field Homogenization (MFH) using the Mori–Tanaka model in Digimat multiscale modelling software.58 The model assumes that each inclusion behaves as if it was isolated in the matrix, and a Representative Volume Element (RVE) is treated as a single inclusion problem subjected to a strain corresponding to the average strain in the matrix phase. The RVE is decomposed into a number of grains, called pseudo-grains, with unidirectional alignment. Each pseudo-grain expresses a unique segment in space, representing a specific angular increment. The homogenization of the unidirectional pseudo-grains is then performed in two steps. First, each pseudo-grain is homogenized according to the Mori–Tanaka model. In the second step, the collective homogenized response of the pseudo-grains is computed resulting in the final response of the RVE. Here, the Voigt model is used which assumes that the macro stiffness is equal to the volume average of the micro stiffness.
A comparison of the Young's modulus predicted by the different micromechanical models is given in Fig. 8. It can be seen that despite the assumptions of the simplified models, the stiffness of the GO-MC composite was predicted with reasonable accuracy. The models based on the Halpin–Tsai equation have similar values with the modified models predicting a slightly higher modulus. Especially at higher volume fractions, the predicted modulus is higher than the experimentally measured modulus, suggesting the assumption of aligned 2D dispersion sets the higher bound for the properties. It can be seen that the Mori–Tanaka model was the most accurate model with errors of 12%, 3.9% and 3.3% for the different volume fractions.
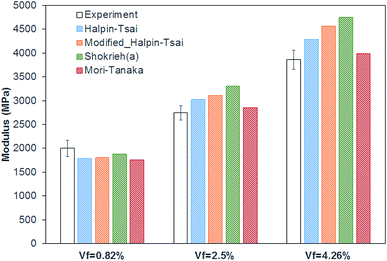 | ||
| Fig. 8 Comparison of the Young's modulus of GO/MC composites predicted by different micromechanical models. | ||
Gas barrier properties
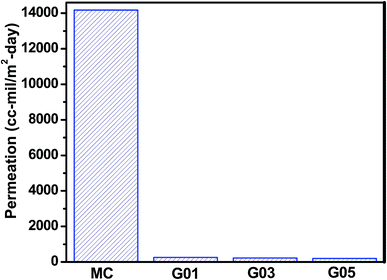
The gas barrier properties of pure MC and the GO/MC composite films were investigated by measuring oxygen gas permeation through the films at 25 °C and the obtained results are shown in Fig. 9. From the figure it is clear that the pure MC film shows a high value of oxygen permeation of 14![[thin space (1/6-em)]](https://www.rsc.org/images/entities/char_2009.gif) 180.94 cm3 [m−2 day−1] while the oxygen gas permeation reduced intensely with the integration of a low concentration of GO (1 wt% with respect to MC) into the MC matrix. The GO1 shows an oxygen permeation of 254.89 cm3 [m−2 day−1] and this indicates a 98.5% decrease in the oxygen permeation of GO1 compared to pure MC films. The GO3 and GO5 show oxygen permeations of 224.05 cm3 [m−2 day−1] and 196.34 cm3 [m−2 day−1], respectively; suggesting that on further increase of GO concentration (GO3 and GO5) the gas barrier properties improved slightly compared to GO1. The good compatibility, homogeneous dispersion, exfoliation and alignment of the impermeable fillers59,60 within the polymer matrix play a key role in enhancing the gas barrier properties of the polymer composites significantly. Actually, the good alignment of the impermeable fillers with the surface of the composite matrix produces a large tortuous pathway16,17 and prevents the gas molecules from passing through it. There are numerous defects present on the basal plane of the GO61 and gas molecules can pass easily through these defect sites. Hence, GO is not a good impermeable filler. However, the non-defective graphitic moiety (aromatic ring of GO) of GO has a much smaller geometric pore size and high electron density, thereby not allowing the passage of any molecules through the site. GO is a platelet-like carbon nanomaterial (similar to graphene) with a large aspect ratio and contains several hydrophilic functional groups that help produce interlocked GO papers from aqueous solutions. This interlocked GO paper exhibits excellent gas barrier properties due to the layered structure formation, where gas molecules that pass through the defect site of one GO sheet are stopped by the nondefective site of the adjacent GO sheet.62,63 Our GO/MC composites system produces a self-assembled highly oriented layered structure due to hydrophobic and H-bonding interaction between the GO and MC molecules and quite resemble the GO papers. In addition, the GO sheets are highly compatible with the MC matrix. In the composite film, GO sheets remain as MC coated GO sheets due to H-bonding and hydrophobic interaction between the GO and MC. Hence, the GO/MC composites produce a large tortuous path for the gas molecules and show a dramatic decrease of oxygen gas permeation.
180.94 cm3 [m−2 day−1] while the oxygen gas permeation reduced intensely with the integration of a low concentration of GO (1 wt% with respect to MC) into the MC matrix. The GO1 shows an oxygen permeation of 254.89 cm3 [m−2 day−1] and this indicates a 98.5% decrease in the oxygen permeation of GO1 compared to pure MC films. The GO3 and GO5 show oxygen permeations of 224.05 cm3 [m−2 day−1] and 196.34 cm3 [m−2 day−1], respectively; suggesting that on further increase of GO concentration (GO3 and GO5) the gas barrier properties improved slightly compared to GO1. The good compatibility, homogeneous dispersion, exfoliation and alignment of the impermeable fillers59,60 within the polymer matrix play a key role in enhancing the gas barrier properties of the polymer composites significantly. Actually, the good alignment of the impermeable fillers with the surface of the composite matrix produces a large tortuous pathway16,17 and prevents the gas molecules from passing through it. There are numerous defects present on the basal plane of the GO61 and gas molecules can pass easily through these defect sites. Hence, GO is not a good impermeable filler. However, the non-defective graphitic moiety (aromatic ring of GO) of GO has a much smaller geometric pore size and high electron density, thereby not allowing the passage of any molecules through the site. GO is a platelet-like carbon nanomaterial (similar to graphene) with a large aspect ratio and contains several hydrophilic functional groups that help produce interlocked GO papers from aqueous solutions. This interlocked GO paper exhibits excellent gas barrier properties due to the layered structure formation, where gas molecules that pass through the defect site of one GO sheet are stopped by the nondefective site of the adjacent GO sheet.62,63 Our GO/MC composites system produces a self-assembled highly oriented layered structure due to hydrophobic and H-bonding interaction between the GO and MC molecules and quite resemble the GO papers. In addition, the GO sheets are highly compatible with the MC matrix. In the composite film, GO sheets remain as MC coated GO sheets due to H-bonding and hydrophobic interaction between the GO and MC. Hence, the GO/MC composites produce a large tortuous path for the gas molecules and show a dramatic decrease of oxygen gas permeation.
Conclusion
In conclusion, we have successfully fabricated a novel layered structure GO/MC composite at a low concentration of GO loading by using a simple solvent evaporation assisted assembly of GO and MC for the first time. The ATR-FTIR, WAXS, and STA analysis confirm the successful integration of GO into the MC matrix. The analysis of FESEM supports the good dispersion of GO sheets in the MC matrix and the fabrication of layered structure GO/MC composites. The interaction of hydrophobic associated domains of MC with the π cloud of GO (hydrophobic interaction) and oxygen-containing functional groups of MC with oxygen-containing functional groups of GO (H-bonding interaction) govern the fabrication of thick MC coated layered structure GO/MC composites. The GO/MC composite films are highly flexible in nature and show significant enhancement of mechanical and oxygen gas barrier properties compared to pure MC films due to the strong interfacial interaction between GO & MC, homogeneous dispersion of GO sheets into the MC matrix and preferential alignment of the GO sheets into the composites. GO5 showed 86% and 201% improvement in ultimate stress and Young's modulus, respectively, compared to pure MC. GO1 shows a 98% decrease of oxygen permeation compared to pure MC. The improved mechanical and oxygen gas barrier properties of the GO/MC composites may have potential applications for many biobased consumer products, packaging and engineering applications.Conflicts of interest
There is no conflict of interest to declare.Acknowledgements
This study was supported by the president postdoctoral program of Tampere University of Technology, Finland.References
- S. E. M. Selke, J. D. Cutler and R. J. Hernandez, Plastics Packaging: Properties, Processing, Applications, and Regulations, Hansen Garner Publications, Inc., Cincinnati, OH, 2004, pp. 2–6 Search PubMed.
- J. Lange and Y. Wyser, Packag. Technol. Sci., 2003, 16, 149 CrossRef.
- M. Nogi, S. Iwamoto, A. N. Nakagaito and H. Yano, Adv. Mater., 2009, 20, 1 Search PubMed.
- M. Moller, D. Kunz, T. Lunkenbein, S. Sommer, A. Nennemann and J. Breu, Adv. Mater., 2012, 24, 2142 CrossRef PubMed.
- Y. Pana, M. Farmahini-Farahanib, P. O'Hearnb, H. Xiaob and H. Ocampob, Journal of Bioresources and Bioproducts, 2016, 1, 106 Search PubMed.
- S. J. Sijtsema, M. C. Onwezen, M. J. Reinders, H. Dagevos, A. Partanen and M. Meeusen, NJAS – Wageningen J. Life Sci., 2016, 77, 61 CrossRef.
- (a) M. Imran, S. El-Fahmy, A. M. Revol-Junelles and S. Desobry, Carbohydr. Polym., 2010, 81, 219 CrossRef; (b) P. L. Nasatto, F. Pignon, J. L. M. Silveira, M. E. R. Duarte, M. D. Noseda and M. Rinaudo, Polymers, 2015, 7, 777 CrossRef.
- (a) C. M. Noronha, S. M. de Carvalho, R. C. Lino and P. L. M. Barreto, Food Chem., 2014, 159, 529 CrossRef PubMed; (b) D. Maity, M. M. R. Mollick, D. Mondal, B. Bhowmick, M. K. Bain, K. Bankura, J. Sarkar, K. Acharya and D. Chattopadhyay, Carbohydr. Polym., 2012, 90, 1818 CrossRef PubMed.
- J. J. Kochumalayil, M. Bergenstrahle-Wohlert, S. Utsel, L. Wagberg, Q. Zhou and L. A. Berglund, Biomacromolecules, 2013, 14, 84 CrossRef PubMed.
- A. J. Benítez, F. Lossada, B. Zhu, T. Rudolph and A. Walther, Biomacromolecules, 2016, 17, 2417 CrossRef PubMed.
- K. Shahzadi, I. Mohsin, L. Wu, X. Ge, Y. Jiang, H. Li and X. Mu, ACS Nano, 2017, 11, 325 CrossRef PubMed.
- Q. Zhao, Q. F. An, T. Liu, J. T. Chen, F. Chen, K. R. Leeb and C. J. Gaod, Polym. Chem., 2013, 4, 4298 RSC.
- V. Berry, Carbon, 2013, 62, 1 CrossRef.
- O. Leenaerts, B. Partoens and F. Peeters, Appl. Phys. Lett., 2008, 93, 193107 CrossRef.
- J. S. Bunch, S. S. Verbridge, J. S. Alden, A. M. Van Der Zande, J. M. Parpia, H. G. Craighead and P. L. McEuen, Nano Lett., 2008, 8, 2458 CrossRef PubMed.
- Y. H. Yang, L. Bolling, M. A. Priolo and J. C. Grunlan, Adv. Mater., 2013, 25, 503 CrossRef PubMed.
- R. K. Layek, A. K. Das, M. U. Park, N. H. Kim and J. H. Lee, J. Mater. Chem. A, 2014, 2, 12158 RSC.
- Y. Q. Li, T. Yu, T. Y. Yang, L. X. Zheng and K. Liao, Adv. Mater., 2012, 24, 3426 CrossRef PubMed.
- K. W. Putz, O. C. Compton, M. J. Palmeri, S. T. Nguyen and L. C. Brinson, Adv. Funct. Mater., 2010, 20, 3322 CrossRef.
- H. Liu, T. Kuila, N. H. Kim, B. C. Kud and J. H. Lee, J. Mater. Chem. A, 2013, 1, 3739 RSC.
- Y. Xu, W. Hong, H. Bai, C. Li and G. Shi, Carbon, 2009, 3, 3538 CrossRef.
- S. Yokota, T. Ueno, T. Kitaoka, D. Tatsumi and H. Wariishi, Biomacromolecules, 2007, 8, 3848 CrossRef PubMed.
- A. Kundu, R. K. Layek and A. K. Nandi, J. Mater. Chem., 2012, 22, 8139 RSC.
- R. K. Layek, A. Kundu and A. K. Nandi, Macromol. Mater. Eng., 2013, 298, 1166 CrossRef.
- W. S. Hummers Jr and R. E. Offeman, J. Am. Chem. Soc., 1958, 80, 1339 CrossRef.
- (a) P. W. Arisz, H. J. J. Kauw and J. J. Boon, Carbohydr. Res., 1995, 271, 1 CrossRef; (b) F. Debeaufort and A. Voilley, Cellulose, 1995, 2, 205 CrossRef.
- (a) T. Ueno, S. Yokota, T. Kitaoka and H. Wariishi, Carbohydr. Res., 2007, 342, 954 CrossRef PubMed; (b) V. Spiwok, Molecules, 2017, 22, 1038 CrossRef PubMed.
- R. K. Layek, A. K. Das, M. J. Park, N. H. Kim and J. H. Lee, Carbon, 2015, 81, 329 CrossRef.
- K. Chen, S. Song and D. Xue, J. Mater. Chem. A, 2015, 3, 2441 RSC.
- K. H. Kim, M. Yang, K. M. Cho, Y. S. Jun, S. B. Lee and H. T. Jung, Sci. Rep., 2013, 3, 3251 CrossRef PubMed.
- O. Akhavan, E. Ghaderi, E. Hashemi and R. Rahighi, Nanoscale, 2014, 6, 14810 RSC.
- H. C. Schniepp, J. L. Li, M. J. McAllister, H. Sai, M. Herrera-Alonso, D. H. Adamson, R. K. Prud'homme, R. Car, D. A. Saville and I. A. Aksay, J. Phys. Chem. B, 2006, 110, 8535 CrossRef PubMed.
- X. Lin, X. Shen, Q. Zheng, N. Yousefi, L. Ye, Y. W. Mai and J. K. Kim, ACS Nano, 2012, 6, 10708 CrossRef PubMed.
- L. J. Cote, R. Cruz-Silva and J. Huang, J. Am. Chem. Soc., 2009, 131, 11027 CrossRef PubMed.
- R. Nishida and M. Takahashi, Polym. J., 2008, 40, 148 CrossRef.
- (a) J. J. Liang, Y. Huang, L. Zhang, Y. Wang, Y. F. Ma, T. Y. Guo and Y. S. Chen, Adv. Funct. Mater., 2009, 19, 2297 CrossRef; (b) X. Zhao, Q. Zhang and D. Chen, Macromolecules, 2010, 43, 2357 CrossRef.
- H. K. Dave and K. Nath, Journal of Water Process Engineering, 2016, 14, 124 CrossRef.
- Q. Bian, H. Tian, Y. Wang, Q. Liu, X. Ge, A. V. Rajulu and A. Xiang, Polym. Sci., Ser. A, 2015, 57, 836 CrossRef.
- S. Stankovich, R. D. Piner, S. T. Nguyen and R. S. Ruoff, Carbon, 2006, 44, 3342 CrossRef.
- R. K. Layek, A. Kuila, D. P. Chatterjee and A. K. Nandi, J. Mater. Chem. A, 2013, 1, 10863 RSC.
- B. M. Liebeck, N. Hidalgo, G. Roth, C. Popescu and A. Boker, Polymers, 2017, 9, 91 CrossRef.
- D. M. Suflet, G. C. Chitanu and V. I. Popa, React. Funct. Polym., 2006, 66, 1240 CrossRef.
- W. Zhang, A. A. Dehghani-Sanij and R. S. Blackburn, Prog. Nat. Sci., 2008, 18, 7801 Search PubMed.
- S. J. Park, F. L. Jin and C. Lee, Mater. Sci. Eng., A, 2005, 402, 335 CrossRef.
- J. Shen, Y. Hu, C. Li, C. Qin, M. Shi and M. Ye, Langmuir, 2009, 25, 6122 CrossRef PubMed.
- M. J. McAllister, J. L. Li, D. H. Adamson, H. C. Schniepp, A. A. Abdala, J. Liu, M. Herrera-Alonso, D. L. Milius, R. Car, R. K. Prud'homme and I. A. Aksay, Chem. Mater., 2007, 19, 4396 CrossRef.
- W. H. Kai, Y. Hirota, L. Hua and Y. Inoue, J. Appl. Polym. Sci., 2008, 107, 1395 CrossRef.
- L. J. Bonderer, A. R. Studart and L. J. Gauckler, Science, 2008, 319, 1069 CrossRef PubMed.
- J. N. Coleman, U. Khan, W. J. Blau and Y. K. Gun'ko, Carbon, 2006, 44, 1624 CrossRef.
- L. J. Bonderer, A. R. Studart and L. J. Gauckler, Science, 2008, 319, 1069 CrossRef PubMed.
- H. Kim, A. A. Abdala and C. W. Macosko, Macromolecules, 2010, 43, 6515 CrossRef.
- N. D. Luong, N. Pahimanolis, U. Hippi, J. T. Korhonen, J. Ruokolainen, L.-S. Jansson, J.-D. Namd and J. Seppälä, J. Mater. Chem., 2011, 21, 13991 RSC.
- J. R. Potts, O. Shankar, L. Du and R. S. Ruoff, Macromolecules, 2012, 45, 6045 CrossRef.
- M. M. Shokrieh and H. Moshrefzadeh-Sani, Polymer, 2016, 106, 14 CrossRef.
- J. W. Suk, R. D. Piner, J. An and R. S. Ruoff, ACS Nano, 2010, 4, 6557 CrossRef PubMed.
- I. U. Unalan, C. Wan, Ł. F. Figiel, R. T. Olsson, S. Trabattoni and S. Farris, Nanotechnology, 2015, 26, 2015 CrossRef PubMed.
- Y. P. Wu, Q. X. Jia, D. S. Yu and L. Q. Zhang, Polym. Test., 2004, 23, 903 CrossRef.
- E-Xtream Engineering, Digimat 6.1.1 Manual, 2015 Search PubMed.
- K. Yano, A. Usuki and A. Okada, J. Polym. Sci., Part A: Polym. Chem., 1997, 35, 2289 CrossRef.
- C. Xiang, P. J. Cox, A. Kukovecz, B. Genorio, D. P. Hashim, Z. Yan, Z. Peng, C. Hwang, G. Ruan, E. L. G. Samuel, P. M. Sudeep, Z. Konya, X. R. Vajtai, P. M. Ajayan and J. M. Tour, ACS Nano, 2013, 7, 10380 CrossRef PubMed.
- B. M. Yoo, H. J. Shin, H. W. Yoon and H. B. Park, J. Appl. Polym. Sci., 2014, 131, 39628 CrossRef.
- P. Sun, M. Zhu, K. Wang, M. Zhong, J. Wei, D. Wu, Z. Xu and H. Zhu, ACS Nano, 2013, 7, 428 CrossRef PubMed.
- L. Yu, Y.-S. Lim, J. H. Han, K. Kim, J. Y. Kim, S. Y. Choi and K. Shin, Synth. Met., 2012, 162, 710 CrossRef.
Footnote |
| † Electronic supplementary information (ESI) available. See DOI: 10.1039/c8ta03651a |
| This journal is © The Royal Society of Chemistry 2018 |

