 Open Access Article
Creative Commons Attribution 3.0 Unported Licence
Heterostructured WO3@CoWO4 bilayer nanosheets for enhanced visible-light photo, electro and photoelectro-chemical oxidation of water†
Huayang
Zhang‡
a,
Wenjie
Tian‡
a,
Yunguo
Li‡
 c,
Hongqi
Sun
 *b,
Moses O.
Tadé
a and
Shaobin
Wang
 *a
*a
aDepartment of Chemical Engineering, Curtin University, GPO Box U1987, WA 6845, Australia. E-mail: shaobin.wang@curtin.edu.au
bSchool of Engineering, Edith Cowan University, 270 Joondalup Drive, Joondalup, WA 6027, Australia. E-mail: h.sun@ecu.edu.au
cDepartment of Earth Sciences, University College London, Gower Street, London WC1E 6BT, UK
First published on 27th February 2018
Abstract
Herein, a facile interface-induced synthesis method is first established to newly fabricate two-dimensional (2D) bilayer nanosheets of WO3@CoWO4 as highly efficient catalysts for enhanced photo, electro and photoelectro-chemical oxygen evolution reactions (OERs). The heterostructure and the interfacial oxygen vacancy of WO3@CoWO4 reduce the energy barriers in the OER. Density functional theory (DFT) calculations and material characterizations reveal that the WO3@CoWO4 p–n heterojunction endows the composite with a narrowed band gap for better visible-light harvesting, rapid charge transfer across the interface and a lower recombination rate of the photo-excited carriers. The interface O-vacancy vests the active Co site with an enhanced density of state (DOS) at the valence band maximum (VBM), which can increase the concentration of the photogenerated holes to improve photocatalytic and photoelectrochemical (PEC) activity. This study presents a proof-of-concept design towards low cost and multi-metal 2D/2D nanosheets for water oxidation applications.
1. Introduction
As an emerging technology for solar energy conversion and storage, photocatalytic and photoelectrochemical (PEC) splitting of water into H2 and O2 has attracted tremendous attention for sustainable environment and energy development.1–3 In this course, decomposition of water to dissociative oxygen (known as water oxidation or OER) is kinetically sluggish, due to the multi-step, four-electron and multi-proton transfer processes. Rational design of efficient photocatalytic or PEC water oxidation catalysts (WOCs) is essential for advancing the technologies toward efficient water-splitting into hydrogen.4,5 Enormous efforts have been devoted to pursuing suitable semiconductor materials that can achieve efficient solar-energy-conversion and propel the complex water oxidation reactions by photo-generated holes.6,7 Among them, low-cost tungsten oxide (WO3) has emerged as a promising n-type and visible-light-active semiconductor material, which possesses up to 12% solar spectrum absorption with a bandgap energy of 2.7 eV.8,9 Nonetheless, the low photon energy conversion efficiency, instability caused by photo-corrosion, and poor kinetics of pristine WO3 usually result in unsatisfactory activity in the OER.10,11It was revealed that WO3 in a 2D nanosheet configuration has planar conduction channels, promoting the exposure of catalytically active facets to accelerate fast transport of the photoexcited charge carriers.12,13 However, the long migration route in WO3 makes it easy for electron–hole recombination. To solve this problem, construction of a heterojunction composite using two semiconductors is an excellent strategy.14,15 As a p-type semiconductor with low cost and high stability, cobalt tungstate (CoWO4) has drawn our attention. We project that coupling WO3 nanosheets with CoWO4 nanosheets in a p–n heterostructure would be a promising WOC candidate. However, specific challenges have to be addressed in the synthesis of WO3 nanosheets because it is a nonlayered compound and lacks the driving force for 2D anisotropic growth.16 Therefore, the design and integration of CoWO4–WO3 bilayered nanosheets are much more difficult. To the best of our knowledge, no such material has been attempted and reported.
In this work, we elaborately propose a hydrothermal method to generate WO3 nanosheets. Then, a scalable interface-induced strategy for bilayer formation was established by coating CoWO4 onto WO3 to obtain 2D WO3@CoWO4 bilayer hybrids. In this format, CoWO4 produces benefits to the photocatalytic or PEC OER with triple functions: (i) construction of a WO3@CoWO4 p–n heterojunction; (ii) prevention of WO3 from corrosion; (iii) CoWO4 as an active OER electrocatalyst17–19 to serve as a cocatalyst to promote the photocatalytic OER. For the first time, evident enhancement of electrochemical, visible-light photocatalytic and PEC water oxidation performance was verified simultaneously. Moreover, we performed DFT calculations for structural insights into the enhanced electro/photo-chemical and PEC activities of WO3@CoWO4 nanosheets.
2. Experimental section
2.1. Synthesis of WO3 nanosheets
WO3 nanosheets were synthesized via a hydrothermal method. In detail, 0.38 g of tungstic acid was dispersed in 27 mL deionized (DI) water, followed by dissolving 0.5 g thiourea in the solution. The suspension was then transferred into a 50 mL Teflon liner and sealed in an autoclave. The autoclave was heated at 180 °C for 24 h. The precipitates were separated using a centrifuge and washed with DI water and ethanol several times. Finally, WO3 powders were obtained after drying at 60 °C.2.2. Synthesis of WO3@CoWO4 nanosheet composites
The obtained WO3 (0.1 g) was dispersed into 10 mL DI water under stirring for 10 min at room temperature. After that, certain amount of Co(NO3)2·6H2O was added into the suspension solution and stirred for another 10 min. Then, 2.5 mL ammonium hydroxide solution was added dropwise into the above solution and stirred for 1 h at room temperature before evaporating at 80 °C. Finally, the residual powders were collected and heated at 300 °C for 2 h under air with a heating rate of 5 °C min−1. The synthesized catalysts were designated as WO3@CoWO4-1, WO3@CoWO4-2, WO3@CoWO4-3, WO3@CoWO4-4, and WO3@CoWO4-5 according to the different additive amounts of Co(NO3)2·6H2O at 3.2 mg, 6.4 mg, 9.6 mg, 64 mg and 128 mg, respectively.2.3. Electrochemical measurements
Electrocatalytic tests were conducted in N2-saturated 0.1 M KOH in a three-electrode electrochemical system using a rotating disk electrode (RDE) configuration (Pine Instrument Company, USA), which is controlled by a Gamry electrochemical workstation (Reference 3000). Ag/AgCl (KCl sat.) and Pt wire were adopted as the reference electrode and counter electrode, respectively.Preparation of the working electrode is described as follows: 7 mg catalyst was added into a solution containing 25 μL Nafion® 117 solution and 500 μL ethanol to generate a suspension by sonication. Then, 10 μL of the catalyst ink was dripped onto a glassy carbon electrode (5.0 mm in diameter) and dried in air. All potentials were converted into reversible hydrogen electrode (RHE) values based on eqn (1):
| ERHE = EAg/AgCl + 0.059pH + 0.197 V | (1) |
The electrodes were activated by running cyclic voltammetry (CV) cycles from 1.2 to 1.8 V (vs. RHE) at least 10 times till stable and reproducible curves were obtained. Then, polarization curves using linear sweep voltammetry (LSV) were recorded with a rotation speed of 1600 rpm at a scan rate of 5 mV s−1. The overpotential (η) was calculated according to the following formula:
| η = ERHE − 1.23 V | (2) |
All polarization plots were recorded after iR-correction. The accelerated durability tests (ADTs) for WO3@CoWO4-4 were conducted by measuring CV cycles at potentials from 1.164 to 1.764 V (vs. RHE) at a scan rate of 200 mV s−1. LSV of ADT after 1000 and 10![[thin space (1/6-em)]](https://www.rsc.org/images/entities/char_2009.gif) 000 CV cycles was recorded. To probe changes in double-layer capacitance (Cdl) during ADT, CV cycles were tested from 1.25 to 1.30 V at scan rates of 10, 20, 30, 40, and 60 mV s−1 before and after 1000 and 10
000 CV cycles was recorded. To probe changes in double-layer capacitance (Cdl) during ADT, CV cycles were tested from 1.25 to 1.30 V at scan rates of 10, 20, 30, 40, and 60 mV s−1 before and after 1000 and 10![[thin space (1/6-em)]](https://www.rsc.org/images/entities/char_2009.gif) 000 cycles. The corresponding capacitive current densities at 1.275 V were plotted as a function of scan rate. The slope of the fitted line equals twice the value of Cdl and represents electrochemically active surface area (EASA). The EASAs of the other samples were evaluated using the same method for comparison. Furthermore, the chronoamperometric response (i–t) of WO3@CoWO4-4 was estimated at 1.614 V (vs. RHE) in 0.1 M KOH at 1600 rpm.
000 cycles. The corresponding capacitive current densities at 1.275 V were plotted as a function of scan rate. The slope of the fitted line equals twice the value of Cdl and represents electrochemically active surface area (EASA). The EASAs of the other samples were evaluated using the same method for comparison. Furthermore, the chronoamperometric response (i–t) of WO3@CoWO4-4 was estimated at 1.614 V (vs. RHE) in 0.1 M KOH at 1600 rpm.
2.4. Photocatalytic oxygen evolution reaction tests
For each reaction, 50 mg catalyst was dispersed in 50 mL phosphate buffer solution and the pH value was adjusted to around 6.8, followed by addition of 0.49 g Na2SO4, 0.18 g Na2S2O8 and 0.03 g [Ru(bpy)3]Cl2·6H2O. After that, the solution was transferred to a sealed double jacketed reactor (800 mL) with a quartz window, which was connected to an on-line gas chromatograph (Agilent 490 Micro GC) with a thermal conductivity detector. To remove air in the reactor completely, N2 was pumped in for at least 30 min. Then, the solution was stabilized in the dark for 10 min, which was probed as the baseline. The solution was irradiated via a 300 W xenon lamp (Newport) through a light filter (λ > 420 nm) and aligned to 200 mW cm−2 (2 suns) to start the reaction. The reaction temperature was maintained at 25 °C by a flow of cooling water, controlled by a thermostatic water bath.2.5. Photoelectrochemical measurement
Photoelectrochemical tests were carried out on a Zennium workstation (Zahner, Germany) in a three-electrode framework, with an Ag/AgCl electrode as the reference electrode and a Pt plate (1.5 × 1.5 cm2) as the counter electrode. F-doped tin oxide (FTO) glasses were adopted as the photoanode substrate, which were cleaned before use under sonication with acetone, ethanol, and distilled water successively. Samples were loaded onto the FTO as below: 8 mg catalyst, 25 μL Nafion 117 solutions and 500 μL ethanol were mixed by ultrasonication and 40 μL of the resulting suspension was loaded onto the 1 × 1 cm2 FTO each time via a spin coating method. The photoanodes were obtained by annealing the FTO glasses at 300 °C for 30 min under an air atmosphere. The PEC properties were measured via the linear sweep voltammetry (LSV) method under irradiation of AM 1.5G simulated solar light (light intensity: 1 sun or 100 mW cm−2) from 0.6 to 1.8 V (vs. RHE) at a sweep rate of 10 mV s−1. Electrochemical impedance spectra (EIS) measurements were carried out in the dark and under irradiation, respectively, in a frequency range of 100 kHz to 100 mHz. Potentiostatic response was measured at 1.23 V (vs. RHE) under irradiation for 1 h. Na2SO4 solution (0.5 M, pH 6.8) as the electrolyte was purged with N2 for 30 min prior to the measurement. Mott–Schottky analysis was carried out at a frequency of 1 kHz.The details of materials characterization and DFT calculation methods are provided in the ESI.†
3. Results and discussion
3.1. Synthesis and structural analysis
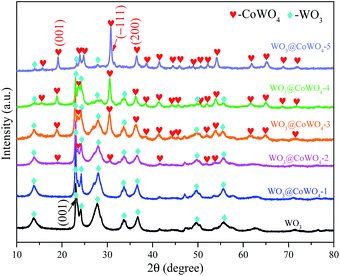
X-ray diffraction (XRD) patterns (Fig. 1) indicate that WO3 nanosheets have a hexagonal crystalline structure (h-WO3, JCPDS # 33-1387). Different WO3/CoWO4 molar ratios of 1![[thin space (1/6-em)]](https://www.rsc.org/images/entities/char_2009.gif) :
:![[thin space (1/6-em)]](https://www.rsc.org/images/entities/char_2009.gif) 0.026, 1
0.026, 1![[thin space (1/6-em)]](https://www.rsc.org/images/entities/char_2009.gif) :
:![[thin space (1/6-em)]](https://www.rsc.org/images/entities/char_2009.gif) 0.055, 1
0.055, 1![[thin space (1/6-em)]](https://www.rsc.org/images/entities/char_2009.gif) :
:![[thin space (1/6-em)]](https://www.rsc.org/images/entities/char_2009.gif) 0.083, 1
0.083, 1![[thin space (1/6-em)]](https://www.rsc.org/images/entities/char_2009.gif) :
:![[thin space (1/6-em)]](https://www.rsc.org/images/entities/char_2009.gif) 1 and 0.023
1 and 0.023![[thin space (1/6-em)]](https://www.rsc.org/images/entities/char_2009.gif) :
:![[thin space (1/6-em)]](https://www.rsc.org/images/entities/char_2009.gif) 1 were prepared from WO3@CoWO4-1, -2, -3, -4 to -5, respectively. Accordingly, the diffraction peaks of monoclinic CoWO4 (JCPDC 15-0867) increase gradually in the five samples with CoWO4 being the main phase in WO3@CoWO4-5.
1 were prepared from WO3@CoWO4-1, -2, -3, -4 to -5, respectively. Accordingly, the diffraction peaks of monoclinic CoWO4 (JCPDC 15-0867) increase gradually in the five samples with CoWO4 being the main phase in WO3@CoWO4-5.
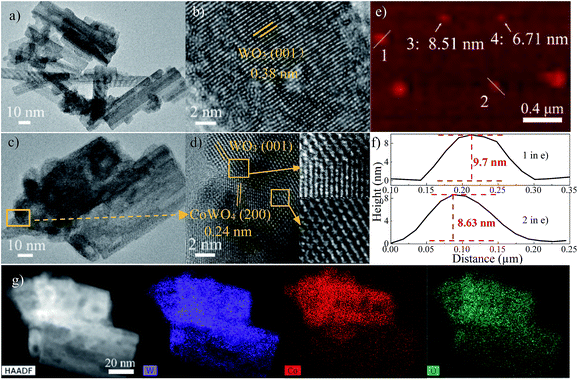
Transmission electron microscopy (TEM) images in Fig. 2a and S1a† reveal the nanosheet morphology of WO3. The high-resolution TEM (HRTEM) analysis indicates that (001) planes are the exposed planes of WO3 (Fig. 2b). WO3@CoWO4 composites display very similar nanosheet morphologies (Fig. 2c and S1–S5†). Fig. 2d (WO3@CoWO4-3) depicts the close atomic bonding between the (200) planes of CoWO4 and the (001) planes of WO3 with interface defects and vacancies caused by lattice mismatches. These defects or vacancies are also observed in other composites (Fig. S2–S5†). The presence of O vacancies in the composites can also be verified by the signal of W5+ (g = 1.96) in the representative solid-state EPR test on WO3@CoWO4-3 (Fig. S6†).20
Representative three-dimensional (3D) atomic force microscopy (AFM) measurements (Fig. 2e and f) on WO3@CoWO4-3 show that the nanosheets could be thinner than 10 nm. High angle annular dark field scanning TEM (HAADF-STEM) and corresponding energy-dispersive X-ray spectroscopy (EDX) elemental mapping images of the composites (Fig. 2g, S2c, S3c, S4c and S5c†) implicate the different coverage levels of CoWO4 on WO3. The full-scan X-ray photoelectron spectroscopy (XPS) spectra of WO3 and WO3@CoWO4-3 are provided in Fig. S7.† The peaks in W 4f spectra centering at 35.6 and 37.8 eV are ascribed to the spin–orbit splitting of W 4f7/2 and W 4f5/2, illustrating W6+ as the dominant valence state in both samples.21,22 In the O1s spectra (Fig. S7c†), the peak at 530.4 eV can be associated with oxygen bonded to metal species, whereas the one centred at 531.6 eV is typical of the low coordination oxygen ions on the surface.23,24 Co 2p spectrum featured the main peaks of Co 2p3/2 at 781.4 and Co 2p1/2 at 796.7 eV with separate satellite shake-up lines and spin energy separation of 15.3 eV, indicating the typical oxidation state of Co2+ (Fig. S7d†).22,23
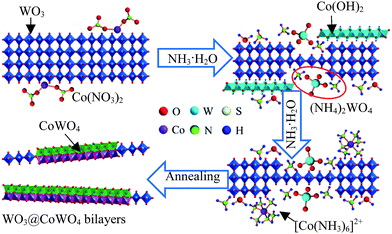
The formation mechanism of the bilayer nanosheet composite is briefly proposed in Fig. 3. During the dropwise addition of NH3·H2O into a Co(NO3)2 solution with dispersed WO3, Co(OH)2 formed initially, but it was dissolved by excess NH3·H2O to generate a [Co(NH3)6]2+ complex.25 Meanwhile, partial WO3 can be transformed into (NH4)2WO4 by NH3·H2O,26 which will interact with the [Co(NH3)6]2+ to form [Co(NH3)6]WO4 or CoWO4 sediments on the surface of residual WO3. After annealing in air, stable WO3@CoWO4 nanosheets were obtained. It is a simultaneous process of continuous WO3 exfoliation and in situ CoWO4 coating, which results in thinner layers of WO3 and CoWO4 in the composites.
3.2. Characterization of the electrochemical OER performance
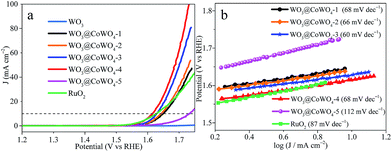
The electrocatalytic OER activity of the samples was evaluated using polarization curves (Fig. 4a). The overpotential at a current density (J) of 10 mA cm−2 is a criterion for assessing OER properties. WO3 was almost inactive in the electrocatalytic OER. With higher CoWO4 loading in the composites, the electrocatalytic activity increased dramatically and then declined. WO3@CoWO4-4 gave the smallest overpotential of 0.38 V, which is lower than that of commercial RuO2 (0.40 V). WO3@CoWO4-5 displayed an elevated overpotential, attributed to fewer interface defects from the low WO3 content. These defects can serve as catalytically active sites in the OER, proved by the DFT calculations shown later. The Tafel plots (Fig. 4b) indicated smaller Tafel slopes of WO3@CoWO4-1, -2, -3 and -4 than RuO2, suggesting their more favorable OER kinetics.27 WO3@CoWO4-5 showed a much higher Tafel slope. As the best OER catalyst, WO3@CoWO4-4 displayed excellent durability, as provided in Fig. S8 in the ESI.† In addition, WO3@CoWO4 composites all displayed much higher electrochemically active surface area (EASA) than WO3, with that of WO3@CoWO4-4 being the highest (Fig. S9†). This result indicates that abundant active sites were introduced into WO3 by the loading of CoWO4.3.3. Visible-light photocatalytic OER performance
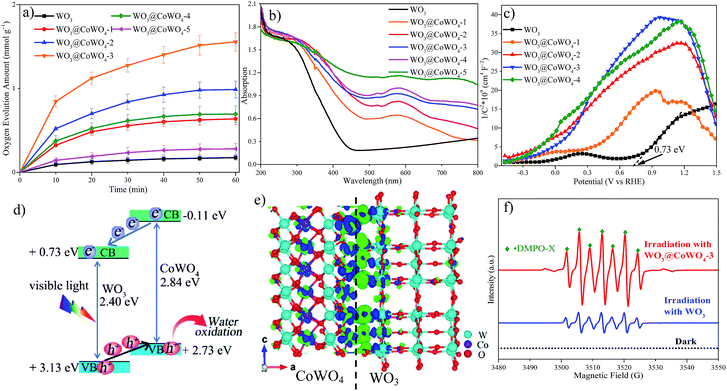
Fig. 5a displays photocatalytic OER activities of the samples. Enhanced performance was observed on WO3@CoWO4 composites compared with WO3. With rising CoWO4/WO3 ratios, the OER activity increased first and then decreased. WO3@CoWO4-3 presented the highest O2 evolution rate (1.6 mmol g−1 O2 in 1 h), which is over 9 times higher than that of WO3. This rate is among the highest values reported for nonprecious metallic OER catalysts, as compared in Table S2.†A series of photo-dependent tests were carried out on the synthesized samples. As shown in UV-visible diffuse reflectance spectra (UV-vis DRS, Fig. 5b), the visible light absorption intensity of the composites gradually improved with increasing CoWO4 loadings. In addition, a red shift occurred in the absorption band-edge of the composites, reflecting better absorption at longer wavelengths. WO3 presented a positive slope, typical of n-type semiconductors in the Mott–Schottky (M–S) plot (Fig. 5c). Since CoWO4 is a p-type semiconductor with a negative slope, inverted “V-shapes” were then observed on WO3@CoWO4 composites, reflecting a well-matched p–n heterostructure.28–30Fig. 5d shows a band structure diagram for the WO3@CoWO4 system. The conduction band minimum (CBM) of WO3 (0.73 eV) was evaluated from the flat band potential of the M–S plot (Fig. 5c). The band gap of WO3 (2.40 eV) was obtained from the Tauc's plot (Fig. S10†). VBM was acquired by the sum of CBM and band gap. Since we did not prepare pure CoWO4, the band structure data of CoWO4 were obtained by DFT calculations using the monoclinic CoWO4 slab (M-1, Fig. S11a†). The band gap (2.84 eV), CBM (−0.11 eV) and VBM (2.73 eV) of CoWO4 were obtained via the corresponding DOS (Fig. S11b†), which are close to the values reported in the literature.31 The band gap of the WO3@CoWO4 system can be narrowed with CoWO4 as the VBM, and WO3 as the CBM, which helps explain their better light-harvesting ability than WO3. Since the CBM of CoWO4 is more negative than that of WO3, it is thermodynamically favorable for the photo-excited electrons to move from CoWO4 to WO3. Meanwhile, the holes generated in the valence bands of the two semiconductors can transfer from WO3 to CoWO4 due to their potential difference in VBM. Due to effective electron–hole separation by the WO3@CoWO4 heterojunction, their recombination rates would be largely reduced, inducing the enhanced photoactivity.32 A large number of activated and migrated holes on the surface of CoWO4 can efficiently oxidize the adsorbed H2O molecules into O2. Although WO3@CoWO4-4 exhibited the best electrochemical OER performance, its photocatalytic OER activity was much lower than that of WO3@CoWO4-3. It is conjectured that the excessive coverage of CoWO4 on WO3 in WO3@CoWO4-4 might block the photon absorption of WO3, which impairs the function of WO3 in the heterostructure and leads to the deteriorated photocatalytic efficiency. As the OER tends to occur at the side of CoWO4 and WO3 is physically coated by CoWO4, the corrosion of WO3 by peroxo species generated during the OER process can be prevented. The stability of WO3 can be improved.
To explore the charge redistribution across the WO3@CoWO4 interface, molecular models including a hexagonal WO3 slab (M-2) and a WO3@CoWO4 slab (M-3) were constructed (as given in Fig. S12 in the ESI†). The charge redistribution across the interface (Fig. 5e) was explored by subtracting the electronic charge of M-3 from those of M-1 and M-2. In particular, charge accumulation mainly occurs at the side of WO3 while charge depletion focuses on CoWO4 near the interface. Therefore, an interface electric dipole forms at the interface, which enables electrons to transfer from CoWO4 to WO3 while the holes transfer from WO3 to CoWO4.33 This makes it easier for electron–hole transport and separation across the interface under light irradiation, which can also be experimentally demonstrated by photoluminescence (PL) spectra (Fig. S13†). As shown, the lower luminescence intensity of the composites compared to WO3 suggests the reduced charge recombination.
Room temperature in situ electron paramagnetic resonance (EPR) was performed in this water oxidation system with 5,5-dimethyl-1-pyrroline N-oxide (DMPO) as the trapping agent (Fig. 5f). No visible signal was obtained in the dark. Interestingly, active seven-line paramagnetic signals were captured as ˙DMPO-X under irradiation after adding WO3 or WO3@CoWO4-3, which might arise from the excessive oxidation of DMPO by the peroxide generated during the OER.34–36
In general, the water oxidation reaction proceeds via four-electron-transfer steps based on the following mechanism:27
Step 1
| * + H2O → *OH + H+ + e− |
Step 2
| *OH → *O + H+ + e− |
Step 3
| *O + H2O → *OOH + H+ + e− |
Step 4
| *OOH → O2 + H+ + e− |
Peroxo species (*OOH) serve as the intermediates in the third step and can be readily decomposed into O2. The system with WO3@CoWO4-3 displayed much stronger peak signals of DMPO-X than that with WO3, indicating the higher concentration of peroxo species and the more active OER performance.
3.4. Photoelectrochemical (PEC) OER performance
Based on the enhanced electro and photocatalytic OER performance of WO3@CoWO4 composites, their PEC properties were further evaluated. Current–voltage curves were first recorded in the dark (Fig. S14†). By comparison, all the photoanodes presented deeply enhanced anodic photocurrent densities upon illumination (Fig. 6a). Compared to WO3, the photocurrent density of the composites firstly improved significantly along with the increased loading of CoWO4 on WO3 with WO3@CoWO4-2 reaching a maximum. The photocurrent density of WO3@CoWO4-2 is about 2 times larger than that of WO3 at 1.3 V. However, the anodic photocurrent densities decreased dramatically in WO3@CoWO4-3, -4 and -5 with further higher ratios of CoWO4. Similar to the above discussion in the photocatalytic OER test, this phenomenon can be explained by the destruction of the optimum synergistic function of the heterostructure for PEC activity. The transient photoresponse of the composites was assessed by measuring i–t curves at 1.0 V (Fig. 6b). Prompt and steady photocurrent responses can be captured on the photoanodes during on and off cycles of illumination, which show the same trend as that in Fig. 6a. It is noted that an applied bias is imposed on the photoanode during the PEC OER, which promotes the output of the photogenerated electrons in WO3 through FTO-glass. The electron–hole recombination rate is reduced and thus the OER activity of WO3 is largely enhanced in the PEC test compared with that in photocatalysis. Due to the different mechanisms, WO3 exhibited the worst performance in photocatalysis but it was not the worst in the PEC OER and the optimal CoWO4/WO3 ratio was also different in the two systems.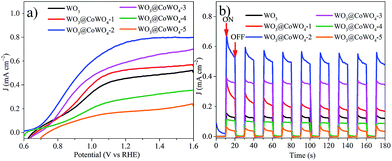 | ||
| Fig. 6 (a) Current–voltage curves of the composites under illumination; (b) i–t curves at a potential of 1.0 V (vs. RHE) under light ON–OFF cycling. | ||
EIS measurements were conducted on the photoanodes in the dark and under irradiation, respectively (Fig. S15†). Compared to those collected in the dark, all the semicircles in EIS were largely diminished under irradiation, proving the lowered charge transfer resistance by photo-induced charge carriers. In particular, WO3@CoWO4-2 exhibited the smallest resistance diameter, which helps explain its highest photocurrent response in the PEC test. Therefore, an appropriate construction of the WO3/CoWO4 heterostructure could effectively boost the conductivity and PEC activity of WO3.
Besides, the instability of WO3 caused by photo-corrosion was largely improved. As provided in Fig. S16,† WO3@CoWO4-2 (decayed by 4%) exhibited much better long-term PEC stability than WO3 (decayed by 57%) tested by the potentiostatic method.
3.5. DFT calculations for the OER
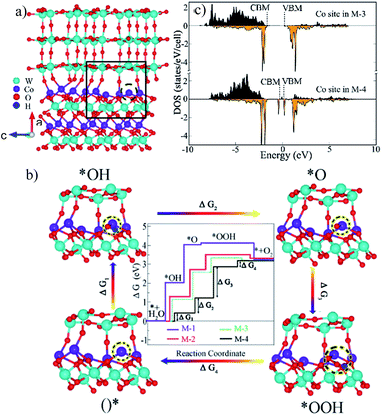
To study the effect of interface oxygen vacancies or defects (as verified by Fig. 2d, S3b, S4b and S5b) on the OER, M-4 (Fig. 7a) was built by removing an interface O in M-3. We probed adsorbates of *OH, *O and *OOH on the surfaces terminated with Co (200) of CoWO4 in M-1 (Fig. S17†) and (001) surface planes of WO3 in M-2 (Fig. S18†). For M-3 and M-4, the adsorbates on the selected Co site of the Co (200) interface were monitored, as provided in Fig. S19† and the inset images in Fig. 7b. This is because the OER prefers to occur on the side of CoWO4 in the composites due to migration of holes as analyzed in Fig. 5d and e. Moreover, Co sites are believed to be more active centres for the OER in CoWO4.37,38The specific Gibbs free energy changes during the four elementary steps are shown in Fig. 7b and Table S3.† All adsorption scenarios in the four models shared uphill/endothermic energy profiles from *OH (step 1), *O (step 2) to *OOH (step 3), suggesting that an external driving force (light irradiation or electrical potential) is required to initiate the OER reaction. Once the reaction got to *OOH, the diagrams became downhill/exothermic in M-1, M-2 and M-3, indicating that step 4 is likely to happen and *OOH will convert to O2 (step 4) automatically. The step with the highest free energy barrier is referred to as the overpotential-determining step.39 It was noted that steps 1 and 2 were the potential-determining steps of WO3, while these energy barriers were lower in CoWO4 with step 2 being the hardest one. CoWO4 was catalytically more active than WO3 in the OER. Compared with CoWO4, the energy barriers in steps 1, 2 and 3 were reduced in M-3, indicating the lowered OER overpotential on the WO3@CoWO4 interface. This can be associated with the hole accumulation at the side of CoWO4 across the interface (Fig. 5e). Interestingly, after an O was removed in the interface, the barriers in steps 1 and 2 were significantly lowered (M-4), implying a simpler adsorption of water molecules onto the active Co site (step 1) and easier formation of OH* (step 2). As these two initial steps were the hardest in M-1, M-2 and M-3, their easier proceedings promoted by interface-O-vacancy were considered to contribute considerably to the overall OER activity in WO3@CoWO4 composites. Therefore, the WO3@CoWO4 interface and especially interface-O-vacancies can serve as active sites for both electro, photo-catalytic and PEC oxidation of water.
DOS of the designated Co site in M-3 and M-4 were projected in Fig. 7c. In particular, the interface-O-vacancy induced dramatically increased DOS of the Co site at both VBM and CBM, which can accelerate the transport of photon-generated carriers under light irradiation.16,40 Faster diffusion kinetics, higher photoconversion efficiency and higher concentration of the photogenerated holes to react with H2O can be achieved. Thus, interface-O-vacancies can not only reduce OER energy barriers but also induce enhanced photo-responsive behavior.
4. Conclusions
In summary, a versatile method was proposed for the synthesis of WO3@CoWO4 bilayer nanosheets as excellent WOCs for enhanced visible-light-driven photo, electro-catalytic and PEC OER processes. Because of the theoretically reduced OER barriers by the WO3@CoWO4 interface and the interface-O-vacancies, WO3@CoWO4-4 displayed a low overpotential of 0.38 V in 0.1 M KOH for electrocatalysis. The creation of p–n heterojunctions and interface-O-vacancies can increase the photo-energy conversion efficiency and the water oxidation ability, enabling WO3@CoWO4-3 to present over 9 times higher O2 evolution rate than WO3. A larger photocurrent with high stability was also observed in WO3@CoWO4-2 for the PEC OER. The paradigm we presented in this work could provide a refreshing perspective for pursuing and designing more efficient low-dimensional photocatalytic, electrocatalytic and PEC OER catalysts.Conflicts of interest
There are no conflicts to declare.Acknowledgements
This work was supported by the Australian Research Council (DP150103026 and DP130101319). Y. Li acknowledges support from the NSFC (grant no. 11674131). The authors acknowledge the help from the Centre for Microscopy, Characterization and Analysis (CMCA) of The University of Western Australia and the WA X-Ray Surface Analysis Facility of Curtin University funded by the Australian Research Council LIEF grant LE120100026 for material characterization.References
- S. Y. Reece, J. A. Hamel, S. Sung, T. D. Jarvi, A. J. Esswein, J. J. H. Pijpers and D. G. Nocera, Science, 2011, 334, 645–648 CrossRef CAS PubMed.
- T. Hisatomi, J. Kubota and K. Domen, Chem. Soc. Rev., 2014, 43, 7520–7535 RSC.
- X. Zong, H. Yan, G. Wu, G. Ma, F. Wen, L. Wang and C. Li, J. Am. Chem. Soc., 2008, 130, 7176–7177 CrossRef CAS PubMed.
- T. Faunce, S. Styring, M. R. Wasielewski, G. W. Brudvig, A. W. Rutherford, J. Messinger, A. F. Lee, C. L. Hill, H. deGroot, M. Fontecave, D. R. MacFarlane, B. Hankamer, D. G. Nocera, D. M. Tiede, H. Dau, W. Hillier, L. Wang and R. Amal, Energy Environ. Sci., 2013, 6, 1074–1076 Search PubMed.
- A. R. Parent, R. H. Crabtree and G. W. Brudvig, Chem. Soc. Rev., 2013, 42, 2247–2252 RSC.
- J. T. Kirner and R. G. Finke, J. Mater. Chem. A, 2017, 5, 19560–19592 CAS.
- X. Li, J. Yu, J. Low, Y. Fang, J. Xiao and X. Chen, J. Mater. Chem. A, 2015, 3, 2485–2534 CAS.
- N. Zhang, X. Li, H. Ye, S. Chen, H. Ju, D. Liu, Y. Lin, W. Ye, C. Wang, Q. Xu, J. Zhu, L. Song, J. Jiang and Y. Xiong, J. Am. Chem. Soc., 2016, 138, 8928–8935 CrossRef CAS PubMed.
- J. Huang, Y. Zhang and Y. Ding, ACS Catal., 2017, 7, 1841–1845 CrossRef CAS.
- A. Martínez-García, V. K. Vendra, S. Sunkara, P. Haldankar, J. Jasinski and M. K. Sunkara, J. Mater. Chem. A, 2013, 1, 15235–15241 Search PubMed.
- B. Zhang, X. L. Zheng, O. Voznyy, R. Comin, M. Bajdich, M. Garcia-Melchor, L. L. Han, J. X. Xu, M. Liu, L. R. Zheng, F. P. G. de Arquer, C. T. Dinh, F. J. Fan, M. J. Yuan, E. Yassitepe, N. Chen, T. Regier, P. F. Liu, Y. H. Li, P. De Luna, A. Janmohamed, H. L. L. Xin, H. G. Yang, A. Vojvodic and E. H. Sargent, Science, 2016, 352, 333–337 CrossRef CAS PubMed.
- J. Zhang, P. Zhang, T. Wang and J. Gong, Nano Energy, 2015, 11, 189–195 CrossRef CAS.
- J. Yan, T. Wang, G. Wu, W. Dai, N. Guan, L. Li and J. Gong, Adv. Mater., 2015, 27, 1580–1586 CrossRef CAS PubMed.
- S. S. Kalanur, I.-H. Yoo, J. Park and H. Seo, J. Mater. Chem. A, 2017, 5, 1455–1461 CAS.
- C. Yu, W. Zhou, L. Zhu, G. Li, K. Yang and R. Jin, Appl. Catal., B, 2016, 184, 1–11 CrossRef CAS.
- J.-S. Li, Y. Wang, C.-H. Liu, S.-L. Li, Y.-G. Wang, L.-Z. Dong, Z.-H. Dai, Y.-F. Li and Y.-Q. Lan, Nat. Commun., 2016, 7, 11204 CrossRef CAS PubMed.
- T. Tian, J. Jiang and L. H. Ai, Electrochim. Acta, 2017, 224, 551–560 CrossRef CAS.
- H. Jia, J. Stark, L. Q. Zhou, C. Ling, T. Sekito and Z. Markin, RSC Adv., 2012, 2, 10874–10881 RSC.
- M. I. Ahmed, A. Adam, A. Khan, A. U. Rehman, M. Qamaruddin, M. N. Siddiqui and M. Qamar, Mater. Lett., 2016, 183, 281–284 CrossRef CAS.
- Z. Lou, M. Zhu, X. Yang, Y. Zhang, M.-H. Whangbo, B. Li and B. Huang, Appl. Catal., B, 2018, 226, 10–15 CrossRef CAS.
- J. Zhang, Y. Ma, Y. Du, H. Jiang, D. Zhou and S. Dong, Appl. Catal., B, 2017, 209, 253–264 CrossRef CAS.
- J. F. Moulder, W. F. Stickle, P. E. Sobol and K. D. Bomben, Phys. Electron. Inc., 1995, 261 Search PubMed.
- S. Chen, G. Yang, Y. Jia and H. Zheng, ChemElectroChem, 2016, 3, 1490–1496 CrossRef CAS.
- H. Zhang, W. Tian, L. Zhou, H. Sun, M. Tade and S. Wang, Appl. Catal., B, 2018, 223, 2–9 CrossRef CAS.
- R. F. Sultan, Phys. Chem. Chem. Phys., 2002, 4, 1253–1261 RSC.
- J. E. Yourey, J. B. Kurtz and B. M. Bartlett, J. Phys. Chem. C, 2012, 116, 3200–3205 CAS.
- H. Y. Wang, S. F. Hung, H. Y. Chen, T. S. Chan, H. M. Chen and B. Liu, J. Am. Chem. Soc., 2016, 138, 36–39 CrossRef CAS PubMed.
- J. Ke, J. Liu, H. Sun, H. Zhang, X. Duan, P. Liang, X. Li, M. O. Tade, S. Liu and S. Wang, Appl. Catal., B, 2017, 200, 47–55 CrossRef CAS.
- Z. Liu, J. Tian, D. Zeng, C. Yu, L. Zhu, W. Huang, K. Yang and D. Li, Mater. Res. Bull., 2017, 94, 298–306 CrossRef CAS.
- X. Yan, Z. Wu, C. Huang, K. Liu and W. Shi, Ceram. Int., 2017, 43, 5388–5395 CrossRef CAS.
- T. Montini, V. Gombac, A. Hameed, L. Felisari, G. Adami and P. Fornasiero, Chem. Phys. Lett., 2010, 498, 113–119 CrossRef CAS.
- C. Yu, G. Li, S. Kumar, K. Yang and R. Jin, Adv. Mater., 2014, 26, 892–898 CrossRef CAS PubMed.
- W. Fan, C. Li, H. Bai, Y. Zhao, B. Luo, Y. Li, Y. Ge, W. Shi and H. Li, J. Mater. Chem. A, 2017, 5, 4894–4903 CAS.
- R. G. Li, Y. X. Weng, X. Zhou, X. L. Wang, Y. Mi, R. F. Chong, H. X. Han and C. Li, Energy Environ. Sci., 2015, 8, 2377–2382 CAS.
- J. Tian, Z. Wu, Z. Liu, C. Yu, K. Yang, L. Zhu, W. Huang and Y. Zhou, Chin. J. Catal., 2017, 38, 1899–1908 CrossRef CAS.
- H. Zhang, W. Tian, X. Guo, L. Zhou, H. Sun, M. O. Tadé and S. Wang, ACS Appl. Mater. Interfaces, 2016, 8, 35203–35212 CAS.
- J. Suntivich, K. J. May, H. a. Gasteiger, J. B. Goodenough and Y. Shao-horn, Science, 2011, 334, 2010–2012 CrossRef PubMed.
- C. Ling, L. Q. Zhou and H. Jia, RSC Adv., 2014, 4, 24692–24697 RSC.
- B. T. Zhao, L. Zhang, D. X. Zhen, S. Yoo, Y. Ding, D. C. Chen, Y. Chen, Q. B. Zhang, B. Doyle, X. H. Xiong and M. L. Liu, Nat. Commun., 2017, 8, 14586 CrossRef CAS PubMed.
- F. C. Lei, Y. F. Sun, K. T. Liu, S. Gao, L. Liang, B. C. Pan and Y. Xie, J. Am. Chem. Soc., 2014, 136, 6826–6829 CrossRef CAS PubMed.
Footnotes |
| † Electronic supplementary information (ESI) available. See DOI: 10.1039/c8ta00555a |
| ‡ These authors contributed equally. |
| This journal is © The Royal Society of Chemistry 2018 |

