Deterioration mechanism of LiNi0.8Co0.15Al0.05O2/graphite–SiOx power batteries under high temperature and discharge cycling conditions†
Cheng
Liu
a,
Kun
Qian
bc,
Danni
Lei
ac,
Baohua
Li
a,
Feiyu
Kang
abc and
Yan-Bing
He
 *a
*a
aEngineering Laboratory for the Next Generation Power and Energy Storage Batteries, Graduate School at Shenzhen, Tsinghua University, Shenzhen, 518055, P. R. China. E-mail: he.yanbing@sz.tsinghua.edu.cn
bShenzhen Environmental Science and New Energy Technology Engineering Laboratory, Tsinghua-Berkeley Shenzhen Institute, Shenzhen 518055, P. R. China
cLaboratory of Advanced Materials, School of Materials Science and Engineering, Tsinghua University, Beijing 100084, P. R. China
First published on 23rd October 2017
Abstract
LiNi0.8Co0.15Al0.05O2 and graphite–SiOx composites have been considered as potential cathode and anode materials for next-generation batteries due to their high specific capacity. It is significant to illustrate the degradation mechanism of NCA/graphite–SiOx power batteries under various conditions for their wide application. In this study, 10 A h NCA/graphite–SiOx power batteries were prepared and their deterioration mechanism at different temperatures (25 °C, 45 °C, and 65 °C) and discharge rates (1C and 3C) was systematically investigated. The results show that the batteries experienced 15.02% and 52.17% capacity loss after 400 cycles at 25 °C and 45 °C at 1C, respectively, and 21.94% after 400 cycles at a discharge rate of 3C. The capacity loss is as high as 79.93% after only 150 cycles at 65 °C and 1C. The long-term cycling behavior of the batteries is strongly affected by temperature, whereas it is negligibly affected by the discharge rate. The reversible lithium loss from the NCA cathode and structure decay of graphite–SiOx are responsible for the capacity loss of the battery. Many lithium alkyl carbonate (Li2CO3 and ROCO2Li), fluorophosphate (LixPOyFz and LixPFy), LiF, and oxygenated species are observed on the surface of graphite–SiOx due to the decomposition of the electrolyte at high temperatures. These species are deposited on the separator and thus block the pores and hinder ion transport; this results in a great increase of battery resistance and sudden loss of battery capacity.
Introduction
LiNi0.8Co0.15Al0.05O2 (NCA) cathodes have been successfully commercialized in lithium-ion batteries (LIBs) as a power supply for electric vehicles due to their high specific capacity (200 mA h g−1), excellent cycling life, long-term storage characteristics, and low cost.1 In an NCA ternary material, Ni provides high reversible capacity, while the substitution of Co can effectively improve the rate capability and inhibit cation mixing, and the substitution of Al can improve the structural and thermal stability of the NCA.2,3 Graphite has been commonly used as an anode material in LIBs. However, there is still a great demand to further increase its capacity (372 mA h g−1) to develop batteries with higher power and energy densities.4 Silicon oxide (SiOx), which consists of Si nanoparticles embedded in a Si suboxide matrix and gives an improved cycle performance than pure Si materials, has received attention in recent years.5–8 However, SiOx anodes suffer from numerous limitations (i.e. rapid capacity fading and poor initial coulombic efficiency and rate capability), which still need to be solved for their practical use.9–11 The rational design of the graphite–SiOx hybrid anode is a useful method to tackle these problems and effectively enhance the electrochemical performance of SiOx-based anodes.9,12–17 It is believed that NCA/graphite–SiOx power batteries would be a significant class of the next-generation batteries.LIBs are commonly used in high temperature environments (>60 °C) like aerospace and traffic industries, which require LIBs to possess excellent high-temperature properties. Moreover, LIBs are playing significantly important roles in electric vehicles/plug-in hybrid electric vehicles (EV/PHEV) and energy storage systems (ESSs), which require power LIBs to be charged and discharged at comparably high power rates. It is commonly known that the degradation of batteries is greatly influenced by cell chemistry as well as by cycling conditions such as cycling temperature and cycling rate.18–20 The cell performance deteriorates eventually after extensive cycling under these extreme conditions due to the degradation of cell components such as the electrode (cathode and anode), separator, electrolyte, and current collector. Therefore, investigation of the decay mechanism under these extreme conditions is favourable to design batteries with better performance.
Generally, capacity degradation during cycling includes the following aspects: the loss of active material (via material dissolution, structural degradation, particle isolation, and electrode delamination), loss of reversible lithium (via SEI growth at the carbon anode due to electrolyte decomposition), and resistance increase (via the formation of passive films on the active particle surface, loss of electrical contact of the electrode with the current collector and conductive additives, and electrolyte consumption).21–24 It is worth noting that some efforts have been made to illustrate the degradation mechanism of batteries with different combinations of positive and negative electrodes under various high temperature and high rate charge/discharge conditions. Kostecki et al.25 studied the degradation mechanism of NCA/graphite pouch cells and found that the resistance of the residual NCA interparticle increases upon aging at 55 °C due to the poor residual electronic contact of single grains between submicrometer primary particles that accounts for the loss of cell power and capacity. Watanabe et al.19 investigated the capacity loss of NCA/graphite cells at 60 °C and found that many microcracks were generated on the inter-surface between primary particles. The electrolyte was injected into the NCA particle through the micro-cracks; this resulted in the formation of new SEI films on the primary particle surface along the micro-cracks and reduced the ionic/electric conductivity of the NCA particle.
The degradation mechanisms at high temperatures have also been widely studied in traditional cathode/anode batteries such as NCA/graphite,26,27 NCM/graphite,28,29 and LiFePO4/graphite.30–33 It has been found that the cathode mainly accounts for the degradation of the full battery. As is well-known, the application of graphite–SiOx and NCA is an effective way to improve the energy density of power LIBs. However, the capacity degradation of NCA/graphite–SiOx battery, especially under high temperature and large rate discharge conditions, is still not clear. Therefore, understanding of the degradation mechanism of NCA/graphite–SiOx batteries is very beneficial for better design and application of this kind of battery.
In this study, we investigated the degradation of NCA/graphite–SiOx batteries at different temperatures and discharge rates using 10 A h soft-packed full batteries via post-mortem analysis. Both structure deterioration and capacity loss of positive and negative electrodes of batteries after cycling at 25 °C, 45 °C, and 65 °C were investigated. Surface composition change of cathode and anode materials was also closely examined, and its effects on the electrochemical performance decay were extensively analyzed. It has been found that capacity loss is sensitive to the cycling temperature, but not to high discharge rate. High temperature promotes the reversible lithium loss from the NCA cathode and structure decay of the graphite–SiOx anode, which is responsible for capacity loss. Many lithium alkyl carbonate, fluorophosphate, LiF, and oxygenated species are observed on the surface of graphite–SiOx due to the decomposition of the electrolyte at high temperatures. These species are dissolved and deposited on the separator and thus block the pores and hinder ion transportation; this results in the sudden capacity loss under high temperature cycling.
Experimental
Battery assembly and electrochemical testing
Soft-packed full batteries with a nominal capacity of 10 A h were designed and prepared. The positive electrodes were prepared by coating a mixture of 91 wt% LiNi0.8Co0.15Al0.05O2, 4 wt% Super-P, 4 wt% polyvinylidene fluoride (PVDF), and 1 wt% carbon nanotubes (CNTs) onto the aluminum foil current collector. The negative electrodes were prepared by coating a copper foil current collector with a mixture of 93 wt% graphite–SiOx, 3 wt% Super-P, 2.4 wt% styrene-butadiene rubber (SBR), and 1.6 wt% carboxymethyl cellulose (CMC). The mass loading of the NCA cathode and graphite–SiOx anode was 15 mg cm−2 and 7.4 mg cm−2, respectively. The graphite–SiOx material was purchased from Shenzhen BTR New Energy Materials Co., Ltd, and the weight ratio of graphite and SiOx was 92.54![[thin space (1/6-em)]](https://www.rsc.org/images/entities/char_2009.gif) :
:![[thin space (1/6-em)]](https://www.rsc.org/images/entities/char_2009.gif) 7.46. The cycling performance of the batteries was examined between 3.0 and 4.2 V at 0.5C (5 A) charge rate and 1C (10 A) discharge rate at different temperatures (25 °C, 45 °C, and 65 °C) using a Land 2001A battery testing system in an ESPEC Environmental chamber to ensure a constant temperature. The 3C (30 A) discharge rate test was carried out using a Maccor battery system at ambient temperature. All the cells were first charged to 4.2 V and kept at 4.2 V until the current dropped to 0.05C (500 mA); then, the cells were discharged to 3.0 V. During the cycling tests, the real capacity of each cell was verified every 50 cycles by charge and discharge at 0.04C (400 mA). The electrochemical impedance spectra (EIS) of soft-packed NCA/graphite–SiOx batteries and coin cells before and after cycling tests were obtained using a VMP3 multichannel electrochemical station in the frequency range of 10−2–105 Hz with a perturbation of 5 mV after the batteries were charged to 4 V.
7.46. The cycling performance of the batteries was examined between 3.0 and 4.2 V at 0.5C (5 A) charge rate and 1C (10 A) discharge rate at different temperatures (25 °C, 45 °C, and 65 °C) using a Land 2001A battery testing system in an ESPEC Environmental chamber to ensure a constant temperature. The 3C (30 A) discharge rate test was carried out using a Maccor battery system at ambient temperature. All the cells were first charged to 4.2 V and kept at 4.2 V until the current dropped to 0.05C (500 mA); then, the cells were discharged to 3.0 V. During the cycling tests, the real capacity of each cell was verified every 50 cycles by charge and discharge at 0.04C (400 mA). The electrochemical impedance spectra (EIS) of soft-packed NCA/graphite–SiOx batteries and coin cells before and after cycling tests were obtained using a VMP3 multichannel electrochemical station in the frequency range of 10−2–105 Hz with a perturbation of 5 mV after the batteries were charged to 4 V.
Post-mortem analysis
To carry out the post-mortem analysis of the NCA cathode and graphite–SiOx anode, the fresh and cycled soft-packed batteries were discharged to 3 V at 1C and then transferred to a glove box under an argon atmosphere and were dissembled to take out the cathode and anode. The NCA and graphite–SiOx electrodes were rinsed with dimethyl carbonate (DMC) to remove the electrolyte from the cathode and anode surface. For determining the capacity of the cathode and anode, half-cells with NCA or graphite–SiOx as the cathode and lithium metal foil as the counter electrode were assembled using a CR2032 coin cell. A constant current protocol between 2.7 and 4.3 V (vs. Li+/Li) for the NCA coin cells and between 0.0005 and 3.0 V (vs. Li+/Li) for the graphite–SiOx coin cells was conducted to examine the capacity loss of NCA and graphite–SiOx electrodes using the Land CT2001A Battery Test System. EIS was carried out in the fully discharged state for the coin cells after 2 cycles at 0.04C.Material characterization
The element composition of graphite–SiOx was determined using Elementar (Vario EL cube, Germany). The X-ray diffraction (XRD) patterns of the NCA and graphite–SiOx samples before and after the cycling tests were obtained by a Rigaku D/max 2500/PC diffractometer (Rigaku Corp., Japan) using Cu Kα radiation in an angular range of 10–90° (2θ) with a 0.02° (2θ) step. The surface morphology and microstructure analyses were conducted using field emission scanning electron microscopy (FE-SEM, HITACH S4800, Japan) with energy dispersive X-ray spectroscopy (EDS). The cycled NCA electrodes were studied via Fourier transform infrared spectroscopy (FTIR, Nicolet iS10) at ambient temperature. X-ray photoelectron spectroscopy (XPS) measurements were conducted via a physical Electronics PHI5802 instrument using an X-rays magnesium anode (monochromatic Kα X-rays at 1253.6 eV) as the source.Results and discussion
Deterioration of full batteries during cycling test
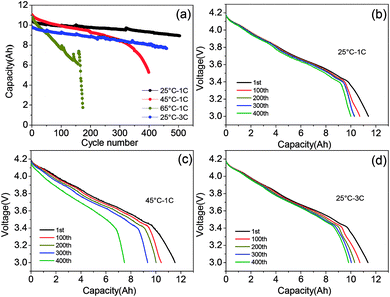
The morphology and electrochemical performance characterization of the graphite–SiOx anode and NCA cathode are displayed in Fig. S1–S4.† The XRD (Fig. S1†), mapping, and EDS (Fig. S3†) results of the raw negative powder material indicate that the anode material consists of graphite and SiOx particles. The SiOx particles are dispersed among graphite with a particle size of 5–15 μm. The NCA secondary particles with a compact structure consist of primary particles with a size of around 500 nm. The initial charge capacity of graphite–SiOx was 430.1 mA h g−1, and the spherical NCA secondary particles delivered an initial discharge capacity as high as 190 mA h g−1 at a 0.1C rate (Fig. S4†). NCA/graphite–SiOx soft-packed batteries were assembled according to the detailed parameters shown in Table S1.†Fig. 1a shows the comparison of the cycle performance of NCA/graphite–SiOx soft-packed batteries at different temperatures (25 °C, 45 °C, and 65 °C) and different discharge rates (1C and 3C). After 400 cycles, the capacity retention at 25 °C, 45 °C, and 3C is 88.6%, 43.8%, and 82.2%, respectively. The discharge capacity at 65 °C drops to 56.4% of the initial capacity after only 150 cycles. It is interesting to note that the long-term cycling behaviour of the cell is strongly affected by temperature, whereas it is not so much affected by the discharge rate. The low current charge/discharge profiles of NCA/graphite–SiOx batteries at 0.04C after cycling under different conditions were employed to detect the actual capacity without polarization. Fig. 1b shows that under 25 °C at 1C discharge rate cycling, with the cycle number increasing from 1st to 400th, the discharge curves hardly change and the discharge capacity slightly drops. However, after cycling at 45 °C and 1C discharge rate, the discharge platform decreases greatly along with the increase in the number of cycles, and the discharge capacity drops obviously (Fig. 1c). It can be seen that the capacity of the battery cycled at 65 °C increases during cycling. This is because after every 50 cycles of 0.5C/1C charge/discharge at 65 °C, the batteries were subjected to one cycle at 0.04C/0.04C charge/discharge rate to identify the residual capacity of batteries. The battery has been completely discharged at a very low discharge rate of 0.04C and more capacity was charged into the batteries at 0.5C after the cycle at the charge/discharge rate of 0.04C. In addition, the 0.04C/0.04C charge/discharge process can be considered as a reactivation process. Interestingly, as shown in Fig. 1d, although the discharge capacity at 25 °C – 3C is 1 A h lower than that at 25 °C – 1C, the actual capacity at 0.04C is almost the same, even after 400 cycles. In addition, the discharge profiles at 0.04C after 3C discharge cycling slightly change with an increase in the cycle number. These results indicate that high rate discharge cycling has hardly any destructive effect on the battery.
The electrode interface evolution of the NCA/graphite–SiOx batteries after high temperature and high-rate cycling tests was evaluated by the EIS measurements (Fig. 2). The EIS data was simulated by the Z-view software using an equivalent circuit, as shown in Fig. S6.† A typical EIS contains two partially overlapping semicircles and a straight slope line at low frequencies. The intersection of the EIS diagram with the real axis refers to bulk resistance (Rb), which reflects the ohmic resistance of the cell. The semicircle at high frequencies is often associated with resistance of surface films (Rsei and CPE1) on the active material and that at mid frequencies reflects charge-transfer resistance (Rct) and capacitance (CPE2).34–36 The straight slope line at low frequencies is related to the Warburg impedance (Zw) and lithium ion diffusion within particles. The simulated impedance parameters of resistances are presented in Table S2.† It is easily found that after cycling at high temperatures (45 °C and 65 °C), the Rb, Rct, and Rsei increased greatly as compared to the case of cycling at 25 °C – 1C and 25 °C – 3C. For the fresh battery, which was subjected to a formation process (the first charge/discharge process), the Rb was 14.76 mΩ. After cycling under 45 °C and 65 °C conditions, the Rb increased to 33.8 mΩ and 43.7 mΩ, respectively. The growth of Rb is usually caused by the decomposition of electrolytes at high temperatures, which leads to a decrease in the ion conductivity of the electrolytes.37,38 The Rsei increased to 5.84 mΩ and 29.11 mΩ after cycling at 45 °C and 65 °C, respectively. In addition, the EIS for both NCA and graphite–SiOx after cycling tests present that the resistance of the electrodes greatly increases after cycling at high temperatures (Fig. S7†). These results indicate that with the increasing cycling temperature, the interfacial side-reactions between the electrolyte and electrode deteriorate; this leads to severe decomposition of electrolytes. Moreover, an SEI film is continually formed; this causes the consumption of reversible lithium ions and increase of Rsei and Rct. It is unexpected to find that after cycling at 25 °C – 1C and 25 °C – 3C, the total resistances decrease to a certain extent. This can be explained by the thorough activation of the electrode and formation of an excellent SEI film. Under 25 °C – 1C and 25 °C – 3C cycling conditions, a much stable and appropriate SEI film may be formed on the anode, reducing the side reactions and elevating the ion conductivity at the electrode/electrolyte interface; this can possibly reduce the resistance of the whole battery system.30 This means that the high rate discharge process at ambient temperature has no negative influence on the battery resistance.
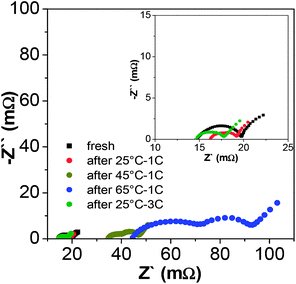 | ||
| Fig. 2 EIS curves of the batteries before and after cycling at different temperatures and discharge rates. | ||
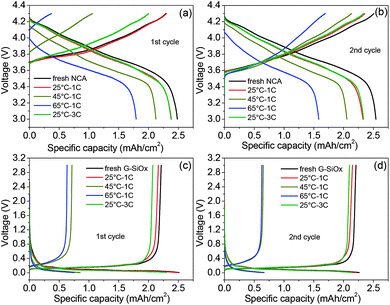
To identify the origin of the capacity loss, both the fresh and aged NCA/graphite–SiOx batteries were first fully discharged; then, the NCA cathode and graphite–SiOx anode were extracted, and their areal capacities were tested using coin cells with the lithium foil as the anode. Fig. 3a and b show the 1st and 2nd charge/discharge curves of the NCA cathode at 0.04C after the cycling test, respectively. The 1st charge capacity of the aged cathode reveals how much lithium remains in NCA after cycling (Fig. 3a). The lithium loss of the NCA cathode after cycling test is calculated by the difference in fresh and aged NCA charge capacity at 0.04C. The 1st charge capacities of the aged NCA cathode were 2.30, 1.06, 0.37, and 2.00 mA h cm−2 after 25 °C – 1C, 45 °C – 1C, 65 °C – 1C, and 25 °C – 3C cycling, respectively. The lithium ion losses in the cycled NCA cathode at 25 °C – 1C, 45 °C – 1C, 65 °C – 1C, and 25 °C – 3C were determined to be 0.30%, 52.60%, 83.66%, and 12.77%, respectively. The corresponding capacity loss of full batteries was 15.02%, 52.17%, 79.93%, and 21.94%. It is worth noting that the capacities of 1st discharge and the 2nd charge/discharge of the aged NCA electrode at 45 °C and 65 °C could be recovered to a great extent when the cycled NCA/Li half cell was charged and discharged again (Fig. 3b). This is because in a half cell, the lithium foil as a counter electrode can provide sufficient lithium ions to compensate the loss of reversible lithium ions in NCA. Therefore, it can be concluded that the lithium ion loss is a significant and dominant factor that leads to capacity loss of the battery during high temperature cycling, especially at 65 °C, but the layered structure of NCA is not destroyed completely. The 1st and 2nd charge/discharge curves of graphite–SiOx/Li show that the capacity of the graphite–SiOx anode cycled at 25 °C and 1C and 3C exhibits a very small decrease, whereas that at 45 °C and 65 °C decreases greatly and almost cannot be recovered when the cycled graphite–SiOx/Li cell is charged and discharged again (Fig. 3c and d). It can be concluded that the structure of anodes has been greatly degraded, and a passivation layer is formed on the surface. This result implies that the anode is also the main reason for the failure of batteries operated at temperatures above 45 °C.
Deterioration of the NCA cathode and graphite–SiOx anode
The deterioration of the structure of the NCA cathode was analysed to identify the sources of capacity loss of full batteries. Fig. 4 shows the XRD patterns of NCA after cycling under different conditions. The XRD peaks of all NCA electrodes in the fully discharged state are indexed as a hexagonal lattice with a space group of R3m, which indicate that the main structure of NCA is not destroyed, even after being cycled at 65 °C. After cycling under different conditions, the intensity of the (003) and (104) peaks for all NCA cathodes increases obviously; this suggests that the Li+/Ni2+ mixing is not severe when NCA is cycled at both high temperatures and high discharge rates. However, the peaks of (003) shifted to lower 2θ-angles after cycling at 45 °C, 65 °C, and 3C discharge rate; this indicated an extension in the c axis, which could be attributed to the extraction of lithium ions and increasing electrostatic repulsion between adjacent TM layers.39,40 Moreover, the peaks of the (101) facet shifted to higher 2θ-angles; this suggested a contraction of a and b axes in response to an increase in the average oxidation state of nickel and decrease in the Ni–O average bond length.41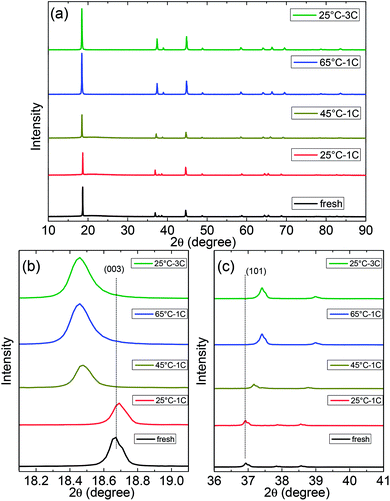 | ||
| Fig. 4 XRD patterns of the NCA electrodes under different cycling conditions: (a) full patterns, (b) (003) peaks, and (c) (101) peaks. | ||
This crystal structure change is reasonable for the high temperature cycled cathode since a considerable loss of lithium ions from the NCA structure occurs as abovementioned. However, a similar crystalline structure of NCA was observed after the high rate discharge cycling.42 Herein, it should be noted that after the last cycle of 3C discharge, the battery was not fully discharged at a low rate before disassembling. Therefore, large loss of lithium ions still exists in the cathode under the 25 °C – 3C condition. Thus, this unexpected XRD pattern did not contradict the conclusion of the previous analysis that high rate discharge had little influence on performance of the battery. From other point of view, it is proved that the bulk structure degradation of the NCA material after long-term high-temperature cycling is not very serious, which cannot be the primary reason for battery degradation. On the anode side, the XRD peaks of all graphite–SiOx electrodes after cycling are indexed well with the PDF card of graphite (Fig. S1†). It can be clearly seen that the main peak of graphite exhibits no shift for all the electrodes (Fig. S1b†). However, the intensities of the main peaks of electrodes cycled at 45 °C and 65 °C have obviously decreased as compared to those of the electrodes cycled at 25 °C – 1C and 25 °C – 3C (Fig. S1a† shows). These results indicate that the structure of graphite–SiOx electrodes has been greatly destroyed after the cycling test at 45 °C and 65 °C.
Furthermore, FTIR spectrum measurement was conducted to analyze the surface compositions of the electrodes (Fig. 5). It was seen that the surface components, such as Li2CO3 and ROCO2Li, were formed on the surface of the NCA cathode after the cycling test (Fig. 5a). No obvious difference can be clearly identified under different cycling conditions; this means the high temperature has minor effect on the side reactions occurring on the cathode surface. However, the FTIR spectra of graphite–SiOx presents great difference after cycling under different conditions (Fig. 5b). The graphite–SiOx anodes cycled under 45 °C – 1C and 65 °C – 1C conditions display much larger peaks of Li2CO3 (at 866, 1425, and 1500 cm−1), ROLi (1050 cm−1), and C–O, C–O–C species (1221 and 1316 cm−1),43 indicating that the by-products resulting from severe side reactions between the graphite–SiOx anode and electrolyte after cycling at 45 °C and 65 °C are much more in number than those obtained after cycling at 25 °C. The formation of a large amount of Li2CO3 means a large reversible lithium loss.44
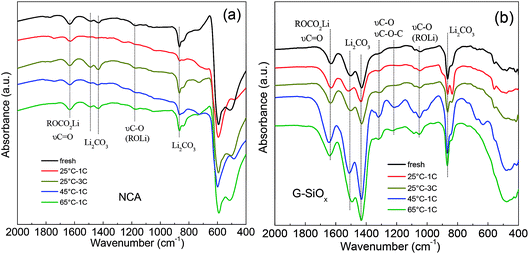 | ||
| Fig. 5 FTIR spectra of the cathodes (a) and anodes (b) before and after cycling under different conditions. | ||
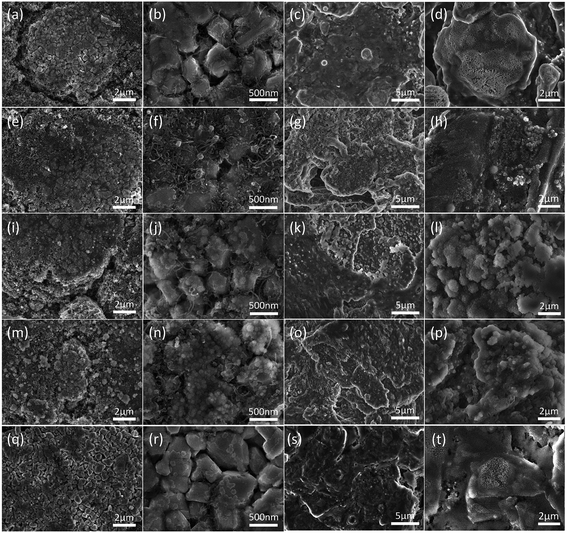
The side reactions between electrodes and electrolyte under different cycling conditions were further confirmed by the SEM images of the cathodes, anodes (Fig. 6), and the separator (Fig. S8†). As can be seen in Fig. 6, there is a relatively thin surface film on the surface of NCA primary particles derived from the by-products of the electrolyte decomposition. The surface films do not change obviously with an increase in cycling temperature. On the other hand, the SEI film on the surface of graphite–SiOx changes greatly with an increase in cycling temperature. It is seen that the by-products of the electrolyte decomposition after cycling at 45 °C (Fig. 6i, j, m and n) and 65 °C (Fig. 6k, l, o and p) are much more in number than those obtained after cycling at 25 °C; this indicates that a severe side reaction occurred at high temperatures. The SEM images of the separator surface morphology also strongly prove the side reaction between graphite–SiOx and electrolyte. It can be observed that the fresh membrane has a clean surface with no impurity on its surface (Fig. S8a and b†). However, after cycling at 45 °C, some spherical byproducts emerged on the separator (Fig. S8e and f†). After cycling at 65 °C, large number of byproducts were deposited on the separator surface and clogged separator pores (Fig. S8g and h†). The EDS results (Fig. S9†) show that as the cycling temperature increases from 25 °C to 45 °C and 65 °C, F becomes the main element of the decomposition byproducts, and the F content reaches as high as 57.5 wt% after 400 cycles at 45 °C, which is much higher than that obtained after cycling at 25 °C (17.86 wt%). The deposited F-containing species greatly reduced both the size of the pores and the homogeneity of the separator, thereby increasing the mean path length of the ions and consequently reducing the ion conductivity of the separator; this led to a great capacity drop during cycling (Fig. 1).
The FTIR spectrum and SEM images show great evidence of surface byproducts on the electrodes and separators after 45 °C and 65 °C cycling. The specific components of these by-products were further determined by XPS spectra analysis. The C 1s, P 2p, and F 1s spectra of the NCA cathodes before and after 25 °C – 1C and 45 °C – 1C cycling were examined to reveal the surface characteristics (Fig. S10†). The C 1s peak of the positive composite electrode (Fig. S10a in the ESI†) displays a narrow main peak at 284.8 eV, which is assigned to C–C species such as super-P (conductive element of the electrode). These species were distinctly reduced when the batteries were cycled after 400 cycles at 25 °C and 45 °C. Other peaks at 286.6 eV (C–O) and 289.3 eV (C![[double bond, length as m-dash]](https://www.rsc.org/images/entities/char_e001.gif) O), which are assigned to lithium alkyl carbonates (such as ROCO2Li and Li2CO3),45 increase slightly. It means the side reactions on the positive electrodes are not severe, corresponding well with the FTIR results.
O), which are assigned to lithium alkyl carbonates (such as ROCO2Li and Li2CO3),45 increase slightly. It means the side reactions on the positive electrodes are not severe, corresponding well with the FTIR results.
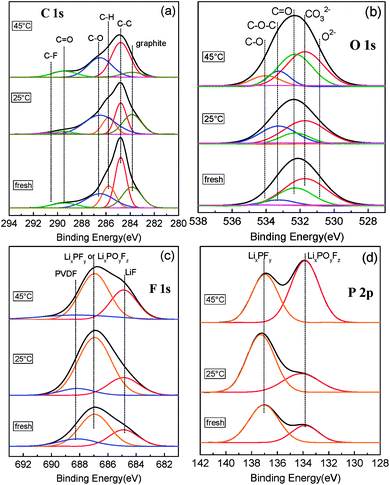
The XPS spectra of C 1s, O 1s, F 1s, and P 2p of fresh and aged graphite–SiOx electrodes are presented in Fig. 7. For the C 1s spectra (Fig. 7a), the peak at 283.8 eV assigned to the graphite component reduced greatly after long term 45 °C cycling. It is suggested that a thick passivation film is formed on the surface of the negative electrode. In addition, a peak at 289.5 eV assigned to C![[double bond, length as m-dash]](https://www.rsc.org/images/entities/char_e001.gif) O species with large intensity can be found,46,47 in accordance with the FTIR results (Fig. 5b). This is consistent with the formation of carbonates (Li2CO3 and ROCO2Li) resulting from the degradation of the solvent.48,49 The formation of a large amount of Li2CO3 can further be confirmed by the Li 1s spectra (Fig. S11a†) with a strong intensity peak of Li2CO3 at 55.1 eV.50
O species with large intensity can be found,46,47 in accordance with the FTIR results (Fig. 5b). This is consistent with the formation of carbonates (Li2CO3 and ROCO2Li) resulting from the degradation of the solvent.48,49 The formation of a large amount of Li2CO3 can further be confirmed by the Li 1s spectra (Fig. S11a†) with a strong intensity peak of Li2CO3 at 55.1 eV.50
The O 1s XPS core peaks of graphite–SiOx show that the peaks of C–O, C![[double bond, length as m-dash]](https://www.rsc.org/images/entities/char_e001.gif) O, and CO32− greatly increase after cycling at 45 °C as compared to the case of the fresh electrode (Fig. 7b). This means that under high temperature cycling, a number of oxygenated species are also deposited on the anode surface, which are the main components of the SEI film.51 As for the F 1s and the P 2p spectrum presented in Fig. 7c and d, respectively, graphite–SiOx anode after 45 °C cycling shows great intensity increase of the peaks at 687.0 eV (LixPOyFz or LixPFy) and 684.8 eV (LiF)52 in the F 1s spectrum and 133.8 eV (LixPOyFz) in the P 2p spectrum. This is consistent with the EDS results of the separator surface on the anode side (Fig. S9e and f†), where F is the main element of the particles. The evolution of these species indicates that a certain amount of LiF is formed and deposited on the surface of the anode after cycling, which becomes the main component of the outmost surface of the SEI film. LixPFy can exist in several forms such as PO43− ions or organic oligomers with a phosphate-ending –O–PO(OR)2, where R is an alkyl chain.53
O, and CO32− greatly increase after cycling at 45 °C as compared to the case of the fresh electrode (Fig. 7b). This means that under high temperature cycling, a number of oxygenated species are also deposited on the anode surface, which are the main components of the SEI film.51 As for the F 1s and the P 2p spectrum presented in Fig. 7c and d, respectively, graphite–SiOx anode after 45 °C cycling shows great intensity increase of the peaks at 687.0 eV (LixPOyFz or LixPFy) and 684.8 eV (LiF)52 in the F 1s spectrum and 133.8 eV (LixPOyFz) in the P 2p spectrum. This is consistent with the EDS results of the separator surface on the anode side (Fig. S9e and f†), where F is the main element of the particles. The evolution of these species indicates that a certain amount of LiF is formed and deposited on the surface of the anode after cycling, which becomes the main component of the outmost surface of the SEI film. LixPFy can exist in several forms such as PO43− ions or organic oligomers with a phosphate-ending –O–PO(OR)2, where R is an alkyl chain.53
Conclusions
In this study, the impacts of temperature and discharge rate on the cycling degradation of high-power NCA/graphite–SiOx soft-packed batteries are systematically investigated using soft-packed batteries and post-mortem analysis. The capacity losses are 11.4%, 57.2%, and 17.8% for cycling at 25 °C – 1C, 45 °C – 1C, and 25 °C – 3C after 400 long term cycles and 43.6% at 65 °C – 1C after 150 cycles, respectively. The EIS of full batteries indicates that Rb, Rct, and Rsei increase greatly after cycling at high temperatures (45 °C and 65 °C), whereas only minor change in resistance is observed after cycling at 25 °C at both a discharge rate of 1C and 3C. Half-cell study indicates that the capacity of the NCA cathode can be largely recovered, whereas a considerable capacity loss found for the graphite–SiOx anodes after high-temperature cycling cannot be recovered. The FTIR spectra reveal that many lithium alkyl carbonates, such as Li2CO3 and ROCO2Li, are formed on the anode surface, whereas on the cathode surface, these are formed in a very little quantity after high temperature cycling. XPS measurements show that on the anode surfaces, a great amount of carbonate (Li2CO3 and ROCO2Li), fluorophosphate (LixPOyFz and LixPFy), LiF, and oxygenated species are found after cycling at 45 °C. These species, which originate from the decomposition of electrolyte deposited on the separator in large area, reducing both the size of the pores and the homogeneity of the separator, increase the mean path length of the ions transport and finally lead to a great capacity drop at 65 °C. All the results indicate that the power fading of full batteries is attributed to the severe side reaction on the negative electrode surface under high temperature cycling.Conflicts of interest
There are no conflicts to declare.Acknowledgements
This work was supported by the National Key Basic Research Program of China (2014CB932400), the National Natural Science Foundation of China (51672156 and 51232005), the Guangdong special support program (2015TQ01N401), the Production-study-research cooperation project of Guangdong province (No. 2014B090901021), the Dongguan City (2015509119213), the Shenzhen Technical Plan Project (KQJSCX20160226191136, JCYJ20150331151536444, JCYJ20170412170706047), and the Dongguan ADF battery co., LTD.Notes and references
- J. H. Lee, C. S. Yoon, J.-Y. Hwang, S.-J. Kim, F. Maglia, P. Lamp, S.-T. Myung and Y.-K. Sun, Energy Environ. Sci., 2016, 9, 2152–2158 CAS.
- K. Kleiner, D. Dixon, P. Jakes, J. Melke, M. Yavuz, C. Roth, K. Nikolowski, V. Liebau and H. Ehrenberg, J. Power Sources, 2015, 273, 70–82 CrossRef CAS.
- A. Manthiram, B. Song and W. Li, Energy Storage Mater., 2017, 6, 125–139 CrossRef.
- W. J. Lee, T. H. Hwang, J. O. Hwang, H. W. Kim, J. Lim, H. Y. Jeong, J. Shim, T. H. Han, J. Y. Kim, J. W. Choi and S. O. Kim, Energy Environ. Sci., 2014, 7, 621–626 CAS.
- Y. Nagao, H. Sakaguchi, H. Honda, T. Fukunaga and T. Esaka, J. Electrochem. Soc., 2004, 151, A1572–A1575 CrossRef CAS.
- T. Tabuchi, H. Yasuda and M. Yamachi, J. Power Sources, 2005, 146, 507–509 CrossRef CAS.
- K. Yasuda, Y. Kashitani, S. Kizaki, K. Takeshita, T. Fujita and S. Shimosaki, J. Power Sources, 2016, 329, 462–472 CrossRef CAS.
- L. Zhang, X. Liu, Q. Zhao, S. Dou, H. Liu, Y. Huang and X. Hu, Energy Storage Mater., 2016, 4, 92–102 CrossRef.
- S. Yoshida, T. Okubo, Y. Masuo, Y. Oba, D. Shibata, M. Haruta, T. Doi and M. Inaba, Electrochemistry, 2017, 85, 403–408 CrossRef CAS.
- J. H. Kim, H. J. Sohn, H. Kim, G. Jeong and W. Choi, J. Power Sources, 2007, 170, 456–459 CrossRef CAS.
- W. R. Liu, Y. C. Yen, H. C. Wu, M. Winter and N. L. Wu, J. Appl. Electrochem., 2009, 39, 1643–1649 CrossRef CAS.
- J. H. Yom, J. K. Lee and W. Y. Yoon, J. Appl. Electrochem., 2015, 45, 397–403 CrossRef CAS.
- J. Z. Zhang, J. Zhang, T. Z. Bao, X. H. Xie and B. J. Xia, J. Power Sources, 2017, 348, 16–20 CrossRef CAS.
- Q. L. Zhang, N. Lin, T. J. Xu, K. Z. Shen, T. Q. Li, Y. Han, J. Zhou and Y. T. Qian, RSC Adv., 2017, 7, 39762–39766 RSC.
- N. Liu, Z. D. Lu, J. Zhao, M. T. McDowell, H. W. Lee, W. T. Zhao and Y. Cui, Nat. Nanotechnol., 2014, 9, 187–192 CrossRef CAS PubMed.
- H. Wu, G. Y. Zheng, N. A. Liu, T. J. Carney, Y. Yang and Y. Cui, Nano Lett., 2012, 12, 904–909 CrossRef CAS PubMed.
- N. Liu, H. Wu, M. T. McDowell, Y. Yao, C. M. Wang and Y. Cui, Nano Lett., 2012, 12, 3315–3321 CrossRef CAS PubMed.
- F.-D. Yu, Z.-B. Wang, F. Chen, J. Wu, X.-G. Zhang and D.-M. Gu, J. Power Sources, 2014, 262, 104–111 CrossRef CAS.
- S. Watanabe, M. Kinoshita, T. Hosokawa, K. Morigaki and K. Nakura, J. Power Sources, 2014, 258, 210–217 CrossRef CAS.
- X. L. Li, K. Qian, Y. B. He, C. Liu, D. C. An, Y. Y. Li, D. Zhou, Z. Q. Lin, B. H. Li, Q. H. Yang and F. Y. Kang, J. Mater. Chem. A, 2017, 5, 18888–18895 CAS.
- S. K. Jung, H. Gwon, J. Hong, K. Y. Park, D. H. Seo, H. Kim, J. Hyun, W. Yang and K. Kang, Adv. Energy Mater., 2014, 4, 1300787 CrossRef.
- L. J. Yang, X. Q. Cheng, Y. Z. Gao, P. J. Zuo, Y. L. Ma, C. Y. Du, B. Shen, Y. Z. Cui, T. Guan and G. P. Yin, ACS Appl. Mater. Interfaces, 2014, 6, 12962–12970 CAS.
- Y. Z. Cui, C. Y. Du, G. P. Yin, Y. Z. Gao, L. L. Zhang, T. Guan, L. J. Yang and F. P. Wang, J. Power Sources, 2015, 279, 123–132 CrossRef CAS.
- M. Grutzke, V. Kraft, B. Hoffmann, S. Klamor, J. Diekmann, A. Kwade, M. Winter and S. Nowak, J. Power Sources, 2015, 273, 83–88 CrossRef.
- R. Kostecki and F. McLarnon, Electrochem. Solid-State Lett., 2002, 7, 380–383 CrossRef.
- R. Kostecki, L. Norin, X. Song and F. McLarnon, J. Electrochem. Soc., 2004, 151, 522–526 CrossRef.
- P. Keil and A. Jossen, J. Electrochem. Soc., 2016, 164, 6066–6074 CrossRef.
- K. Qian, Y. Li, Y.-B. He, D. Liu, Y. Zheng, D. Luo, B. Li and F. Kang, RSC Adv., 2016, 6, 76897–76904 RSC.
- Y. Li, K. Qian, Y.-B. He, Y. V. Kaneti, D. Liu, D. Luo, H. Li, B. Li and F. Kang, J. Power Sources, 2017, 342, 24–30 CrossRef CAS.
- Y. Zheng, Y.-B. He, K. Qian, B. Li, X. Wang, J. Li, S. W. Chiang, C. Miao, F. Kang and J. Zhang, Electrochim. Acta, 2015, 176, 270–279 CrossRef CAS.
- Y. Zheng, Y.-B. He, K. Qian, B. Li, X. Wang, J. Li, C. Miao and F. Kang, J. Alloys Compd., 2015, 639, 406–414 CrossRef CAS.
- Y. Zheng, K. Qian, D. Luo, Y. Li, Q. Lu, B. Li, Y.-B. He, X. Wang, J. Li and F. Kang, RSC Adv., 2016, 6, 30474–30483 RSC.
- Y. Zheng, Y.-B. He, K. Qian, D. Liu, Q. Lu, B. Li, X. Wang, J. Li and F. Kang, Ionics, 2017, 23, 1967–1978 CrossRef CAS.
- F. Nobili, F. Croce, B. Scrosati and R. Marassi, Chem. Mater., 2001, 13, 1642–1646 CrossRef CAS.
- D. Aurbach, K. Gamolsky, B. Markovsky, G. Salitra, Y. Gofer, U. Heider, R. Oesten and M. Schmidt, J. Electrochem. Soc., 2000, 147, 1322–1331 CrossRef CAS.
- Y. C. Zhang and C. Y. Wang, J. Electrochem. Soc., 2009, 156, A527–A535 CrossRef CAS.
- D. Aurbach, B. Markovsky, I. Weissman, E. Levi and Y. Ein-Eli, Electrochim. Acta, 1999, 45, 67–86 CrossRef CAS.
- D. Aurbach, E. Zinigrad, Y. Cohen and H. Teller, Solid State Ionics, 2002, 148, 405–416 CrossRef CAS.
- S. Laubach, S. Laubach, P. C. Schmidt, D. Ensling, S. Schmid, W. Jaegermann, A. Thissen, K. Nikolowski and H. Ehrenberg, Phys. Chem. Chem. Phys., 2009, 11, 3278–3289 RSC.
- O. Dolotko, A. Senyshyn, M. J. Muhlbauer, K. Nikolowski and H. Ehrenberg, J. Power Sources, 2014, 255, 197–203 CrossRef CAS.
- T.-F. Yi, W. Tao, B. Chen, Y.-R. Zhu, S.-Y. Yang and Y. Xie, Electrochim. Acta, 2016, 188, 686–695 CrossRef CAS.
- T.-F. Yi, Y.-M. Li, S.-Y. Yang, Y.-R. Zhu and Y. Xie, ACS Appl. Mater. Interfaces, 2016, 8, 32349–32359 CAS.
- Y. B. He, F. Ning, B. H. Li, Q. S. Song, W. Lv, H. D. Du, D. Y. Zhai, F. Y. Su, Q. H. Yang and F. Y. Kang, J. Power Sources, 2012, 202, 253–261 CrossRef CAS.
- T.-F. Yi, J. Mei and Y.-R. Zhu, J. Power Sources, 2016, 316, 85–105 CrossRef CAS.
- P. Verma, P. Maire and P. Novák, Electrochim. Acta, 2010, 55, 6332–6341 CrossRef CAS.
- S. H. Kang, D. P. Abraham, A. Xiao and B. L. Lucht, J. Power Sources, 2008, 175, 526–532 CrossRef CAS.
- M. Lu, H. Cheng and Y. Yang, Electrochim. Acta, 2008, 53, 3539–3546 CrossRef CAS.
- R. Fong, U. Vonsacken and J. R. Dahn, J. Electrochem. Soc., 1990, 137, 2009–2013 CrossRef CAS.
- D. Aurbach, A. Zaban, A. Schechter, Y. Eineli, E. Zinigrad and B. Markovsky, J. Electrochem. Soc., 1995, 142, 2873–2882 CrossRef CAS.
- A. M. Andersson, A. Henningson, H. Siegbahn, U. Jansson and K. Edström, J. Power Sources, 2003, 119, 522–527 CrossRef.
- R. Dedryvere, L. Gireaud, S. Grugeon, S. Laruelle, J. M. Tarascon and D. Gonbeau, J. Phys. Chem. B, 2005, 109, 15868–15875 CrossRef CAS PubMed.
- L. Zhou, S. Dalavi, M. Xu and B. L. Lucht, J. Power Sources, 2011, 196, 8073–8084 CrossRef CAS.
- S. Laruelle, S. Pilard, P. Guenot, S. Grugeon and J.-M. Tarascon, J. Electrochem. Soc., 2004, 151, A1202–A1209 CrossRef CAS.
Footnote |
| † Electronic supplementary information (ESI) available. See DOI: 10.1039/c7ta08703a |
| This journal is © The Royal Society of Chemistry 2018 |

